SlideShare une entreprise Scribd logo
1  sur  7
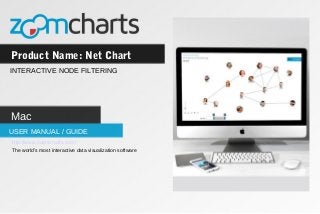
Product Name: Net Chart
USER MANUAL / GUIDE
INTERACTIVE NODE FILTERING
Mac
http://www.zoomcharts.com/
The world’s most interactive data visualization software
Product Name: Net Chart
INTERACTIVE NODE FILTERING
ZoomCharts’ advanced data visualization software makes viewing and analyzing your data easier
than ever before. The Node Filtering tool features an easy to use slider that lets you view exactly the
data you need while temporarily hiding others based on the filtering options of your choice.
ZoomCharts’ Interactive Node Filtering feature is currently being used to enhance data visualization in
a number of educational fields, including sciences and mathematics, such as anatomy, biochemistry,
ecology, microbiology, nutrition, neuroscience, physiology, zoology, chemical engineering,
geochemistry, molecular biology, geology, paleontology, physics, astronomy, algebra, computer
science, geometry, logic, and statistics, and the arts such as, music, dance, theatre, film, animation,
architecture, applied arts, photography, graphic design, interior design, and mixed media.
- Customize your graph to view exactly what you want
- Filter and view data easily using a slider
- Change node display with simple drag and drop
Step 1:
Use the slider to filter the data you want displayed.
https://zoomcharts.com/en/gallery/all:node-filter
Step 2:
Drag and drop nodes to rearrange the graph.
https://zoomcharts.com/en/gallery/all:node-filter
Step 3:
Zoom in and out of the graph by swiping up or down with your mouse scroll pad.
https://zoomcharts.com/en/gallery/all:node-filter
Step 4:
Move the slider points back to the ends to display full data set.
https://zoomcharts.com/en/gallery/all:node-filter
Network Chart
Big network exploration
Explore linked data sets. Highlight relevant data with dynamic filters and visual styles.
Incremental data loading. Exploration with focus nodes.
Time Chart
Time navigation and exploration tool
Browse activity logs, select time ranges. Multiple data series and value axes.
Switch between time units.
Pie Chart
Amazingly intuitive hierarchical data exploration
Get quick overview of your data and drill down when necessary. All in a single easy to use chart.
Facet Chart
Scrollable bar chart with drill-down
Compare values side by side and provide easy access to the long tail.
ZoomCharts
http://www.zoomcharts.com/
The world’s most interactive data visualization software
Check out ZoomCharts products:

Contenu connexe

En vedette (7)

Rupieciarnia - Profesjonalny blog pisany na czuja
Rupieciarnia - Profesjonalny blog pisany na czujaRupieciarnia - Profesjonalny blog pisany na czuja
Rupieciarnia - Profesjonalny blog pisany na czuja
 
Aniket 07.10.15
Aniket 07.10.15Aniket 07.10.15
Aniket 07.10.15
 
Blog o palonej kawie - Good Coffee
Blog o palonej kawie - Good CoffeeBlog o palonej kawie - Good Coffee
Blog o palonej kawie - Good Coffee
 
5 The seed of the woman
5 The seed of the woman5 The seed of the woman
5 The seed of the woman
 
Cam on doi
Cam on doiCam on doi
Cam on doi
 
IR Center - Zaangażowanie na blogach
IR Center - Zaangażowanie na blogachIR Center - Zaangażowanie na blogach
IR Center - Zaangażowanie na blogach
 
Original diamond earrings in sydney
Original diamond earrings in sydneyOriginal diamond earrings in sydney
Original diamond earrings in sydney
 

Dernier

Cloud Frontiers: A Deep Dive into Serverless Spatial Data and FME
Cloud Frontiers:  A Deep Dive into Serverless Spatial Data and FMECloud Frontiers:  A Deep Dive into Serverless Spatial Data and FME
Cloud Frontiers: A Deep Dive into Serverless Spatial Data and FME
Safe Software
 
Architecting Cloud Native Applications
Architecting Cloud Native ApplicationsArchitecting Cloud Native Applications
Architecting Cloud Native Applications
WSO2
 
Finding Java's Hidden Performance Traps @ DevoxxUK 2024
Finding Java's Hidden Performance Traps @ DevoxxUK 2024Finding Java's Hidden Performance Traps @ DevoxxUK 2024
Finding Java's Hidden Performance Traps @ DevoxxUK 2024
Victor Rentea
 
Cloud Frontiers: A Deep Dive into Serverless Spatial Data and FME
Cloud Frontiers:  A Deep Dive into Serverless Spatial Data and FMECloud Frontiers:  A Deep Dive into Serverless Spatial Data and FME
Cloud Frontiers: A Deep Dive into Serverless Spatial Data and FME
Safe Software
 

Dernier (20)

Apidays New York 2024 - Scaling API-first by Ian Reasor and Radu Cotescu, Adobe
Apidays New York 2024 - Scaling API-first by Ian Reasor and Radu Cotescu, AdobeApidays New York 2024 - Scaling API-first by Ian Reasor and Radu Cotescu, Adobe
Apidays New York 2024 - Scaling API-first by Ian Reasor and Radu Cotescu, Adobe
 
AWS Community Day CPH - Three problems of Terraform
AWS Community Day CPH - Three problems of TerraformAWS Community Day CPH - Three problems of Terraform
AWS Community Day CPH - Three problems of Terraform
 
Apidays New York 2024 - Passkeys: Developing APIs to enable passwordless auth...
Apidays New York 2024 - Passkeys: Developing APIs to enable passwordless auth...Apidays New York 2024 - Passkeys: Developing APIs to enable passwordless auth...
Apidays New York 2024 - Passkeys: Developing APIs to enable passwordless auth...
 
Boost Fertility New Invention Ups Success Rates.pdf
Boost Fertility New Invention Ups Success Rates.pdfBoost Fertility New Invention Ups Success Rates.pdf
Boost Fertility New Invention Ups Success Rates.pdf
 
FWD Group - Insurer Innovation Award 2024
FWD Group - Insurer Innovation Award 2024FWD Group - Insurer Innovation Award 2024
FWD Group - Insurer Innovation Award 2024
 
Polkadot JAM Slides - Token2049 - By Dr. Gavin Wood
Polkadot JAM Slides - Token2049 - By Dr. Gavin WoodPolkadot JAM Slides - Token2049 - By Dr. Gavin Wood
Polkadot JAM Slides - Token2049 - By Dr. Gavin Wood
 
Cloud Frontiers: A Deep Dive into Serverless Spatial Data and FME
Cloud Frontiers:  A Deep Dive into Serverless Spatial Data and FMECloud Frontiers:  A Deep Dive into Serverless Spatial Data and FME
Cloud Frontiers: A Deep Dive into Serverless Spatial Data and FME
 
EMPOWERMENT TECHNOLOGY GRADE 11 QUARTER 2 REVIEWER
EMPOWERMENT TECHNOLOGY GRADE 11 QUARTER 2 REVIEWEREMPOWERMENT TECHNOLOGY GRADE 11 QUARTER 2 REVIEWER
EMPOWERMENT TECHNOLOGY GRADE 11 QUARTER 2 REVIEWER
 
Apidays New York 2024 - The value of a flexible API Management solution for O...
Apidays New York 2024 - The value of a flexible API Management solution for O...Apidays New York 2024 - The value of a flexible API Management solution for O...
Apidays New York 2024 - The value of a flexible API Management solution for O...
 
How to Troubleshoot Apps for the Modern Connected Worker
How to Troubleshoot Apps for the Modern Connected WorkerHow to Troubleshoot Apps for the Modern Connected Worker
How to Troubleshoot Apps for the Modern Connected Worker
 
Artificial Intelligence Chap.5 : Uncertainty
Artificial Intelligence Chap.5 : UncertaintyArtificial Intelligence Chap.5 : Uncertainty
Artificial Intelligence Chap.5 : Uncertainty
 
DBX First Quarter 2024 Investor Presentation
DBX First Quarter 2024 Investor PresentationDBX First Quarter 2024 Investor Presentation
DBX First Quarter 2024 Investor Presentation
 
MS Copilot expands with MS Graph connectors
MS Copilot expands with MS Graph connectorsMS Copilot expands with MS Graph connectors
MS Copilot expands with MS Graph connectors
 
Apidays New York 2024 - Accelerating FinTech Innovation by Vasa Krishnan, Fin...
Apidays New York 2024 - Accelerating FinTech Innovation by Vasa Krishnan, Fin...Apidays New York 2024 - Accelerating FinTech Innovation by Vasa Krishnan, Fin...
Apidays New York 2024 - Accelerating FinTech Innovation by Vasa Krishnan, Fin...
 
DEV meet-up UiPath Document Understanding May 7 2024 Amsterdam
DEV meet-up UiPath Document Understanding May 7 2024 AmsterdamDEV meet-up UiPath Document Understanding May 7 2024 Amsterdam
DEV meet-up UiPath Document Understanding May 7 2024 Amsterdam
 
Apidays New York 2024 - The Good, the Bad and the Governed by David O'Neill, ...
Apidays New York 2024 - The Good, the Bad and the Governed by David O'Neill, ...Apidays New York 2024 - The Good, the Bad and the Governed by David O'Neill, ...
Apidays New York 2024 - The Good, the Bad and the Governed by David O'Neill, ...
 
Architecting Cloud Native Applications
Architecting Cloud Native ApplicationsArchitecting Cloud Native Applications
Architecting Cloud Native Applications
 
Finding Java's Hidden Performance Traps @ DevoxxUK 2024
Finding Java's Hidden Performance Traps @ DevoxxUK 2024Finding Java's Hidden Performance Traps @ DevoxxUK 2024
Finding Java's Hidden Performance Traps @ DevoxxUK 2024
 
TrustArc Webinar - Unlock the Power of AI-Driven Data Discovery
TrustArc Webinar - Unlock the Power of AI-Driven Data DiscoveryTrustArc Webinar - Unlock the Power of AI-Driven Data Discovery
TrustArc Webinar - Unlock the Power of AI-Driven Data Discovery
 
Cloud Frontiers: A Deep Dive into Serverless Spatial Data and FME
Cloud Frontiers:  A Deep Dive into Serverless Spatial Data and FMECloud Frontiers:  A Deep Dive into Serverless Spatial Data and FME
Cloud Frontiers: A Deep Dive into Serverless Spatial Data and FME
 

ZoomCharts Net Chart - Interactive Node Filtering for Mac

  • 1. Product Name: Net Chart USER MANUAL / GUIDE INTERACTIVE NODE FILTERING Mac http://www.zoomcharts.com/ The world’s most interactive data visualization software
  • 2. Product Name: Net Chart INTERACTIVE NODE FILTERING ZoomCharts’ advanced data visualization software makes viewing and analyzing your data easier than ever before. The Node Filtering tool features an easy to use slider that lets you view exactly the data you need while temporarily hiding others based on the filtering options of your choice. ZoomCharts’ Interactive Node Filtering feature is currently being used to enhance data visualization in a number of educational fields, including sciences and mathematics, such as anatomy, biochemistry, ecology, microbiology, nutrition, neuroscience, physiology, zoology, chemical engineering, geochemistry, molecular biology, geology, paleontology, physics, astronomy, algebra, computer science, geometry, logic, and statistics, and the arts such as, music, dance, theatre, film, animation, architecture, applied arts, photography, graphic design, interior design, and mixed media. - Customize your graph to view exactly what you want - Filter and view data easily using a slider - Change node display with simple drag and drop
  • 3. Step 1: Use the slider to filter the data you want displayed. https://zoomcharts.com/en/gallery/all:node-filter
  • 4. Step 2: Drag and drop nodes to rearrange the graph. https://zoomcharts.com/en/gallery/all:node-filter
  • 5. Step 3: Zoom in and out of the graph by swiping up or down with your mouse scroll pad. https://zoomcharts.com/en/gallery/all:node-filter
  • 6. Step 4: Move the slider points back to the ends to display full data set. https://zoomcharts.com/en/gallery/all:node-filter
  • 7. Network Chart Big network exploration Explore linked data sets. Highlight relevant data with dynamic filters and visual styles. Incremental data loading. Exploration with focus nodes. Time Chart Time navigation and exploration tool Browse activity logs, select time ranges. Multiple data series and value axes. Switch between time units. Pie Chart Amazingly intuitive hierarchical data exploration Get quick overview of your data and drill down when necessary. All in a single easy to use chart. Facet Chart Scrollable bar chart with drill-down Compare values side by side and provide easy access to the long tail. ZoomCharts http://www.zoomcharts.com/ The world’s most interactive data visualization software Check out ZoomCharts products: