
Recommended
More Related Content
What's hot
What's hot (20)
Viewers also liked
Viewers also liked (20)
Similar to Cleaning Pakistan’s Air: Policy Options to Address the Cost of Outdoor Air Pollution
Similar to Cleaning Pakistan’s Air: Policy Options to Address the Cost of Outdoor Air Pollution (20)
More from zubeditufail
More from zubeditufail (20)
Recently uploaded
Recently uploaded (20)
Cleaning Pakistan’s Air: Policy Options to Address the Cost of Outdoor Air Pollution
- 1. Cleaning Pakistan’s Air Policy Options to Address the Cost of Outdoor Air Pollution Ernesto Sánchez-Triana, Santiago Enriquez, Javaid Afzal, Akiko Nakagawa, and Asif Shuja Khan D I R E C T I O N S I N D E V E LO P M E N T Energy and Mining PublicDisclosureAuthorizedPublicDisclosureAuthorizedPublicDisclosureAuthorizedPublicDisclosureAuthorized 89065
- 5. D i r e c t i o n s i n D e v e lo p m e n t Energy and Mining Cleaning Pakistan’s Air Policy Options to Address the Cost of Outdoor Air Pollution Ernesto Sánchez-Triana, Santiago Enriquez, Javaid Afzal, Akiko Nakagawa, and Asif Shuja Khan
- 6. Cleaning Pakistan’s Air • http://dx.doi.org/10.1596/978-1-4648-0235-5 © 2014 International Bank for Reconstruction and Development / The World Bank 1818 H Street NW, Washington DC 20433 Telephone: 202-473-1000; Internet: www.worldbank.org Some rights reserved 1 2 3 4 17 16 15 14 This work is a product of the staff of The World Bank with external contributions. The findings, interpreta- tions, and conclusions expressed in this work do not necessarily reflect the views of The World Bank, its Board of Executive Directors, or the governments they represent. The World Bank does not guarantee the accuracy of the data included in this work. The boundaries, colors, denominations, and other information shown on any map in this work do not imply any judgment on the part of The World Bank concerning the legal status of any territory or the endorsement or acceptance of such boundaries. Nothing herein shall constitute or be considered to be a limitation upon or waiver of the privileges and immunities of The World Bank, all of which are specifically reserved. Rights and Permissions This work is available under the Creative Commons Attribution 3.0 IGO license (CC BY 3.0 IGO) http:// creativecommons.org/licenses/by/3.0/igo. Under the Creative Commons Attribution license, you are free to copy, distribute, transmit, and adapt this work, including for commercial purposes, under the following conditions: Attribution—Please cite the work as follows: Sánchez-Triana, Ernesto, Santiago Enriquez, Javaid Afzal, Akiko Nakagawa, and Asif Shuja Khan. 2014. Cleaning Pakistan’s Air: Policy Options to Address the Cost of Outdoor Air Pollution. Washington, DC: World Bank. doi:10.1596/978-1-4648-0235-5. License: Creative Commons Attribution CC BY 3.0 IGO. Translations—If you create a translation of this work, please add the following disclaimer along with the attribution: This translation was not created by The World Bank and should not be considered an official World Bank translation. The World Bank shall not be liable for any content or error in this translation. Third-party content—The World Bank does not necessarily own each component of the content contained within the work. The World Bank therefore does not warrant that the use of any third-party-owned individual component or part contained in the work will not infringe on the rights of those third parties. The risk of claims resulting from such infringement rests solely with you. If you wish to re-use a component of the work, it is your responsibility to determine whether permission is needed for that re-use and to obtain permission from the copyright owner. Examples of components can include, but are not limited to, tables, figures, or images. All queries on rights and licenses should be addressed to the Publishing and Knowledge Division, The World Bank, 1818 H Street NW, Washington, DC 20433, USA; fax: 202-522-2625; e-mail: pubrights@ worldbank.org. ISBN (paper): 978-1-4648-0235-5 ISBN (electronic): 978-1-4648-0236-2 DOI: 10.1596/978-1-4648-0235-5 Cover photo: © Giacomo Pirozzi / Panos Pictures. Used with the permission of Giacomo Pirozzi / Panos Pictures. Further permission required for reuse. Library of Congress Cataloging-in-Publication data has been requested.
- 7. Cleaning Pakistan’s Air • http://dx.doi.org/10.1596/978-1-4648-0235-5 In memory of Gajanand Pathmanathan
- 9. Cleaning Pakistan’s Air • http://dx.doi.org/10.1596/978-1-4648-0235-5 vii Foreword xv Acknowledgments xvii About the Authors xix Abbreviations xxi Executive Summary 1 Policy Options to Address the Cost of Outdoor Air Pollution in Pakistan 1 Introduction 1 Data Availability and Methodology 5 Analysis of Air Quality Data 7 Health Damages Associated with Air Pollution 12 Air Quality Regulatory Framework 15 Air Quality Management and Climate Change 18 Policy Options for Abating Urban Air Pollution from Mobile Sources 20 Policy Options for Abating Urban Air Pollution from Stationary Sources 24 Capacity Building for Air Quality Management 29 Conclusions and Recommendations 31 Notes 34 Bibliography 36 Chapter 1 Overview 43 Introduction 43 Objective 48 Methodology 48 Analytical Value-Added 51 Structure of the Book 51 Notes 52 Bibliography 53 Contents
- 10. viii Contents Cleaning Pakistan’s Air • http://dx.doi.org/10.1596/978-1-4648-0235-5 Chapter 2 Air Pollution in Pakistan 57 Introduction 57 Analysis of Air Quality Data 59 Air Pollution and the Quality of Life in Pakistan 66 The Economic Cost of Air Pollution in Pakistan 70 Conclusions 75 Notes 76 Bibliography 78 Chapter 3 Air Quality Management Institutions 83 Introduction 83 Pakistan’s Air Quality Regulatory Framework 84 Organizational Structure for Air Quality Management 88 Coordination and Decentralization of Air Quality Management Responsibilities 89 Monitoring Ambient Air Pollution 92 The Judiciary and the Enforcement of Regulations 93 Conclusions and Recommendations 94 Notes 98 References 99 Chapter 4 Mobile Sources 101 Introduction 101 Ambient Air Quality and Exposed Population in Karachi 102 Lead Exposure 108 Neuropsychological Effects in Children under Five Years 112 Social Cost of Health Effects 114 Interventions to Improve Air Quality 118 Conclusions and Recommendations 128 Notes 131 References 133 Chapter 5 Industrial and Other Stationary Sources 139 Introduction 139 Inventory of Stationary Sources 141 Industrial Air Pollution 143 Control of Air Pollution from Stationary Sources 147 Control of Diffuse Sources 152 Conclusions and Recommendations 152 Notes 155 References 156
- 11. Contents ix Cleaning Pakistan’s Air • http://dx.doi.org/10.1596/978-1-4648-0235-5 Chapter 6 Potential Co-Benefits of Air Quality Management for Climate Change 159 Introduction 159 Climate Change and Air Pollution Interactions 160 Air Quality Management and Climate Change Co-Benefits in Pakistan 163 Policy Options 164 Conclusions and Recommendations 166 Note 167 References 167 Chapter 7 Conclusions and Recommendations 171 Conclusions 171 References 179 Figures 1 Motor Vehicles on Road (in thousands) in Pakistan, 1991–2012 3 2 Temporal Trend for PM2.5 , SO2 , NO2 , O3 , and CO for Five Pakistan Cities: Islamabad (ISL), Quetta (QUE), Lahore (LAH), Karachi (KAR), and Peshawar (PES) 9 3 Correlations between PM2.5 , SO2 , NO2 , O3 , and CO for Islamabad, Quetta, Karachi, Peshawar, and Lahore 12 4 Estimate of Annual Average PM2.5 Ambient Air Concentrations, Karachi, 2006–09 14 5 GHG Emissions in South Asia 19 6 Benefit-Cost Ratios of Low-Sulfur Fuels in Karachi 21 7 Benefit-Cost Ratios of Retrofitting In-Use Diesel Vehicles with DOC 22 1.1 Motor Vehicles on the Road (in thousands) in Pakistan, 1991–2012 45 2.1 PM10 Concentrations at the Country Level (µg/m3), 2008 58 2.2 Wind Roses for PM2.5 , SO2 , NO2 , O3 , and CO for Four Different Cities: Peshawar (PES), Lahore (LAH), Karachi (KAR), and Islamabad (ISL) 60 2.3 Temporal Trend for PM2.5 , SO2 , NO2 , O3 , and CO for Five Pakistan Cities: Peshawar (PES), Lahore (LAH), Karachi (KAR), Islamabad (ISL), and Quetta (QUE) 62 2.4 Correlations between PM2.5 , SO2 , NO2 , O3 , and CO for Islamabad (ISL), Quetta (QUE), Karachi (KAR), Peshawar (PES), and Lahore (LAH) 65 2.5 Income and Urban Pollution Levels across Countries, 2007 67
- 12. x Contents Cleaning Pakistan’s Air • http://dx.doi.org/10.1596/978-1-4648-0235-5 2.6 Quality of Living and Eco-Cities Indexes in Selected Cities, 2010 68 2.7 Government Effectiveness and Air Quality (PM10), 2008 69 2.8 Measured Concentration Levels of PM10 in Selected Cities in Pakistan; Data from Studies Undertaken between 1999 and 2006 70 2.9 Sources of Particulate Matter Emissions from Fossil Fuels Combustion in Pakistan, 2008 71 2.10 Estimate of Annual Average PM2.5 Ambient Air Concentrations in Karachi, 2006–09 (μg/m3 ) 73 2.11 Suspected Blood Lead Levels (BLL) in Children under Five Years in Sindh 74 2.12 Loss of IQ Points in Early Childhood in Relation to Lower Threshold Levels (X0 ) of Blood Lead Levels (BLL) 75 4.1 PM Ambient Concentrations in Karachi, SUPARCO, 2007–08 103 4.2 PM2.5 Ambient Air Concentrations in Karachi, Sindh-EPA, 2008–09 103 4.3 Monthly Average Wind Speed and Rainfall in Karachi 106 4.4 Estimated Blood Lead Level (BLL) in Children 2–5 Years Old, in Relation to Pb in Drinking Water 111 4.5 Loss of IQ Points in Early Childhood in Relation to Lower Threshold Levels (X0 ) of Blood Lead Levels (BLL) 114 4.6 Benefit-Cost Ratios of 500-ppm Sulfur Diesel (Left) and 50-ppm Sulfur Diesel (Right) in Karachi 123 4.7 European Union Diesel Vehicle Emission Standards for PM 124 4.8 European Union Heavy-Duty Diesel Engines Emission Standards for PM 124 4.9 Benefit-Cost Ratios of Retrofitting In-Use Diesel Vehicles with DOC 125 4.10 Benefit-Cost Ratios of Converting In-Use Diesel-Fueled Minibuses and Vans to CNG 127 4.11 Benefit-Cost Ratios of Low-Sulfur Fuels in Karachi 129 4.12 Benefit-Cost Ratios of Retrofitting In-Use Diesel Vehicles with DOC in Karachi 129 4.13 Benefit-Cost Ratios of Conversion of Diesel Vehicles, Rickshaws, and Motorcycles in Karachi 129 5.1 Economic Structure of Pakistan and other Developing Countries 140 5.2 Industrial Units of Pakistan by Sector and Region, 2005 143 5.3 Energy Consumption by Sector, 2005–12 146 6.1 GHG Emissions in South Asia 160 6.2 Sources of GHG Emissions in Pakistan, 2005 161 6.3 Sources of CO2 from Fossil Fuels Combustion in Selected Asian Countries, 2007 162
- 13. Contents xi Cleaning Pakistan’s Air • http://dx.doi.org/10.1596/978-1-4648-0235-5 Map 4.1 Towns and Cantonments of Karachi 104 Tables 1 Data Coverage (%) for Air Quality Parameters for Five Cities in Pakistan 6 2 Principal Component Analysis: Results for Islamabad, Lahore, Karachi, and Peshawar 13 3 Concentration Levels (Daily Average) of Suspended PM2.5 in Pakistan 13 4 Estimated Health Benefits of Retrofitting Diesel Vehicles with PM Control Technology 22 5 Estimated Health Benefits of Conversion to CNG 23 6 Fuel and Air Pollution Emissions 25 7 Recommended Short-Term Actions to Strengthen AQM in Pakistan 33 1.1 Data Coverage (Percentage) for Air Quality Parameters for Five Cities in Pakistan 49 2.1 Premature Deaths Associated with PM and O3 per Million Inhabitants 59 2.2 Average Meteorological Values at Four Selected Cities: Peshawar (PES), Lahore (LAH), Karachi (KAR), and Islamabad (ISL) 59 2.3 Average Values of PM2.5 , SO2 , NO2 , O3 , and CO for Five Different Cities: Peshawar (PES), Lahore (LAH), Karachi (KAR), Islamabad (ISL), and Quetta (QUE) 61 2.4 Maximum Values of PM2.5 , SO2 , NO2 , O3 , and CO for Five Different Cities: Peshawar (PES), Lahore (LAH), Karachi (KAR), Islamabad (ISL), and Quetta (QUE) 61 2.5 Principal Component Analysis: Results for Islamabad, Lahore, Karachi, and Peshawar 66 2.6 Concentration Levels (Daily Average) of Suspended PM2.5 in Pakistan 69 3.1 Development of Pakistan’s Norms on Air Pollution, 1983–2009 85 3.2 Comparison of Pakistan’s National Air Quality Standards with WHO, EU, and U.S. Air Quality Guidelines 86 3.3 PCAP’s Proposed Activities to Address Air Pollution in Pakistan 87 3.4 Government Interventions to Strengthen Institutional EPA Efforts 98 4.1 Estimate of Annual Average PM2.5 Ambient Air Concentrations in Karachi, 2006–09 104 4.2 Population of Karachi by Town and Area, 2005 105 4.3 Populations and Estimates of Annual Average PM Concentrations in Cities in Sindh 106
- 14. xii Contents Cleaning Pakistan’s Air • http://dx.doi.org/10.1596/978-1-4648-0235-5 4.4 Estimated Annual Mortality from PM Ambient Concentrations in Cities in Sindh, 2009 107 4.5 Years of Life Lost (YLL) Due to Mortality from PM Ambient Concentrations in Cities in Sindh, 2009 107 4.6 Estimated Annual Cases of Morbidity from PM Ambient Concentrations in Cities in Sindh, 2009 107 4.7 Years Lost to Disease (YLD) from PM Outdoor Air Pollution Exposure, 2009 108 4.8 Blood Lead Levels (BLL) in Children in Pakistan 109 4.9 Blood Lead Levels (BLL) in Children in China, India, and the Philippines 110 4.10 Estimated Distribution of Children by BLL in Sindh Province 110 4.11 Lead Concentrations in Drinking Water in Karachi, 2007–08 111 4.12 Lead Concentrations in Groundwater in Sindh Other than Karachi 111 4.13 Recent Studies Assessing the Effect of Blood Lead Level (BLL) <10 µg/dL on Children’s IQ Score 112 4.14 Effect of Blood Lead Level (BLL) <10 µg/dL on Children’s IQ Score 113 4.15 Estimated Annual Losses of IQ Points among Children Younger than 5 Years in Sindh, 2009 114 4.16 Economic Cost of a Premature Death Applied to Sindh 115 4.17 Estimated Annual Cost of Health Effects of Outdoor PM Air Pollution in Sindh, 2009 115 4.18 Cost of Mortality and Morbidity from Outdoor PM Air Pollution in Sindh, 2009 116 4.19 Estimated Annual Cost of Illness (PRs/case), 2009 116 4.20 Estimated Annual Cost of IQ Losses among Children Younger than 5 Years in Sindh, 2009 117 4.21 Estimated PM Emissions in Karachi (thousand tons per year), 2009 119 4.22 Estimated Source Contribution to Ambient PM Concentrations in Karachi, 2009 119 4.23 Estimated Annual PM10 Emissions in Karachi from Road Vehicles, 2009 120 4.24 Maximum Allowable Sulfur Content in Vehicle Diesel Fuel in the European Union 122 4.25 PM Emission Reductions from Lowering the Sulfur Content in Diesel 122 4.26 Use of DOC and DPF on Diesel Vehicles for PM Emission Control 126 4.27 PM Emission Reductions from Retrofitting of In-Use Diesel Vehicles 127 4.28 Estimated Health Benefits of Retrofitting Diesel Vehicles 127 4.29 Estimated Health Benefits of Conversion to CNG 127
- 15. Contents xiii Cleaning Pakistan’s Air • http://dx.doi.org/10.1596/978-1-4648-0235-5 5.1 Industrial Units of Pakistan by Sector, 2005 142 5.2 SMART Registration and Reporting by Industry Sector and Provinces, 2010 144 5.3 Air Quality in Industrial Areas of Pakistan 145 5.4 Gas Prices in Pakistan 145 5.5 Typical Emission for Textile Processing Units 146 5.6 Fuel and Air Pollution Emissions 148 6.1 Climate Change Mitigation Interventions with Local Air Pollution Co-Benefits 163 7.1 Recommended Actions to Strengthen Air Quality Management in Pakistan 177
- 17. Cleaning Pakistan’s Air • http://dx.doi.org/10.1596/978-1-4648-0235-5 xv Foreword The extent of urban air pollution in Pakistan—South Asia’s most urbanized country—is among the world’s most severe, significantly damaging human health, quality of life, and the economy and environment of Pakistan. The harm from Pakistan’s urban air pollution is among the highest in South Asia, exceeding several high-profile causes of mortality and morbidity in Pakistan. This book synthesizes a broad spectrum of research on Pakistan’s air quality management (AQM) challenges. The research analyzed here deals with the severity and scope of air pollution in Pakistan, considers the experiences of other countries with AQM programs, and identifies a comprehensive set of steps to improve Pakistan’s air quality. Improved air quality in Pakistan can have notable economic and health ben- efits. For example, the estimated health benefits to Pakistan per dollar spent on cleaner diesel are approximately US$1–1.5 for light-duty diesel vehicles and US$1.5–2.4 for large buses and trucks. This book advocates that Pakistan allocate increased resources to AQM, because evidence shows that its air quality is severely affecting millions of Pakistanis, and because experiences around the world indicate that well-targeted interventions can significantly improve air quality. Other countries’ successful experiences with AQM can serve as models for Pakistan’s consideration. The research presented here underpins this book’s overall conclusion that addressing Pakistan’s urban air pollution requires a series of coordinated inter- ventions relating to Pakistan’s air quality problems, its current AQM programs, and potential improvements in those programs. These interventions include the following tasks: • Strengthen AQM • Build the institutional capacity of relevant agencies • Bolster AQM’s legal and regulatory framework • Implement policy reforms and investments • Fill current gaps in knowledge. The book advocates that Pakistan install and operate a reliable air quality moni- toring network, consolidate its regulatory framework for air pollution control, and utilize command and control measures that include ambient standards,
- 18. xvi Foreword Cleaning Pakistan’s Air • http://dx.doi.org/10.1596/978-1-4648-0235-5 emission standards, and technology- and performance-based standards. However, Pakistan’s policy makers face major obstacles, including limited financial, human, and technical resources, and can pursue only a few AQM interventions at the same time. Hence, priorities need to be determined, and this book includes the following recommendations: In the short term, Pakistan’s AQM should give highest priority to reducing pollutants linked to high morbidity and mortality: fine particulate matter (and precursors like sulfur oxides and nitrogen oxides) from mobile sources.A second- level short-term priority could be on fine particulate matter, sulfur oxides, and emissions of lead and other toxic metals from stationary sources. An important medium-term priority should be developing mass transportation in major cities, controlling traffic, and restricting private cars during high-pollution episodes. A long-term priority could be taxing hydrocarbons, based on their contribution to greenhouse gases. Pakistan faces daunting problems stemming from urban air pollution’s adverse effects on Pakistanis’ health, quality of life, economy, and environment. The underlying goal of this book is to facilitate and stimulate further sharing of infor- mation regarding those harms and to provide a research-based framework for bringing about improved air quality management in Pakistan. John Henry Stein Sector Director Sustainable Development Department South Asia Region World Bank
- 19. Cleaning Pakistan’s Air • http://dx.doi.org/10.1596/978-1-4648-0235-5 xvii Acknowledgments This book is a product of a core team that included Ernesto Sánchez-Triana (TTL), Javaid Afzal, Santiago Enriquez, Asif Shuja Khan, Bjorn Larsen, John Skelvick, Manuel Dall’Osto, Akiko Nakagawa, Cecilia Belita, Rahul Kanakia, Mosuf Ali, and Hammad Raza Khan. The extended team included Asif Faiz, Anil Markandya, Sameer Akbar, Luis Sánchez Torrente, Mohammad Omar Khalid, and Badar Munir Ghauri. Sada Hussain and Afzal Mahmood provided administrative support. The peer reviewers for the study were Helena Naber, Daniel Mira-Salama, John Allen Rogers, and Yewande Awe (World Bank); Jack Ruitenbeek (IUCN Switzerland); and Leonard Ortolano (Stanford University). The team also bene- fited from the comments of Luis Alberto Andres, Dan Biller, Catherine Revels, Karin Kemper, and Gajanand Pathmanathan. Several colleagues also provided helpful advice and detailed contributions,particularlyAsif Faiz, Eugenia Marinova, Anna O’Donnell, Mario Picon, and Maria Correia. The authors are also thankful for the support of the World Bank management team and the Pakistan country office, including Rachid Benmessaoud (Country Director), John Henry Stein, Karin Kemper, Gajanand Pathmanathan, Herbert Acquay, and Bernice Van Bronkhorst. The authors extend their sincere thanks and appreciation to Cecilia Belita, Marie Florence Elvie,Afzal Mahmood, and Sada Hussain for their adminis- trative support. Editorial and manuscript preparation was provided by Stan Wanat. The Government of Pakistan, mainly through the Pakistan Environmental Protection Agency and the Ministry of Climate Change, provided key feedback during the preparation of the study and participated actively in the production of diverse parts of the book. The team received significant contributions and feedback from participants in a workshop held during May 2010 in Islamabad. Participants included Mr. Kamran Ali Qureshi, Additional Secretary, MoE; Mr. Asif Shuja Khan, DG, Pak-EPA; Dr. Aurangzeb Khan, Chief (Environment), Planning Commission; Mr. Asadullah Faiz, Director, Pak-EPA; Mr. Muhammad Bashir Khan, Director, AJK EPA; Dr. Hussain Ahmad, Director, KP EPA; Mr. S. M. Yahya, Director, Sindh EPA; Dr. Muhammad Saleem, Director, Balochistan EPA; Mr. Nasir Ali Khan, Project Director, Pak-EPA; Mr. Rafiullah Khan, Deputy Director, Pak-EPA; Mr. Khadim Hussain, Assistant Director, GB EPA; Mr. Muhammad Farooq Alam, Research Officer (Air Pollution), Punjab EPD; Mr. Naseem Afzal Baz, Director (Environment), NHA;
- 20. xviii Acknowledgments Cleaning Pakistan’s Air • http://dx.doi.org/10.1596/978-1-4648-0235-5 Mr.AsifJamilAkhter,AssistantDirector,NHA;Ms.ShahziaShahid,Environment Specialist, NHA; Mr. Kaleem Anwar Mir, Scientific Officer, GCISC; Dr. Mahmood Khawaja, Senior Advisor (Chemicals), SDPI; Mr. M. Ilyas Suri, Director, Indus Motors; Mr. Saad Murad Khan, Deputy Manager, Indus Motors; Ch.UsmanAli,Consultant,Metro Consulting;and Mr.Muhammad Qadiruddin, General Manager, Global Environmental Laboratories. The team is particularly grateful to the governments of Australia, Finland, the Netherlands, and Norway for their support through several trust funds— particularly the TFSSD, the BNPP, and the Country Environmental Analysis Trust Fund—that financed the studies underpinning this book.
- 21. Cleaning Pakistan’s Air • http://dx.doi.org/10.1596/978-1-4648-0235-5 xix About the Authors Ernesto Sánchez-Triana is Lead Environmental Specialist for the World Bank’s Latin America and Caribbean Region. Prior to joining the Bank, he was a pro fessor at the National University of Colombia and served as Director of Environmental Policy at Colombia’s National Department of Planning. From 2006 to 2012, he worked for the Bank’s South Asia Region, leading numerous operations including analytical work on “Policy Options for Air Quality Management in Pakistan”—the basis for this book. Dr. Sánchez-Triana holds MS and PhD degrees from Stanford University and has authored numerous publications on environmental economics, energy efficiency, environmental policy, poverty and social impact assessment, and green growth. Santiago Enriquez is an international consultant with more than 15 years of experience in the design, implementation, and evaluation of policies relating to the environment, conservation, and climate change. He has developed analytical work for the World Bank, United States Agency for International Development, and the Inter-American Development Bank. From 1998 to 2002, Mr. Enriquez worked at the International Affairs Unit of Mexico’s Ministry of Environment and Natural Resources. Mr. Enriquez holds a master’s degree in public policy from the Harvard Kennedy School. Javaid Afzal is a Senior Environment Specialist at the World Bank’s Islamabad office. His responsibilities include moving the environment development agenda forward with client government agencies. He also task manages operations in water resources and the environment, and provides environmental safeguards support for the Bank’s South Asia Region. Previously, he worked at a leading consulting company in Pakistan. Dr. Afzal holds a PhD in water resources man- agement from Cranfield University, U.K., and master’s and bachelor’s degrees in agricultural engineering from the University of Agriculture, Faisalabad, Pakistan. Dr. Afzal has published in a number of peer-reviewed journals on the topics mentioned above. Akiko Nakagawa is a Senior Environmental Specialist in the World Bank’s South Asia Region Disaster Risk Management and Climate Change Unit at the Bank’s headquarters, where she works on climate change mitigation and adaptation
- 22. xx About the Authors Cleaning Pakistan’s Air • http://dx.doi.org/10.1596/978-1-4648-0235-5 in the region. Before joining the Bank, she served in the Japanese government’s Ministry of Environment as a climate change negotiator. Prior to joining the government, she worked at JBIC/OECF and managed a lending portfolio com- prising projects such as watershed management, energy efficiency, afforestation, flood-resilient community development, and river embankment. She has a mas- ter’s degree in urban planning (urban environment) from New York University. Asif Shuja Khan is former Director General, Pakistan Environmental Protection Agency (Climate Change Division). He was the Director General of the Pakistan Environmental Protection Agency (Pak-EPA) since its inception in 1993 and until February 2014. He has more than 30 years of professional experience in environmental management and has worked with international agencies like the World Bank, Asian Development Bank, Japanese International Cooperation Agency, United Nations Environmental Programme, United Nations Development Programme, and United Nations International Children’s Emergency Fund. Under his leadership, Pak-EPA established Air Quality Monitoring systems in Pakistan’s major cities and adopted national ambient air quality standards and Euro emission standards for vehicles. Mr. Shuja holds a master’s degree from the Stevens Institute of Technology, New Jersey, U.S.
- 23. Cleaning Pakistan’s Air • http://dx.doi.org/10.1596/978-1-4648-0235-5 xxi ALRI acute lower respiratory infections AOD aerosol optical depth AQM air quality management BCR benefit-cost ratio BLL blood lead level CB chronic bronchitis CBA cost-benefit analysis CCD Climate Change Division CNG compressed natural gas CO carbon monoxide CO2 carbon dioxide COI cost of illness DALY disability-adjusted life year DOC diesel oxidation catalysts DPF diesel particulate filters EPAs Environmental Protection Agencies EPI environmental performance index ERV emergency room visit ET environmental tribunal EU European Union GDI gross domestic income GDP gross domestic product GDP PPP gross domestic product purchasing power parity GHG greenhouse gases GoP Government of Pakistan HAD hospital admission HCV human capital value Abbreviations
- 24. Cleaning Pakistan’s Air • http://dx.doi.org/10.1596/978-1-4648-0235-5 xxii Abbreviations I&M inspection and maintenance IQ intelligence quotient JICA Japanese International Cooperation Agency LCV light commercial vehicle LPG liquid petroleum gas LRI lower respiratory illness MoA Ministry of Agriculture MoCC Ministry of Climate Change MoE Ministry of Environment MoEn Ministry of Energy MoF Ministry of Finance MoI Ministry of Industry and Special Initiatives MoPNR Ministry of Petroleum and Natural Resources NEP National Environmental Policy NEQS National Environmental Quality Standards NGO nongovernmental organization NO2 nitrogen dioxide NOX nitrogen oxides (nitric oxide and nitrogen dioxide) O3 ozone OAP outdoor air pollution OC organic carbon OECD Organisation for Economic Co-operation and Development Pak-EPA Pakistan Environmental Protection Agency Pb lead PCA principal component analysis PCAP Pakistan Clean Air Program PEPA Pakistan Environmental Protection Act of 1997 PEPC Pakistan Environmental Protection Council PM particulate matter PM1 particulate matter of less than 1 micron PM2.5 particulate matter of less than 2.5 microns PM10 particulate matter of less than 10 microns PMF Positive Matrix Factorization ppm parts per million PPP polluter pays principle RAD restricted activity days
- 25. Cleaning Pakistan’s Air • http://dx.doi.org/10.1596/978-1-4648-0235-5 Abbreviations xxiii RS respiratory symptoms SMART Self-Monitoring and Reporting Tool SO2 sulfur dioxide SOx sulfur oxides SPM suspended particulate matter SUPARCO Pakistan Space and Upper Atmosphere Research Commission TSP total suspended particles UNEP United Nations Environment Programme USEPA United States Environmental Protection Agency VOC volatile organic compounds VSL value of a statistical life WHO World Health Organization WTP willingness to pay YLL years of life lost
- 27. 1 Cleaning Pakistan’s Air • http://dx.doi.org/10.1596/978-1-4648-0235-5 Executive Summary Policy Options to Address the Cost of Outdoor Air Pollution in Pakistan Introduction Examining options for improving Pakistan’s air quality... This document examines options for Pakistan to address the significant costs that ever-worsening air pollution imposes upon its economy and populace. This book examines pol- icy options to control Pakistan’s outdoor air pollution, with the aim of assisting the Government of Pakistan (GoP) in designing and implementing reforms to improve Pakistan’s ambient air quality regulatory framework. The book draws upon an analysis of air quality management (AQM) in Pakistan and is informed by international and regional best practices.The document proposes a prioritized menu of cost-effective interventions to improve Pakistan’s AQM, particularly in urban areas, which face the most significant air quality problems. Among world’s worst urban air pollution... Pakistan’s urban air pollution is among the most severe in the world, and it significantly damages human health and the economy. Pakistan is the most urbanized country in South Asia, and it is undergoing rapid motorization and increasing energy use. Air pollution, particu- larly in large urban centers, damages the populations’ health and quality of life, and contributes to environmental degradation (Aziz 2006;Aziz and Bajwa 2004; Colbeck, Nasir, and Ali 2010b; Sánchez-Triana, Ahmed, and Awe 2007; World Bank 2006, 2007).1 From 2007 to 2011, the reported levels of particulate matter (PM), sulfur dioxide (SO2), and lead (Pb) were many times higher than the World Health Organization (WHO) air quality guidelines.2,3 The number of premature deaths and illnesses caused by air pollution exceeds most other high- profile causes of public health problems that receive significantly more attention in Pakistan, including road accidents.4 Worsening expectations... Current trends, including industrialization and urbanization, suggest that air quality will worsen unless targeted interventions
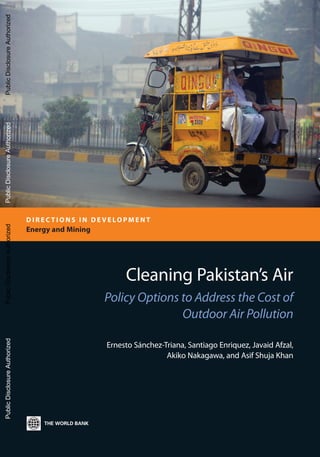
- 28. 2 Executive Summary Cleaning Pakistan’s Air • http://dx.doi.org/10.1596/978-1-4648-0235-5 are adopted in the short, medium, and long term, and unless the institutional and technical capacity of organizations responsible for AQM are strengthened. This book advocates for allocating resources to AQM, because there is evidence that air quality is severely affecting millions of Pakistanis, and because experiences from around the world indicate that well-targeted interventions and an adequate institutional framework can significantly improve air quality. More vehicles... The number of vehicles in Pakistan has jumped from approxi- mately 2 million to 10.6 million over the last 20 years, an average annual growth rate in excess of 8.5%.5 From 1991 to 2012, the number of motorcycles and scooters grew more than 450%, and motor cars, close to 650% (figure 1). The growth rate of mobile sources increased after 2003. Industrial facilities... Industrial facilities, particularly those consuming fossil fuels, emit significant amounts of air pollutants. Emissions from large-scale facili- ties, such as cement, fertilizer, sugar, steel, and power plants—many of which use furnace oil that is high in sulfur content—are a major contributor to poor air quality (Ghauri, Lodhi, and Mansha 2007; Khan 2011). A wide range of small- scale to medium-scale industries, including brick kilns, steel re-rolling, steel recycling, and plastic molding, also contribute substantially to urban air pollution through their use of “waste” fuels, including old tires, paper, wood, and textile waste. Industrial emissions are further exacerbated by the widespread use of small diesel electric generators in commercial and residential areas in response to the electricity outages. Industrial emissions are associated with poor mainte- nance of boilers and generators (Colbeck, Nasir, and Ali 2010a; Ghauri 2010; Ilyas 2007; Khan 2011).6 Waste burning, dry weather, strong winds... Different nonpoint sources con- tribute to air pollution in Pakistan, including burning of solid wastes and sug- arcane fields. More than 54,000 tons of solid waste are generated daily, most of which is either dumped in low-lying areas or burned. The burning of solid waste at low temperatures produces carbon monoxide (CO), PM, and volatile organic compounds (VOCs), including toxic and carcinogenic pollutants (Faiz 2011). Farmers in Pakistan burn cane fields to ease harvesting. During sugar- cane harvesting, high concentrations of particulate matter of less than 10 microns (PM10 ) are found in rural areas in Punjab and Sindh. Predominantly dry weather in arid conditions and strong winds also generate substantial dust in most parts of Sindh province and southern Punjab, elevating PM10 levels in the air. Due to high summer temperatures (40–50°C), fine dust is transported into the atmosphere with the rising hot air and forms “dust clouds” and haze over many cities of southern Punjab and upper Sindh. Dust storms are also generated from deserts (Thal, Cholistan, and Thar), particularly during the summer, and adversely affect air quality in the cities of Punjab and Sindh (Hussain, Mir, and Afzal 2005).
- 29. 3 Figure 1 MotorVehicles on Road (in thousands) in Pakistan, 1991–2012 Source: Ministry of Finance of Pakistan 2012. Note: Data for 2011–12 are provisional, as indicated by the“p”. 0 2,000 4,000 6,000 8,000 10,000 12,000 1991/92 1992/93 1993/94 1994/95 1995/96 1996/97 1997/98 1998/99 1999/2000 2000/01 2001/02 2002/03 2003/04 2004/05 2005/06 2006/07 2007/08 2008/09 2009/10 2010/11 2011/12p Numberofvehicles Others Trucks Tractors Motor cars Motorcycles/scooters
- 30. 4 Executive Summary Cleaning Pakistan’s Air • http://dx.doi.org/10.1596/978-1-4648-0235-5 Particulate matter... Source apportionment analyses completed in Pakistan (particularly for Lahore) from 2006 to 2012 have found high concentrations of primary and secondary pollutants, particularly, fine PM. In Lahore, Stone and others (2010) reported the chemical characterization and source appor- tionment of fine and coarse PM.7 The annual average concentration (±one standard deviation) of particulate matter of less than 2.5 microns (PM2.5 ) was 194 ± 94 micrograms per cubic meter (µg/m3). Crustal sources like dust dominated coarse aerosol, whereas carbonaceous aerosol dominated fine par- ticles. While motor vehicle contributions were relatively consistent over the course of the yearlong study, biomass and coal sources demonstrated seasonal variability and peaked in the wintertime. Secondary organic aerosols’ contri- butions also peaked in the wintertime, potentially enhanced by fog. Industrial and mobile sources, soil, burning... In Lahore, dust sources were found to contribute on average 41% of PM10 mass and 14% of PM2.5 mass on a monthly basis (von Schneidemesser and others 2010). Seasonally, concentrations were found to be lowest during the monsoon season (July–September). Principal component analysis (PCA) identified seven factors: three industrial sources, resuspended soil, mobile sources, and two regional secondary aerosol sources likely from coal and/or biomass burning. PM measured in Lahore was more than an order of magnitude greater than that measured in aerosols from the Long Beach/Los Angeles region and approximately four-fold greater than the activity of the Denver area PM (Shafer and others 2010). Particulate pollution is 2 to 14 times USEPA levels... Elevated levels of PM2.5 at Lahore ranged from 2 to 14 times higher than the prescribed United States Environmental Protection Agency (USEPA) limits (Lodhi and others 2009). Source apportionment was performed on short duration analysis results of November 2005 to March 2006, using a Positive Matrix Factorization (PMF) model.The results from the PMF model indicated that the major contributors to PM2.5 in Lahore are soil/road dust, industrial emissions, vehicular emissions, and secondary aerosols (Lodhi and others 2009; Quraishi, Schauer, and Zhang 2009). Transboundary air pollutants also affect the city, particularly due to secondary aerosols during winter. The sulfate particles also facilitate haze/fog formation during calm and highly humid conditions, and thus reduce visibility and increase the incidence of respiratory diseases encountered in the city annually. Earlier studies (Hameed and others 2000) also reported similar events causing marked reductions in visibility, disrupted transportation, and increased injury and death. Lahore pollution sources... Also in Lahore, from November 2005 to January 2006, several sources contributed to PM2.5 concentrations, including diesel emissions (28%), biomass burning (15%), coal combustion (13%), secondary PM (30%), exhaust from two-stroke vehicles (8%), and industrial sources (6%) (Raja and others 2010). Diesel and two-stroke vehicle emissions accounted for much (36%) of the measured high PM2.5. Although a large component of the
- 31. Executive Summary 5 Cleaning Pakistan’s Air • http://dx.doi.org/10.1596/978-1-4648-0235-5 carbonaceous aerosols in Lahore originated from fossil fuel combustion, a signifi- cant fraction was derived from biomass burning (Husain and others 2007). Finally, Zhang, Quraishi, and Schauer (2008), by using a molecular marker based Chemical Mass Balance (CMB) receptor model, showed that traffic pollution, including exhaust from gasoline- or diesel-powered vehicles, was the predomi- nant source of PM10 carbonaceous aerosols. Gasoline-powered vehicles plus diesel exhausts contribute 47.5%, 88.3%, and 15.4% of measured inhalable par- ticulate organic carbon, elemental carbon, and mass, respectively. Karachi pollution sources... In Karachi, Mansha and others (2011) reported a characterization and source apportionment of ambient air particulate matter (PM2.5 ). Source apportionment was performed on PM samples using a PMF model, indicating five major contributors: industrial emissions (53%), soil/road dust (16%), and others, including vehicular emissions (18%), sea salt originating from the Arabian Sea, and secondary aerosols. Islamabad pollution sources... In Islamabad, the mean metal concentrations in the atmosphere are far higher than background and European urban sites, mainly due to anthropogenic activities (Shah and Shaheen 2009). Industrial metals like iron, zinc, manganese, and potassium showed viable correlations, while Pb is correlated with cadmium because of their common source. Principal component and cluster analyses revealed automobile emissions, industrial activities, combus- tion processes, and mineral dust as the major pollution sources of the atmo- spheric particles (Shah and Shaheen 2007b; Shah, Shaheen, and Nazir 2012). The comparison study presents high concentrations of airborne trace metal. The basic statistical data revealed quite divergent variations of the elements during the specific seasons (Shah and Shaheen 2010). Automobile emissions, wind- blown soil dust, excavation activities, biomass burning, and industrial and fugitive emissions were identified as major pollution sources in Islamabad’s atmospheric aerosols. The comparative data showed that the concentrations of airborne trace elements in this area are mostly very high compared with other regions, thus posing a potential health hazard to the local population. Data Availability and Methodology Methodology for Air Quality Data Analysis Network for air quality management (AQM)... The provincial Environmental Protection Agencies (EPAs) and the Pakistan EPA (Pak-EPA) are in charge of monitoring air pollution in Pakistan. From 2006 to 2009, the Japanese International Cooperation Agency (JICA) assisted the GoP in designing and installing an air quality monitoring network of measurement stations that included (a) fixed and mobile air monitoring stations in five major cities of Pakistan (Islamabad, Karachi, Lahore, Peshawar, and Quetta); (b) a data center; and (c) a central laboratory. The provincial EPAs managed and operated the monitoring units in the provinces. Consultants hired, trained, and paid by the
- 32. 6 Executive Summary Cleaning Pakistan’s Air • http://dx.doi.org/10.1596/978-1-4648-0235-5 Japanese partners initially carried out the actual operation, and after the first year of operation, the EPAs were expected to assume all costs related to the monitoring work. Inadequate operation and maintenance... Administrative and budget problems have led to inadequate operation and maintenance of the air quality monitor- ing network. Automated instruments were used in Lahore, Karachi, Quetta, Peshawar, and Islamabad, while manual, or manual and automated combinations, were used in other areas. The number and location of the monitors were criti- cized because they excluded “hot spots” where air quality was believed to be particularly poor. Various technical problems were reported related to the inter- rupted power supply and difficulties in maintaining the automated electronic instruments. AQM network operations suspended... As of mid 2014, the EPAs had not assumed the operation and maintenance costs of the air quality monitoring net- work; consequently, the network suspended its operations. Furthermore, the data that were collected were neither analyzed nor disclosed, and the concentration of PM2.5 was being monitored infrequently. As emphasized in this book, despite the installation of this air quality monitoring system, the reliability of air quality data are suboptimal in Pakistan. Furthermore, air quality data collected before 2004 are significantly less reliable than the data collected by this air quality monitoring network. Availability of air quality data ranging from 5% to 96%... While there is a paucity of available air quality data for Pakistan, JICA’s funded air quality monitoring network collected information on concentrations of PM, carbon monoxide, sulfur and nitrogen oxides, ozone, and other parameters in Pakistan’s major cities.8 However, daily average ambient air quality data are available for less than half of the days between July 26, 2007, and April 27, 2010. Table 1 shows the temporal (percent of days) coverage for all the air quality data, and indicates that PM2.5 had the lowest coverage rate among key pollutants. Despite its flaws, these data provide the best picture of Pakistan’s air quality. Using these data, average values were calculated for all air quality pollutants. Table 1 Data Coverage (%) for Air Quality Parameters for Five Cities in Pakistan Data coverage (%) PM2.5 SO2 NO2 O3 CO Islamabad 42 31 78 87 96 Quetta 5 46 53 29 53 Karachi 10 23 29 24 24 Peshawar 17 35 66 28 60 Lahore 12 54 75 79 44 Average 17 38 60 49 55 Source: Dall’Osto 2012. Note: PM2.5 = particulate matter of less than 2.5 microns, SO2 = sulfur dioxide, NO2 = nitrogen dioxide, O3 = ozone, CO = carbon monoxide.
- 33. Executive Summary 7 Cleaning Pakistan’s Air • http://dx.doi.org/10.1596/978-1-4648-0235-5 PCA was performed using STATISTICA v4.2 software on a dataset composed of meteorological parameters, gaseous pollutants, and PM2.5 mass. This methodol- ogy combines a factor analysis that results in the identification of potential pollution sources, indicates the seasonal evolution of the sources, and quantifies the annual mean contribution of each one. Methodology for Economic Analysis Broad spectrum of primary data sources... The environmental health and economic analysis presented in this book relies on primary data obtained from various ministries, agencies, and institutions in Pakistan, as well as from interna- tional development agencies. The analysis also uses several hundred reports and research studies from Pakistan and other countries. Quantification of health effects from environmental risk factors is grounded in commonly used methodologies that link health outcomes and exposure to pollution and to other health risk factors. The economic costs of these health effects are estimated using standard valuation techniques. The assessment of the benefits and costs of interventions to mitigate health effects and improve natural resource conditions is based on these same methodologies and valuation tech- niques, as well as on international evidence of intervention effectiveness, and to the extent available, on data regarding the costs of interventions in Pakistan. Methodology for Institutional Analysis Institutional foundations, weaknesses, funding... Pakistan has institutional foundations that could support the development of priority actions targeting the country’s severe air pollution problem. However, a number of obstacles have hampered the development of adequate responses, including acute institutional weaknesses and lack of funding. The institutional analysis included in this book assessed the legal mandates of environmental organizations at the federal and provincial levels, particularly after the 18th Constitutional Amendment. Based on those mandates, the analysis evaluates the adequacy of human resources to carry out key technical, management, and support functions, as well as the avail- ability of physical capital needed to perform the assigned functions. The institu- tional analysis includes a review of the existing formal rules (for example, laws, policies, and standards), informal rules (for example, the capacity of powerful groups to reverse the adoption of pollution charges, and the pervasive tolerance of violators of environmental regulations), and their enforcement mechanisms. In addition, the analysis looks at the role that the courts have played and could play in the future when environmental organizations fail to fulfill their AQM responsibilities. Analysis of Air Quality Data Concentrations of Air Pollutants Very high concentrations of fine particulate matter... An analysis of the avail- able data from 2007 to 2010 shows very high concentrations of fine particulate
- 34. 8 Executive Summary Cleaning Pakistan’s Air • http://dx.doi.org/10.1596/978-1-4648-0235-5 matter (PM2.5)—measured in micrograms per cubic meter (μg/m3 )—in Lahore (143 μg/m3 ), Karachi (88 μg/m3 ), Peshawar (71 μg/m3 ), Islamabad (61 μg/m3 ), and Quetta (49 μg/m3 ). Most likely, the high value concentrations reported in this analysis would have been even higher if the monitoring instruments had been working all the time. Particulate matter of less than 1 micron (PM1) and PM10 measurements were not available. Low data coverage (average of 17% for the five cities) partially affected the PM2.5 measurements. Lahore had highest sulfur dioxide concentrations... The analysis of the 2007–10 time series on SO2 confirmed that Lahore was the city with the highest concentra- tions (74 ± 48 μg/m3 ), with maximum daily values of 309 μg/m3 . Other cities presented very high values of SO2 : Quetta (54 ± 26 μg/m3 ), Peshawar (39 ± 34 μg/m3 ), and Karachi (34 ± 34 μg/m3 ). Overall, SO2 values were found to be increasing over the course of the study period (2007–10). Pakistan’s nitrogen dioxide concentrations slightly above WHO guideline... The annual nitrogen dioxide (NO2 ) concentrations derived from the 48-hour data revealed that the current levels in the country are slightly higher than the WHO air quality guideline value of 40 μg/m3 , with the highest concentrations in Peshawar (52 ± 21 μg/m3 ),Islamabad (49 ± 28 μg/m3 ),Lahore (49 ± 25 μg/m3 ), and Karachi (46 ± 15 μg/m3 ). Concentrations were somewhat lower in Quetta (37 ± 15 μg/m3 ). Results from an analysis of data from 2007 to 2011 show that con- centrations of ozone (O3 ) and CO were well within the WHO guidelines. Temporal Trends and Source Apportionment of Air Pollutants Seasonal impacts on air pollutants... An analysis of temporal trends of air qual- ity pollutants for Islamabad, Karachi, Peshawar, and Lahore shows higher CO, NO2 , SO2 , and PM2.5 concentrations during winter periods, whereas O3 shows the opposite trend. Since sunlight and heat drive ozone formation, warm sunny days usually have more ozone than cool or cloudy days. All pollutants present similar wind roses. Thermal inversions, which happen across much of Pakistan from December to March, lower the mixing height and result in high pollutant concentrations, especially under stable atmospheric conditions. Suspended PM contributes to the formation of ground fog that prevails over much of the Indo-Gangetic Plains during the winter months. In addition, sunny and stable weather conditions lead to high concentrations of pollutants in the atmosphere (Sami,Waseem, and Akbar 2006). Due to high temperatures in sum- mer (40–50°C), fine dust rises with the hot air and forms “dust clouds” and haze over many cities of southern Punjab and upper Sindh. Dust storms generated from deserts (Thal, Cholistan, and Thar), particularly during the summer, adversely affect visibility in the cities of Punjab and Sindh (figure 2). Source Apportionment of Air Quality Pollutants Road traffic a main source... A statistical analysis shows that the strongest cor- relations (expressed as R2 ) among key parameters are found between PM2.5 and
- 35. Executive Summary 9 Cleaning Pakistan’s Air • http://dx.doi.org/10.1596/978-1-4648-0235-5 Figure 2 TemporalTrend for PM2.5 , SO2 , NO2 , O3 , and CO for Five Pakistan Cities: Islamabad (ISL), Quetta (QUE), Lahore (LAH), Karachi (KAR), and Peshawar (PES) a. July2007 July2008 July2009 Septem ber2007 Septem ber2008 Septem ber2009 Novem ber2007 Novem ber2008 Novem ber2009 January2008 January2009 January2010 M arch 2008 M arch 2009 M arch 2010 M ay2008 M ay2009 M ay2010 Time 8 6 4 2 10 0 0 200 150 100 50 150 100 200 50 0 80 60 40 100 20 0 150 100 200 50 0 PM2.5SO2NO2COO3 ISL b. July2007 July2008 July2009 Septem ber2007 Septem ber2008 Septem ber2009 Novem ber2007 Novem ber2008 Novem ber2009 January2008 January2009 January2010 M arch 2008 M arch 2009 M arch 2010 M ay2008 M ay2009 M ay2010 Time 10 8 6 4 2 0 0 150 100 200 50 150 100 200 50 0 300 200 100 0 80 60 40 100 20 0 PM2.5SO2 NO2 COO3 QUE figure continues next page
- 36. 10 Executive Summary Cleaning Pakistan’s Air • http://dx.doi.org/10.1596/978-1-4648-0235-5 c. July2007 July2008 July2009 Septem ber2007 Septem ber2008 Septem ber2009 Novem ber2007 Novem ber2008 Novem ber2009 January2008 January2009 January2010 M arch 2008 M arch 2009 M arch 2010 M ay2008 M ay2009 M ay2010 Time 10 8 6 4 2 0 0 200 150 100 50 200 150 100 50 0 100 80 60 40 20 0 200 150 100 50 0 PM2.5 SO2NO2 COO3 KAR d. July2007 July2008 July2009 Septem ber2007 Septem ber2008 Septem ber2009 Novem ber2007 Novem ber2008 Novem ber2009 January2008 January2009 January2010 M arch 2008 M arch 2009 M arch 2010 M ay2008 M ay2009 M ay2010 Time 10 8 6 4 2 0 0 150 100 200 50 150 100 200 50 0 300 200 100 0 400 500 300 200 100 0 PM2.5SO2NO2COO3 LAH figure continues next page Figure 2 TemporalTrend for PM2.5, SO2, NO2, O3, and CO for Five Pakistan Cities: Islamabad (ISL), Quetta (QUE), Lahore (LAH), Karachi (KAR), and Peshawar (PES) (continued)
- 37. Executive Summary 11 Cleaning Pakistan’s Air • http://dx.doi.org/10.1596/978-1-4648-0235-5 e. July2007 July2008 July2009 Septem ber2007 Septem ber2008 Septem ber2009 Novem ber2007 Novem ber2008 Novem ber2009 January2008 January2009 January2010 M arch 2008 M arch 2009 M arch 2010 M ay2008 M ay2009 M ay2010 Time 10 8 6 4 2 0 0 150 100 200 50 150 100 200 50 0 300 200 100 0 200 150 100 50 0 PM2.5SO2 NO2 COO3 PES Source: Dall’Osto 2012. Note: PM2.5 = particulate matter of less than 2.5 microns, SO2 = sulfur dioxide, NO2 = nitrogen dioxide, O3 = ozone, CO = carbon monoxide. Figure 2 TemporalTrend for PM2.5 , SO2 , NO2 , O3 , and CO for Five Pakistan Cities: Islamabad (ISL), Quetta (QUE), Lahore (LAH), Karachi (KAR), and Peshawar (PES) (continued) CO, implying road traffic is a main source of fine PM in Pakistan (figure 3). Since PM2.5 correlates better with CO than with SO2 and NO2, it is possible that fresh direct traffic emissions are important contributions to the fine par- ticulate mass levels. Other sources—including industries and natural dust or sea salt—may also contribute, but our analysis suggests that direct traffic emissions are more related to high concentrations of ambient aerosols. The low correla- tions obtained at Lahore may be due to the very high levels of PM (which may be associated with natural factors, such as dust and emissions from industrial and agricultural sources). Human-caused and weather-caused... When considering factor analysis, the “primary” factor includes traffic (NO2 , CO) and industrial (SO2 ) gases, as well as PM2.5 . The “primary” factor is mainly associated with primary anthropogenic emissions, and it represents the major component for the cities of Islamabad, Karachi, and Peshawar (33–43%). The “secondary” factor is seen mainly during summer and is associated with ozone and high temperatures. It was the second main factor found (22–33%), and it is associated more with summer regional pollution events (table 2).
- 38. 12 Executive Summary Cleaning Pakistan’s Air • http://dx.doi.org/10.1596/978-1-4648-0235-5 Human sources are major, natural sources minor... The analysis found that PM2.5 is strongly correlated with CO and NO2, indicating the importance of road traffic as a source, especially in winter months. By contrast, in the summer months, with higher wind speed, the influence of resuspended surface dusts and soils, and of secondary PM, may play a bigger role. However, the strong correlation between road traffic markers (such as CO) and PM2.5 suggests that anthropogenic pollution is a major source of fine PM and that natural sources are minor ones. Health Damages Associated with Air Pollution Pollution significantly exceeds national and WHO standards... Limited available evidence indicates that concentrations of PM2.5 in Islamabad, Karachi, Lahore, Peshawar, Rawalpindi, and Quetta are significantly above the National Environmental Quality Standards (NEQS) that came into force in July 2010, the stricter standards slated to come into force in January 2013, and the WHO guidelines (table 3). As examples of international best practices, large Source: Dall’Osto 2012. Note: PM2.5 = particulate matter of less than 2.5 microns, SO2 = sulfur dioxide, NO2 = nitrogen dioxide, O3 = ozone, CO = carbon monoxide. 0.35 0.45 −0.37 0.7 0.5 −0.25 0.5 −0.2 0.4 −0.4 PM2.5 SO2 NO2 O3 PM2.5 SO2 NO2 O3 0000 0.6 0 0.6 0 0.6 n.a. SO2 NO2 O3 CO 0.55 0.75 −0.4 0.85 0.7 −0.45 0.7 −0.55 0.85 −0.5 0.2 0.4 0 0.45 0.55 0 0.1 0 0.7 0 Islamabad Lahore City Quetta Karachi Peshawar 0.2 0.5 0 0.6 0.4 0 0.4 0 0.8 0 R2 PM2.5 SO2 NO2 O3 PM2.5 SO2 NO2 O3 PM2.5 SO2 NO2 O3 Figure 3 Correlations between PM2.5 , SO2 , NO2 , O3 , and CO for Islamabad, Quetta, Karachi, Peshawar, and Lahore
- 39. Executive Summary 13 Cleaning Pakistan’s Air • http://dx.doi.org/10.1596/978-1-4648-0235-5 Table 2 Principal Component Analysis: Results for Islamabad, Lahore, Karachi, and Peshawar City PCA factors Primary Secondary Visibility Islamabad PM2.5 0.9 0.1 0.0 SO2 0.9 0.2 0.0 NO2 0.9 0.2 0.0 O3 0.1 0.8 0.2 CO 0.9 0.0 0.1 Variance explained (%) 33 27 10 Karachi SO2 0.9 0.1 0.3 NO2 0.9 0.2 0.2 O3 0.1 0.9 0.1 CO 0.7 0.5 0.1 Variance explained (%) 35 22 14 Peshawar PM2.5 0.7 0.1 0.3 SO2 0.9 0.3 0.2 NO2 0.9 0.3 0.1 O3 0.5 0.6 0.2 CO 0.9 0.0 0.1 Variance explained (%) 43 23 11 Lahore PM2.5 0.6 0.3 0.3 SO2 0.8 0.2 0.2 NO2 0.8 0.5 0.2 O3 0.2 0.8 0.1 CO 0.8 0.4 0.1 Variance explained (%) 22 33 11 Source: Dall’Osto 2012. Note: PCA = principal component analysis, PM2.5 = particulate matter of less than 2.5 microns, SO2 = sulfur dioxide, NO2 = nitrogen dioxide, O3 = ozone, CO = carbon monoxide. Table 3 Concentration Levels (Daily Average) of Suspended PM2.5 in Pakistan µg/m3 Authors Area Year Islamabad Lahore Karachi Peshawar Quetta Pak-EPA 2007 6 sites 2005 – – – – 104–222 Husain and others 2007 – 2005–06 – 53–476 – – – Ghauri 2010a Mobile stations 2007 43.7 – – – – Fixed stations 2007 47.2 74.6 71.7 185.5 206.4 Sources: Colbeck, Nasir, and Ali 2010a, 2010b; Ghauri 2010 from data collected at stations installed by the Japanese International Cooperation Agency. Note: — = not available. PM2.5 (particulate matter of less than 2.5 microns) World Health Organization Guidelines = 10 μg/m3 ; European Union Ambient Air Quality Standards = 25 μg/m3 ; United States Ambient Air Quality Standards = 25 μg/m3 ; Pakistan 2010 National Environmental Quality Standards = 25 μg/m3 . a. The results of Ghauri (2010) are part of a World Bank-financed study reporting data obtained through interviews and primary data collected from monitoring stations in Pakistan.
- 40. 14 Executive Summary Cleaning Pakistan’s Air • http://dx.doi.org/10.1596/978-1-4648-0235-5 metropolises, such as Mexico City, Santiago, and Bangkok, have successfully reduced their ambient concentrations of PM2.5 to a level that is even lower than the level of small Pakistani cities, such as Gujranwala (Lodhi and others 2009). Percent breakdown of pollution sources... Annual average PM2.5 ambient air concentrations in Karachi are estimated at 88 µg/m3 (figure 4). The analysis of primary data from 2006 to 2009 yielded the following estimates: • 24–28% of ambient PM2.5 concentrations in Karachi is from road vehicles • 23–24% is from area-wide sources, including natural dust, resuspended road dust due to poor street cleaning, construction dust, agricultural residue burn- ing, and salt particles from the sea • 19–20% is from industry • 12–13% is secondary particulates (sulfates and nitrates) formed in the atmosphere from sulfur dioxide and nitrogen oxides from combustion of fossil fuels • 8–14% is from burning of solid waste in the city • 4–5% is from domestic use of wood/biomass • 2.3–2.8% is from oil and natural gas consumption by power plants and the domestic/public/commercial sectors. Around two-thirds of PM emissions from road vehicles are estimated to be from diesel trucks, diesel buses and minibuses, and light-duty diesel vehicles. About one-third, however, appears to be from motorcycles and rickshaws, which almost exclusively have highly polluting two-stroke engines. A major source of PM emissions from industry corresponds to ferrous metal sources (steel mills, foundries, and scrap smelters). Figure 4 Estimate of Annual Average PM2.5 Ambient Air Concentrations, Karachi, 2006–09 Sources: Sánchez-Triana and others 2014. Based on Alam, Trautmann, and Blaschke 2011; Ghauri 2008; Mansha and others 2011; and Sindh EPA 2010. Note: PM2.5 = particulate matter of less than 2.5 microns. 0 20 40 60 80 100 120 140 160 Novem ber–February M arch–M ay June–August Septem ber–October Annualaverage
- 41. Executive Summary 15 Cleaning Pakistan’s Air • http://dx.doi.org/10.1596/978-1-4648-0235-5 These PM2.5 concentrations are estimated to cause over 9,000 premature deaths each year, representing 20% of acute lower respiratory infections (ALRI) mortality among children under five years of age, 24% of cardiopulmo- nary mortality, and 41% of lung cancer mortality among adults 30 or more years of age in these cities. About 12% of the deaths are among children under five years of age and 88% are among adults. Nearly 80% of the deaths are in Karachi.9 Annually: 22,600 deaths, 80,000 hospital admissions, 5 million childhood illnesses... By 2005, more than 22,600 deaths per year were directly or indi- rectly attributable to ambient air pollution in Pakistan, of which more than 800 are children under five years of age (World Bank 2006, 2008a). Outdoor air pollution alone caused more than 80,000 hospital admissions per year, nearly 8,000 cases of chronic bronchitis, and almost 5 million cases of lower respiratory cases among children under five. To put these numbers in perspective, the harm done by air pollution exceeds most other high-profile causes of mortality and morbidity that receive significantly more attention in Pakistan, including road accidents, which resulted in over 5,500 reported fatalities and nearly 13,000 non-fatal injuries in 2007 (WHO 2009).10 Air Quality Regulatory Framework Background of Pakistan’s AQM system... The framework for Pakistan’s AQM system dates back to 1993, when the NEQS were developed under the 1983 Environmental Protection Ordinance. Consultations with major stakeholders were initiated in April 1996. In December 1999, the Pakistan Environmental Protection Council (PEPC) approved a revised version of the NEQS, and they became effective in August 2000.The review was justified by the PEPC because some of the original parameters were more stringent than parameters for other countries in South Asia.11 Drafting of NEQS for ambient air... In 2010, Pak-EPA drafted NEQS for ambi- ent air. The NEQS for ambient air cover several major pollutants: (a) SO2 , (b) nitrogen oxide (NOx ), (c) O3 , (d) suspended particulate matter (SPM), (e) PM2.5 , (f) Pb, and (g) CO.12 As required by law, prior to submitting the stan- dards for PEPC’s review and approval, Pak-EPA published the draft NEQS on its website and requested comments from the public. PEPC approved both stan- dards in a meeting held on March 29, 2010, and the official notifications in the Gazette of Pakistan were made on November 26, 2010.13 Legislative cornerstone... The cornerstone of environmental legislation is the Pakistan Environmental Protection Act (PEPA), enacted on December 6, 1997. PEPA provides a comprehensive framework for regulating environmental protection, including air pollution. PEPA established the general conditions,
- 42. 16 Executive Summary Cleaning Pakistan’s Air • http://dx.doi.org/10.1596/978-1-4648-0235-5 prohibitions, penalties, and enforcement to prevent and control pollution, and to promote sustainable development. PEPA delineated the responsibilities of the PEPC, Pak-EPA, and provincial EPAs. Pollution charges... Pakistan pollution charges established by PEPA 1997 provide an opportunity to implement the polluter pays principle (PPP). Following PEPA’s dispositions, Pak-EPA—in consultation with industry, indus- try associations, nongovernmental organizations (NGOs), and public sector stakeholders—agreed on pollution charges for industrial sources.The Pollution Charge Rules 2001 included detailed formulas for reporting and paying pollu- tion charges, defined parameters for pollution charges, and included clauses for escalation. After giving notification of these comprehensive rules, Pak-EPA did not implement the Pollution Charge Rules 2001, due to resistance from powerful groups (Khan 2011). Pakistan Clean Air Program (PCAP)... In 2005, the Government of Pakistan elaborated the Pakistan Clean Air Program (PCAP), which contains a list of inter- ventions for improving air quality. The PCAP includes interventions bearing on (a) vehicular emissions, (b) industrial emissions, (c) burning of solid waste, and (d) natural dust. PCAP’s main objective is to reduce the health and economic impacts of air pollution by implementing a number of short-term and long-term measures that require action at all levels of government. Ministry of Environment... The Ministry of Environment (MoE) was established as a full-fledged ministry in 2002. The MoE was second in the hierarchy of environmental institutions after PEPC, and its formal mandate comprised the design and implementation of national environmental policies, plans, and pro- grams, including environmental planning, pollution control and prevention, and ecology. The 18th Constitutional Amendment, adopted in 2010, devolved all these responsibilities to the provinces. In parallel with the 18th Constitutional Amendment, the Ministry of National Disaster Management absorbed the MoE in October 2011. Since the GoP elevated the issue of climate change to cabinet level, the ministry was given an additional role to address climate change and was thus transformed into the Ministry of Climate Change (MoCC) in April 2012. However, in June 2013, the MoCC was downgraded from a ministry to a divi- sion, and more than 60% of its budget was cut. Pak-EPA... The Pak-EPA is the federal agency, dependent on the Climate Change Division (CCD), responsible for implementing the PEPA in the national terri- tory. Pak-EPA has a broad range of functions, including the administration and implementation of PEPA, and the associated rules and regulations. No specific unit responsible for AQM... Neither the organizational structure of the CCD, nor that of Pak-EPA, has a specific unit or department that is responsible for AQM. In order to address priority air pollution problems,
- 43. Executive Summary 17 Cleaning Pakistan’s Air • http://dx.doi.org/10.1596/978-1-4648-0235-5 Pak-EPA has proposed establishing units specialized in AQM at the national and provincial levels. The Pak-EPA would take over responsibilities for coordi- nating, designing, and implementing air quality policies. Technical cells, EPA at the national level, and technical cells at provincial agencies would be respon- sible for monitoring ambient air quality, and mobile, stationary, and diffuse emissions. Additionally, other technical cells would be responsible for regula- tory enforcement and compliance. These units would be responsible for the effective planning and implementation of air quality standards in the territory where the national and provincial environmental organizations are directly competent. These units would also play a key role in coordinating works of the same nature carried out by all the agencies that comprise the institutional AQM network. Provincial EPAs’ mandate... After the delegation of functions from the federal government, the mandate of the provincial EPAs has become more comprehen- sive. Provincial EPAs have authority to handle the environmental management of their respective provinces. Their mandate includes implementing rules and regulations prepared under PEPA 1997 and additional legislation, per the needs of each province; designing, implementing, and enforcing environmental standards and regulations; and developing provincial systems for the implemen- tation of pollution charges, among other responsibilities. Specific AQM units essential... In response to allocated functions, provincial EPAs are strengthening their organizational structures. Provincial EPAs need capacity development in AQM, including in designing and implementing provin- cial policies; establishing, operating, and maintaining air quality monitoring systems within their operational area; and enforcing air quality regulations. The establishment of specific units within the organization of provincial agencies that exclusively deal with air pollution control has become essential for the design, implementation, and enforcement of air quality regulations. Intergovernmental and intersectoral coordination needed... The physical boundaries of air pollution rarely coincide with those of existing administrative or political jurisdictions (districts, municipalities, and provinces). In addition, several sectoral ministries are important players in the design and implementa- tion of AQM policies. As a result, the need for intergovernmental and intersec- toral coordination emerges, nationally and internationally, vertically and horizontally. However, no formal mechanisms have existed (to June 2013) for agencies involved in environmental management to participate in a consultative process with other provincial or sectoral agencies for setting priorities, for the design and implementation of interventions, or for the monitoring and evaluation of effectiveness. Intersectoral coordination for the oversight of crosscutting issues is also nonexistent. Some attempts have been made to establish focal points within other non-environment ministries, but interactions among these focal points have not yet been institutionalized.
- 44. 18 Executive Summary Cleaning Pakistan’s Air • http://dx.doi.org/10.1596/978-1-4648-0235-5 Absence of apex agency can lead to excessive variability... Most countries in the world currently have an apex central environmental ministry or agency with a number of technical and action-oriented agencies designating and implementing public policies and enforcing regulations. However, without proper coordina- tion, decentralization eventually leads to significant differences in environmental quality across regions. In Pakistan, the 18th Constitutional Amendment has empowered provincial EPAs to take care of most of the environmental issues in the provinces, while Pak-EPA’s main responsibilities have been limited to assist- ing provincial governments in the formulation of rules and regulations under PEPA 1997. The judiciary... In Pakistan, the judiciary has played an increasingly important role in the enforcement of environmental laws. When regulatory avenues for environmental enforcement fail, the judicial system is often the only other recourse for resolving environmental conflicts. The Supreme Court of Pakistan has considered cases regarding the degradation of the environment and has con- cluded that the right to a clean environment is a fundamental right of all citizens of Pakistan. The High Courts in the provinces have also intervened and rendered decisions affecting future environmental management. As an example, the Lahore High Court appointed the Lahore Clean Air Commission to develop and submit a report on feasible and specific solutions and measures for monitoring, controlling, and improving vehicular air pollution in the city of Lahore. While Pakistan’s Supreme Court has considered several environmental degradation and protection cases, further efforts are needed to bring the Court’s involvement in AQM to fruition. Air Quality Management and Climate Change Vulnerability to climate change... Pakistan is one of the most vulnerable coun- tries to climate change, as evidenced by the 2010 floods. In addition, emissions of greenhouse gases (GHG) from Pakistan are significantly lower than those from developed countries. However, Pakistan produces more carbon dioxide (CO2 ) emissions per gross domestic product than any of its neighbor countries in the South Asia region, including the major contributor, India (World Bank 2010). Pakistan’s overall trend indicates a steady increase in emissions per unit of economic output over the last decades (figure 5). Pakistan can take advantage of opportunities to both reduce its carbon intensity and improve local air quality. Fossil fuel combustion accounts for more than 90% of total CO2 emissions, and for 40% of overall GHG emissions in Pakistan.The second main contributor to overall GHG emissions is the agricultural sector, which is responsible for most of the methane and nitrous oxide emissions. Within the emissions produced by fuel combustion, the transport sector accounts for 23% of all CO2 emissions, of which the road sector represents the largest part (97%) due to its continued dependence upon CO2 intensive fuels. Only countries with a very small indus- trial and energy installed capacity show a higher contribution from the road
- 45. Executive Summary 19 Cleaning Pakistan’s Air • http://dx.doi.org/10.1596/978-1-4648-0235-5 sector to GHG emissions. Based on the use of commercial energy, industry seems to account for a relatively small share of total GHG emissions in Pakistan. Co-benefits... Energy, transport, and agriculture are the sectors in Pakistan with significant climate change mitigation and air pollution control co-benefits. Energy-sector policies that generate environmental co-benefits include removing fuel subsidies, fuel switching, improving energy efficiency of plants, and renew- able energy uptake. Natural gas... Fuel switching from coal, fuel oil, or diesel to natural gas has the potential to bring about substantial improvements in local air quality and mitigate GHG emissions. Natural gas has the potential to produce less CO2 per kilometer of travel than most other fossil fuels. It has been estimated that natural gas vehi- cles can reduce GHG emissions by as much as 20–25% over gasoline vehicles (IANGV 2003, 5). The growth in the use of compressed natural gas (CNG) in Pakistan has also provided economic benefits through employment generation. Tailoring transport policies... Transport policies can be tailored in Pakistan to produce co-benefits in the form of reductions in local air pollutants, with the associated health benefits and reductions in congestion, noise, and accidents. In Pakistan, transport policies with significant co-benefits include fostering the use of railways or modernizing the trucking sector. Other climate policies in the transportation sector include improving the efficiency of motorized vehicles; promoting mass transit and policies to reduce congestion on roads, highways, and urban metropolitan centers;and promotion of non-motorized transport (Sánchez- Triana and others 2013). Climate policies... Climate policies in the agricultural sector include improved soil management practices. Due to high summer temperatures (40–50°C), fine dust is Figure 5 GHG Emissions in South Asia Sources: IEA 2009; World Bank 2010. Note: GDP = gross domestic product; GHG = greenhouse gases. 0 0.1 0.2 0.3 0.4 0.5 a. CO2 emissions intensity in South Asia, 2007 1971 1975 1980 1985 1990 1995 2000 2004 2005 2006 2007 CO2 emissions/GDPusing purchasingpowerparities Pakistan India Nepal Bangladesh Sri Lanka b. Contribution of GHG emissions in South Asia, 2005 Afghanistan, 0% Bangladesh, 3% Bhutan, 0% India, 89% Maldives, 0% Nepal, 0% Pakistan, 7% Sri Lanka, 1%
- 46. 20 Executive Summary Cleaning Pakistan’s Air • http://dx.doi.org/10.1596/978-1-4648-0235-5 transported into the atmosphere with the rising hot air and forms “dust clouds” and haze over many cities of southern Punjab and upper Sindh. Dust storms are also generated from deserts (Thal, Cholistan, and Thar), particularly during the sum- mer, and adversely affect air quality in the cities of Punjab and Sindh. Improved soil management practices increase fertility and soil quality, while at the same time enhancing adaptation to drought by improving the soil’s water content and resource conservation. Soil and water management enhances soil carbon sequestra- tion (through increased organic matter residues returned to soil) and reduces emis- sions from land use, land-use change, and intensive agriculture practices. These actions can play an important role in voluntary carbon markets by promoting the creation of large carbon sinks and stocks (Akbar and Hamilton 2010). Policy Options for Abating Urban Air Pollution from Mobile Sources Managing emissions from mobile sources... Possible interventions to control and reduce PM emissions from mobile sources include (a) reducing sulfur in diesel and fuel oil, (b) retrofitting in-use diesel vehicles with PM emission-control technology, (c) converting diesel-fueled minibuses and vans to CNG,14 (d) con- trolling PM emissions from motorcycles, and (e) converting three-wheelers (rick- shaws) to CNG. These interventions would not only reduce PM emissions, but low-sulfur fuels would also reduce secondary particulates by reducing sulfur dioxide emissions. Other potential interventions that should be assessed include curtailing burning of solid waste in the city (and using the informal recycling industry), controlling PM emissions from ferrous metal sources and other indus- trial sources, improving street cleaning, and controlling construction dust. Reducing sulfur content... Sulfur in diesel is being reduced to 500 parts per million (ppm) in Pakistan since 2012, but no confirmed timetable has been established for 50-ppm sulfur diesel. The analysis estimates that the health ben- efits of using 500-ppm sulfur content in diesel in road transport amount to at least US$2.3–3.5 per barrel of diesel for light diesel vehicles and large diesel buses and trucks used primarily within Karachi. Lowering the sulfur content further to 50 ppm would provide additional health benefits of US$3.0–4.6 per barrel.15 This compares to an approximate cost of US$1.5–2.5 per barrel for lowering the sulfur content to 500 ppm and US$2–3 per barrel for lowering sulfur from 500 ppm to 50 ppm. Thus, the midpoint estimated health benefits per dollar spent (that is, benefit-cost ratio) on cleaner diesel are in the range of about US$1.1–1.2 for light-duty diesel vehicles, and US$1.7–1.8 for large buses and trucks, for both 500-ppm and 50-ppm diesel (figure 6). Health benefits of reducing sulfur... Fuel oil in Pakistan generally has a sulfur content that averages around 3%, but some fuel oil with 1% sulfur is being imported. PM emission rates from combustion of fuel oil are greatly influenced by the sulfur content. Reducing sulfur from 3% to 1% is estimated to have health benefits of US$35–47 per ton of fuel oil. The additional cost of
- 47. Executive Summary 21 Cleaning Pakistan’s Air • http://dx.doi.org/10.1596/978-1-4648-0235-5 low-sulfur fuel oil in the international markets fluctuates and has recently been around US$50 per ton. Thus, use of low-sulfur fuel oil should be targeted at users within urban centers. Additional health benefits of low-sulfur fuel oil include reduced sulfur dioxide emissions and, thus, lower secondary particulates formation. Catalysts and filters... More stringent PM emission standards and control options can be implemented for diesel vehicles once low-sulfur diesel is available. Euro standards can be mandated on new diesel vehicles (and second-hand imports), and PM control technologies can effectively be installed on in-use diesel vehicles, such as diesel oxidation catalysts (DOCs) and diesel particulate filters (DPFs). DOCs require a maximum of 500-ppm sulfur in diesel and DPFs require a maximum of 50 ppm to function effectively. A DOC generally reduces PM emissions by 20–30%, while a DPF reduces PM by more than 85%. DOCs had already been installed on over 50 million diesel passenger vehicles and more than 1.5 million buses and trucks worldwide five or six years ago. Practices in other countries... All new on-road diesel vehicles in the United States and Canada are equipped with a high-efficiency DPF, while all new diesel cars and vans in the European Union have been equipped with DPF since 2009. Worldwide, over 200,000 heavy-duty vehicles had already been retrofitted with DPF about six years ago. DOCs and DPFs have also been used for retrofitting buses and trucks in many countries and locations, both on a wide scale and in demonstration projects. Potential candidates for retrofitting with a DOC, or with a DPF when 50-ppm sulfur diesel becomes available, are high-usage commercial diesel vehicles that Figure 6 Benefit-Cost Ratios of Low-Sulfur Fuels in Karachi Source: Sánchez-Triana and others 2014. Note: Midpoint estimate of incremental cost of low-sulfur fuels. S is the sulfur content in fuel oil. 0 0.3 0.5 0.8 1.0 1.3 1.5 1.8 2.0 Diesel (sulfur 500 ppm) Diesel (sulfur 50 ppm) Fuel oil (S = 1%) Light-duty diesel vehicles Buses and trucks Fuel oil used within Karachi
- 48. 22 Executive Summary Cleaning Pakistan’s Air • http://dx.doi.org/10.1596/978-1-4648-0235-5 Table 4 Estimated Health Benefits of Retrofitting DieselVehicles with PM Control Technology US$/vehicle/year Vehicle type Diesel oxidation catalyst Diesel particulate filter Vehicle usage Vehicle usage 35,000 km/year 70,000 km/year 35,000 km/year 70,000 km/year Heavy-duty trucks 284 568 647 1,295 Large buses 208 417 475 949 Minibuses 133 265 302 604 Light-duty vans 95 189 216 432 Source: Sánchez-Triana and others 2014. Figure 7 Benefit-Cost Ratios of Retrofitting In-Use DieselVehicles with DOC Source: Sánchez-Triana and others 2014. Note: Seven years of useful life of diesel oxidation catalysts (DOC); 50,000 km/year vehicle usage. 0 0.2 0.4 0.6 0.8 1.0 1.2 1.4 Heavy-duty trucks Large buses Minibuses Light-duty vans are on the roads of urban centers in Pakistan and primarily used within the city. The health benefits of retrofitting per vehicle per year are estimated in this book to be in the range of about US$95–568 for a DOC and US$216–1,295 for a DPF, depending on the type of vehicle and annual usage (table 4). A DOC costs US$1,000–2,000 and a DPF as much as US$6,000–10,000. Therefore, the expected number of years that the vehicle will continue to be in use and years that the devices will be effective is an important consideration. The midpoint estimate of the benefit-cost ratio of retrofitting in-use diesel vehicles with a DOC, once 500-ppm diesel is available, is about 1–1.3 for large buses and trucks used within the city, but the benefit is lower than the cost for minibuses and light-duty vans (figure 7).16 Estimated health benefits of a DPF are currently lower than its cost for all classes of diesel vehicles, but should be reassessed once 50-ppm sulfur diesel is available in the future. Given the relatively high cost of DOCs per unit of PM emission reduction, alternative options can be considered for in-use diesel-fueled minibuses and
- 49. Executive Summary 23 Cleaning Pakistan’s Air • http://dx.doi.org/10.1596/978-1-4648-0235-5 light-duty vans. One such option is conversion to CNG, which almost entirely eliminates PM emissions. This book estimates the health benefits of CNG conversion to be in the range of about US$455–1,288 per vehicle per year, depending on the type of vehicle and annual usage (table 5). Conversion of such vehicles to CNG in Pakistan is reported to cost in the range of PRs 150–200 thousand per vehicle, or US$1,900–2,550 at exchange rates of 2009. Applying a cost of PRs 200,000, the midpoint estimate of the benefit-cost ratios on conversion to CNG are 1.7 for minibuses and 1.2 for light- duty vans.17 The benefit-cost ratios for vans are somewhat lower than for mini- buses due to a difference in estimated PM emissions per kilometer of vehicle use. Health benefits can be twice the cost of converting to CNG... Two-stroke rickshaws are also a large source of PM emissions and urban noise. Conversion to a four-stroke engine using CNG is an option and is reported to cost around PRs 40–60 thousand in Pakistan. At a cost of PRs 60,000, the midpoint estimate of health benefits is two times the conversion cost. Two-stroke motorcycles also tend to have high PM emissions per ton of gasoline consumption and contribute greatly to urban noise. Many countries are therefore limiting or banning the use of two-stroke motorcycles. Four-stroke motorcycles emit substantially less PM, are more fuel efficient, and cause substantially less noise. The additional cost of a four-stoke motorcycle engine is approximately US$50 but varies with engine size.At this cost, and for a two-stroke motorcycle emitting 0.25 grams of PM per kilometer, the health benefits of switching to a four-stroke motorcycle are around US$2.9 per dollar of additional engine cost. When fuel savings are taken into account, the benefit-cost ratio is as high as 4.2. Restrict CNG in autos... In view of CNG supply constraints and more energy- efficient alternative uses of CNG (for example, thermal power generation), it would be advisable to restrict CNG in automobiles (which make ubiquitous use of inefficient CNG conversion kits) and reserve its use for commercial and public service vehicles (buses, vans, utility trucks, and rickshaws). Emissions from spark- ignition automobiles and other vehicles could be better controlled by requiring Euro 2 and higher emission standards on both locally assembled and imported automobiles (including used cars), now that unleaded gasoline is locally refined and is available in the country. Table 5 Estimated Health Benefits of Conversion to CNG US$/vehicle/year Vehicle type Vehicle usage 35,000 km/year 70,000 km/year Minibuses 644 1,288 Light-duty vans 455 909 Source: Sánchez-Triana and others 2014. Note: CNG = compressed natural gas.
- 50. 24 Executive Summary Cleaning Pakistan’s Air • http://dx.doi.org/10.1596/978-1-4648-0235-5 Concerns about CNG... However, concerns about safety and economic reliabil- ity might threaten the sustainability of CNG substitution. A number of factors can affect the economic attractiveness of transport fueled by natural gas. These factors include the availability of natural gas, the high cost of converting vehicles to CNG, continuing public concerns about safety (for example, conversions of poor quality have led to some safety hazards, such as bus and taxi fires in some cities around the world), and limited incentives to build CNG fueling stations (Gwilliam, Kojima, and Johnson 2004, 36). Switching to natural gas would make economic sense only if the retail price of CNG were about 55–65% of the cost of the fuel being replaced (Kojima and others 2000, 4). The GoP might consider developing long-term agreements with neighboring countries to ensure a steady supply of natural gas before promoting further conversion efforts. Mass transportation and traffic management... In the medium term, the GoP might consider other alternatives to reduce air pollution, particularly from mobile sources, such as supporting the development of mass transportation and improved traffic management in Pakistan’s main cities. Experiences from countries such as Brazil, Colombia, and Mexico demonstrate the benefits of relatively new public transport systems, such as Bus Rapid Transit, which can use bus-based technologies to transport increasingly larger volumes of customers at moderately high speeds even in very congested urban areas.While still substantial, the investments needed to develop and operate these systems are significantly lower than those of tradi- tional mass transport systems, such as underground metros. In addition, these sys- tems have been able to demonstrate their contributions to reduce congestion and pollution, and some of them have even received international funding for their role in reducing GHG emissions from mobile sources. Additional policies are worth assessing in the medium term.They include traffic control, restricted circulation of private cars during high pollution episodes, urban planning and land use, establish- ment of high occupancy vehicle lanes, measures to improve traffic flow such as ‘green wave’ coordination of traffic signals, and improvement of infrastructure (for example, paving of roads and regular sweeping would reduce PM emissions).18 Non-motorized vehicles... The use of non-motorized vehicles, such as bicycles, should also be promoted as a means to reduce pollution from mobile sources. However, in doing so, the GoP might consider the development of dedicated bike paths, pedestrian zones, and other measures to reduce the potential conflict between motorized and non-motorized vehicles. Policy Options for Abating Urban Air Pollution from Stationary Sources Power plants, burning of waste... Stationary sources of air pollutant emissions in Pakistan include thermoelectric power plants; industrial units; and the burning of agricultural residues, sugarcane fields, and municipal waste. According to the 2011 Census of Manufacturing Industries, the number of industrial facilities in Pakistan amounts to 6,417 industrial units.Textiles, food products and beverages,
- 51. Executive Summary 25 Cleaning Pakistan’s Air • http://dx.doi.org/10.1596/978-1-4648-0235-5 tanneries, and chemical industries account for 60% of the total. Most of the industrial facilities are located in clusters in Punjab and Sindh. Self-reported data... Most data on the emission of pollutants by stationary sources, such as factories, come from a database for self-reported pollution infor- mation. The federal government issued the NEQS for the Self-Monitoring and Reporting Tool (SMART) in 2001, under which all industrial units are to submit reports required for the industry category in which their unit is placed. By mid 2014, SMART had proven unable to provide information on emission of pollut- ants by stationary sources in Pakistan. The level of reporting on air pollutant emissions is low, as only 99 out of 6,417 industrial facilities have registered their emissions under the SMART program. Industrial activities... Industrial activities, particularly those using fossil fuels and those manufacturing cement, are a significant source of air pollution. Despite the paucity of data, sporadic monitoring of air pollutants in Pakistan’s industrial areas suggests that international standards for PM10 and NOX are exceeded frequently (table 6) (Hashmi and Khani 2003; Hashmi, Shaikh, and Usmani 2005; Ministry of Finance 2010; Rajput and others 2005; Smith and others 1996; Wasim and others 2003). Key binding constraints to controlling air pollution in Pakistan include gaps in identification of stationary sources, an ineffective voluntary pro- gram for monitoring air emissions from stationary sources, a weak regulatory framework, and lack of enforcement. Furnace oil... High sulfur content of furnace oil should be reduced, as it contrib- utes significantly to PM and SO2 emissions. Sulfur concentrations in furnace oil used in Pakistan electricity generation and industrial applications range from 2,000 to 9,000 ppm. Table 6 Fuel and Air Pollution Emissions Fuel type PM2.5 SOx NOx VOCs Propane M L M Natural gas L M H M Kerosene M H M M Diesel (low sulfur) M M H M Diesel (high sulfur) H H H M Fuel oil H H H M Crude oil H H H M Coal (low sulfur) H M M L Coal (high sulfur) H H M L Wood and biomass H H H H Source: Adapted from Sánchez-Triana 1993. Note: L = low concentration of atmospheric emissions, M = medium concentration of atmospheric emissions, H = high concentration of atmospheric emissions, PM2.5 = particulate matter of less than 2.5 microns, SOx = sulfur oxides, NOx = nitrogen oxides, VOC = volatile organic compounds. Blanks indicate no atmospheric emission.
- 52. 26 Executive Summary Cleaning Pakistan’s Air • http://dx.doi.org/10.1596/978-1-4648-0235-5 Diffuse sources of air pollution... Diffuse sources of air pollution in Pakistan include the burning of municipal waste and of bagasse from sugarcane fields in rural areas, and the formation of dust clouds due to dry meteorological condi- tions. Due to their heterogeneity, nonpoint source pollution is more difficult to monitor and regulatory measures are more difficult to enforce. Tackling diffuse sources of air pollution... Several measures and proper institutional coordination are still needed to tackle diffuse sources of air pollution in Pakistan. Solid waste collection by government-owned and government- operated services in Pakistan’s cities currently averages only 50% of waste quanti- ties generated; however, for cities to be relatively clean, at least 75% of these quantities should be collected. None of the cities in Pakistan has a proper solid waste management system extending from collection of solid waste up to its proper disposal. In terms of emissions stemming from the burning of fields for planting, green cut agricultural practices can make important contributions, as evidenced from experiences in Brazil. Recommended measures... The recommended measures adopted by the GoP in the PCAP to address dispersed area sources are (a) block tree plantation; (b) afforestation in deserts; (c) sand dune stabilization; (d) paving of shoulders along main roads; and (e) proper disposal of solid waste. Implementing these measures will require a coordinated approach between the CCD, provincial EPAs, and other departments and local governments (Ghauri 2010). Interventions targeting industrial sources... Interventions to control industrial air pollution in Pakistan include the replacement of fuel oil and coal by gas, intro- duction of low-sulfur diesel and furnace oil, energy efficiency, and end-of-pipe pollution control technology. Polluting factories could also move out from areas where they violate land-use regulations. Various environmental policy instru- ments are available to Pakistan for promoting interventions to control industrial air pollution. These include (a) economic and market-based instruments, (b) direct regulation by government or “command-and-control” measures, (c) public disclosure, and (d) legal actions. Market-based instruments... Market-based instruments—such as taxes, pollu- tion charges, tradable permits, or pricing policies—can be effective in moving existing markets and policies towards improved environmental outcomes. Economic instruments are based on the polluters pay principle where the polluting party pays for the damage done to the natural environment. A strong enforcement system is key to enhancing the effectiveness of economic instru- ments (World Bank 2008b). Lack of understanding of the polluters pay principle... In Pakistan, the lack of understanding between the GoP and industries regarding the application of the PPP hampers the potential of market-based instruments for moving existing
- 53. Executive Summary 27 Cleaning Pakistan’s Air • http://dx.doi.org/10.1596/978-1-4648-0235-5 markets and policies towards improved environmental outcomes. In addition, a weak environmental framework, especially the failure to stipulate whether industries are responsible for bearing the cost of pollution reduction, hinders the successful implementation of cleaner production systems in heavily polluting industries. Price distortions... Removal of price distortions in Pakistan could be designed to promote changes in the fuel mix towards cleaner fuels such as natural gas, while also contributing to moderating energy demand and reducing GHG emissions. Fuel prices are distorted because of rationing of fuel supply, but also because they fail to account for the adverse health effects of fossil fuel with the result that highly polluting fossil fuels are used excessively. Numerous examples dem- onstrate the perverse incentives linked to price distortions for energy, for example, disincentives to switch from diesel or furnace oil to natural gas. Another illustration involves the disincentive to energy conservation provided by heavily subsidized prices for gas to households and fertilizer plants. If price distortions to gasoline and diesel were removed, and the differences in tax rates for different fuels were eliminated, domestic prices for those fuels could be brought in line without major distortions. Natural gas would then become more competitive and there would be incentives for Pakistani firms to engage in inter- national trade of natural gas, including imports from the Islamic Republic of Iran or Turkmenistan. Shifting between fuels... In addition, pollution charges could be designed to promote a shift from using highly polluting fuels such as charcoal, biomass, or high-sulfur-content furnace oil and diesel to cleaner fuels such as natural gas. Differentiating prices across fuel types to minimize negative impacts on eco- nomic activity requires careful planning. An essential input for fuel taxes or pollution charges design is the targeting of fuels according to pollutants. Fuel types vary in their potential to produce atmospheric emissions that pollute the environment (table 6). Command and control measures... Command and control measures can be effectively promoted and aligned with country context and conditions. This approach for preventing environmental problems generally relies on emissions standards, ambient standards, and technological standards, in conjunction with enforcement programs. Parameters for which limits have been established and regulated worldwide include pollutants such as PM2.5 or PM10 (Faiz,Weaver, and Walsh 1996; Gurjar, Molina, and Ojha 2010). For example, command and con- trol instruments are used in several countries for setting ambient air primary standards for PM2.5 at 14.0 µg/m3 (annual average) and 35 µg/m3 (24-hour average). Examples of common command and control instruments that use technologi- cal standards include phased reduction of the sulfur content in diesel to 500 ppm
- 54. 28 Executive Summary Cleaning Pakistan’s Air • http://dx.doi.org/10.1596/978-1-4648-0235-5 in the short term and to 15 ppm in the long term. Other technological standards include requiring relocation of industries from areas where ambient air pollution concentrations exceed the legal limits to places with no thermal inversions, good atmospheric mixing conditions, and outside areas of high-population density.The relocation of industries has also been used in many neighboring countries, such as China and India, as an opportunity to upgrade the plants’ technology and improve environmental management in new plants (Li and Bin 2010). One starting point... Pakistan could start by setting and monitoring standards for fine (PM2.5) and ultrafine (PM1) PM, given their impact on human health. A national apex organization on AQM could require action plans setting mini- mum air quality standards and proposing interventions for major cities. An urgent need... Stationary sources, including point and nonpoint sources, are significant contributors to air pollution in Pakistan’s urban areas. Currently, data on emissions from these sources are not systematically collected. At the opera- tional level, there is the urgent need for collection of primary air quality informa- tion, and follow-up investigation in both the short and the medium term. This action includes improving the quality of data collection locally on the site, including training personnel. Data for SO2 , NO2 , O3 , and CO as well as PM1 , PM2.5 , and PM10 should continue to be recorded and coverage should be improved, in order to better understand the sources causing poor air quality. There is also an urgent need to carry out in-depth studies with instruments that are more sophisticated in order to better address the chemical and physical prop- erties of the PM, especially in the fine mode. Inventory of sources... Developing an inventory of stationary air pollution sources is an indispensable pillar of AQM. Official data indicate that only around 1% of the country’s industrial establishments report their emissions under the SMART program.As a result, there is little to no information that can help the Pak-EPA or the provincial environmental agencies to map the location of different sources of air pollution, assess the types and quantities of pollutants that are being discharged into the environment, identify non-compliant units, and develop the necessary corrective actions. The inventory should initially focus on large polluters but gradually evolve to include small and medium enterprises, which may cumulatively emit large quantities of air pollutants. Mandatory versus voluntary programs... Voluntary programs, including SMART, should be phased out and replaced by mandatory instruments that obligate polluters to comply with clear and enforceable environmental standards. Evidence from around the world, including both developed and developing countries, indicates that voluntary programs are ineffective for controlling pollu- tion (Esty and Porter 2001; Morgenstern and Pizer 2007). In Pakistan, the extremely low number of units that participate in SMART illustrates the tool’s