
Recommandé
Contenu connexe
Tendances
Tendances (20)
En vedette
En vedette (20)
Similaire à Term Project Activision Blizzard & Ea
Similaire à Term Project Activision Blizzard & Ea (20)
Dernier
Dernier (20)
Term Project Activision Blizzard & Ea
- 1. Table of Contents I. Executive Summary .......................................................................................................................................... 3 II. Industry Overview ........................................................................................................................................... 4 2.1 Scope (Products/Customers/Regions) .................................................................................................. 4 2.2 Competitor Analysis .................................................................................................................................... 5 2.3 Value Chain Analysis ................................................................................................................................... 6 2.4 PESTDG Model............................................................................................................................................... 7 2.4.1 Political .................................................................................................................................................. 7 2.4.2 Economic................................................................................................................................................ 8 2.4.3 Socio-Cultural....................................................................................................................................... 8 2.4.4 Technological ....................................................................................................................................... 8 2.4.5 Demographic/Psychographic ......................................................................................................... 9 2.4.6 Global ...................................................................................................................................................... 9 2.5 Porter’s 5 Forces Analysis: Interactive Gaming Industry ............................................................... 9 2.5.1 Buyer Power – (Moderate to High) ............................................................................................ 10 2.5.2 Supplier Power – (High) ................................................................................................................ 10 2.5.3 Threat of New Entrants – (Low to Moderate)........................................................................ 10 2.5.4 Threat of Substitute Products & Services – (Moderate) ..................................................... 11 2.5.5 Competitive Rivalry – (High) ....................................................................................................... 11 2.5.6 Overall Attractiveness of the Industry ...................................................................................... 12 III. Company Analysis: Activision-Blizzard Inc. ...................................................................................... 12 3.1 History........................................................................................................................................................... 12 3.2 Business Model ........................................................................................................................................... 13 3.3 Financial Information ............................................................................................................................. 14 3.4 Products & Services .................................................................................................................................. 15 3.5 Competitive Strategy ............................................................................................................................... 16 3.6 Branding & Website Analysis ................................................................................................................ 16 3.7 SWOT Analysis............................................................................................................................................ 18 3.7.1 Strengths ............................................................................................................................................. 18 3.7.2 Weaknesses ........................................................................................................................................ 18 3.7.3 Opportunities..................................................................................................................................... 19 3.7.4 Threats................................................................................................................................................. 19 IV. Company Analysis: Electronic Arts ....................................................................................................... 20 4.1 History........................................................................................................................................................... 20 4.2 Business Model ........................................................................................................................................... 21 4.3 Financial Information ............................................................................................................................. 21 4.4 Products & Services .................................................................................................................................. 22 4.5 Competitive Strategy ............................................................................................................................... 22 4.6 Branding & Website Analysis ................................................................................................................ 23
- 2. 4.7 SWOT Analysis............................................................................................................................................ 24 4.7.1 Strengths ............................................................................................................................................. 24 4.7.2 Weaknesses ........................................................................................................................................ 25 4.7.3 Opportunities..................................................................................................................................... 26 4.7.4 Threats................................................................................................................................................. 26 V. Comparison of the 2 Companies: Activision-Blizzard Inc. & EA Inc. ......................................... 27 5.1 Summary of Findings ............................................................................................................................... 27 5.2 Financial Information Comparison..................................................................................................... 28 5.3 Website Analysis ........................................................................................................................................ 29 5.4 Branding & Strategic Implications ..................................................................................................... 30 VI. Recommendations....................................................................................................................................... 31 6.1 Strategic Options Analysis: Activision-Blizzard Inc....................................................................... 31 6.2 Strategic Options Analysis: Electronic Arts ...................................................................................... 31 6.3 #1 Priority for the CEO in Activision-Blizzard Inc. ........................................................................ 32 6.4 #1 Priority for the CEO in Electronic Arts ........................................................................................ 32 VII. Appendices ................................................................................................................................................... 33 Exhibit 1: Competitive Profile Matrix ........................................................................................................ 33 Exhibit 2: Impact of General Environmental Trends on the Interactive Gaming Industry ..... 34 Exhibit 3: Porter’s 5 Forces Analysis Diagram (Interactive Gaming Industry) ........................... 35 Exhibit 4: Financial Ratio Comparison for Activision-Blizzard Inc................................................. 36 Exhibit 5: Activision-Blizzard Main Website Screenshot .................................................................... 37 Exhibit 6: Activision Website Snapshots ................................................................................................... 37 Exhibit 7: Activision E-Commerce Model Snapshot .............................................................................. 38 Exhibit 8: Blizzard Website Snapshot ....................................................................................................... 38 Exhibit 9: Blizzard Website E-Commerce Model Snapshots .............................................................. 39 Exhibit 10: Financial Ratio Comparison for Electronic Arts Inc. ..................................................... 40 Exhibit 11: EA Main Website Snapshot ..................................................................................................... 41 Exhibit 12: EA Website Snapshot ................................................................................................................ 41 Exhibit 13: EA E-Commerce Website Snapshots .................................................................................... 42 VIII. References ................................................................................................................................................... 43 Page 2 of 44
- 3. I. Executive Summary The purpose of this project was to compare two different organizations in the same industry. For this project, I had chosen to compare Activision-Blizzard Inc. and Electronic Arts Inc. Both of these organizations operate in the interactive gaming industry across various gaming platforms. In this way, “the company operates in two business segments: publishing of interactive entertainment software and distribution of interactive entertainment software and hardware products.”1 After carefully analyzing macro industry and specific organizational factors, key priorities were identified in developing specific recommendations for Activision Blizzard and Electronic Arts Inc. Overall attractiveness of the interactive gaming industry can be described as being fairly attractive because it has strong competition, high buyer power, moderate threat of entrants, moderate substitutes, and high supplier power. Overall attractiveness in this industry is expected to get worse as smaller developers get bought up by bigger players, and the negative impact of the recession gets played out in the future. Provided that a game developer in this industry is able to mitigate economic factors and buyer power, it has a tremendous opportunity to stand out amongst the competition and carve out a bigger niche in this industry. Activision Blizzard Inc. is a console game publisher and online development organization. In terms of its history, it “was formed by combining Activision, Inc., an independent publisher of interactive entertainment, and Vivendi Games, Vivendi SA’s interactive entertainment business.”2 Activision Blizzard’s portfolio has various video game titles “such as Guitar Hero, Call of Duty, and Tony Hawk, as well as Spider- Man, X-Men, Shrek, James Bond and Transformers, and franchises, such as Crash Bandicoot and Spyro and Blizzard Entertainment’s StarCraft, Diablo and Warcraft.”3 Electronic Arts Inc. is the leading interactive entertainment software company. It “develops, publishes, and distributes interactive software worldwide for videogame systems, personal computers, cellular handsets and the internet. The company’s flagship brands include EA, EA Games, EA Sports, The Sims and Pogo, as well as Hollywood films game series including The Lord of the Rings, The Godfather, Harry Potter, and Batman.”4 In conducting a thorough analysis of both organizations based on specific criteria – financing, website, branding, competitive strategy, SWOT analysis, and products/services, it was concluded that Electronic Arts is more successful in terms of generating higher revenues, having a greater market share, availability of product selection, value added services, e-commerce capabilities, and value for money. However, Activision-Blizzard Inc. has caught up considerably in terms of gaining market share, improving their product selection, e-commerce capabilities, and reducing operating costs which were lower than EA in fiscal year end 2008 (107.7% for Activision-Blizzard versus 113.3% for EA). In this way, Activision- Blizzard’s subscription based model will become more successful in the future because of the potential growth of subscription-based online gamers in the Asia-Pacific region – 23% compounding growth as compared to 4.0% growth of gamers in North America 5). In this case, EA has to continue to develop its gaming architecture further, restructure its publishing studios, divest its worst selling games, and continue to develop games for the mobile and social networking platform market. If I had to choose only one company in which to invest in, I would choose Activision-Blizzard Inc. because of its unique business model, strong global presence in niche based gaming genres, R&D investment strategies, and potential for growth in the Asia-Pacific region. 1 Marketline > Profile > Activision, inc. Retrieved 1/18/2009, 2009, from http://www.marketlineinfo.com.ezproxy.library.dal.ca/library/iProduct_product.aspx?R=36B9F70C-2ED3-416A-BD6A 74E543D87235&s=IDAHAJ1B 2 Factiva > Activision Blizzard Company Profile. Retrieved 1/18/2009, 2009, from http://global.factiva.com.ezproxy.library.dal.ca/ar/default.aspx 3 Marketline > Profile > Activision, inc. Retrieved 1/18/2009, 2009, from http://www.marketlineinfo.com.ezproxy.library.dal.ca/library/iProduct_product.aspx?R=36B9F70C-2ED3-416A-BD6A- 74E543D87235&s=IDAHAJ1B 4 Marketline > Profile > Electronic Arts. Retrieved 1/18/2009, 2009, from http://www.marketlineinfo.com.ezproxy.library.dal.ca/library/iProduct_product.aspx?R=E9821E9D-293D-4412-AA7F C16950961D78&s=IDAGMRNB 5 Marketline > Profile > Vivendi S.A. Retrieved 3/10/2009, 2009, from http://www.marketlineinfo.com.ezproxy.library.dal.ca/library/iProduct_toc.aspx?R=EEA43AE4-13C5-492C-8768- D27186836EA1&N=4294834008 Page 3 of 44
- 4. II. Industry Overview 2.1 Scope (Products/Customers/Regions) The interactive gaming industry is comprised of manufacturing and developing of home entertainment software for the PC (including Macintosh), console gaming systems (Xbox 360,Nintendo Wii & GameCube, Sony Playstation 2 & 3), portable gaming systems – Playstation System Portable, Gameboy Advance, Nintendo DS), online gaming (web and Java based software), and mobile platforms (iPod, iPhone and Smartphones)6. In this way, this industry is very much global in terms of the development of games to the end users of software that are comprised of hardcore and casual gamers across many multiple platforms. In terms of the United States interactive software market, it “generated total revenues of $9.5 billion in 2007, which represents a compound annual growth rate (CAGR) of 4.8% for the six-year period spanning 2002-2007”7. It is interesting to know that “console games software sales represented 82.6% of the market’s overall value. In comparison, the sales of personal computing games represented 17.4% of the market’s aggregate revenues”8 In this way, development of new hardware sales usually drive the demand for development of high performance gaming software, as illustrated below9. 6 Marketline > Industry profiles (Gaming Software). Retrieved 3/10/2009, 2009, from http://www.marketlineinfo.com.ezproxy.library.dal.ca/library/DisplayContent.aspx?N=210+4294853461 7 Ibid 8 Ibid 9 Industry: Video games. Retrieved 3/16/2009, 2009, from http://www.wikinvest.com/industry/Video_Games#_note-14 Page 4 of 44
- 5. As depicted previously, the future market value of this industry in the United States is expected to grow by 5% for the next five years, and total market value of $10.3 billion by the end of 201110. In comparison, the Asian market, UK market, and the French market are expected to grow with CAGRS of 15%, 8.9%, and 2.4% over the same five year period11. 2.2 Competitor Analysis The interactive gaming industry is comprised of 86 competitors as of 200812, with more consolidations of companies likely in the future due to the increased threats faced by piracy, increased competitive factors, riskiness due to upfront developmental costs, economic recessionary factors, and “rise of game players as developers of game content”13. These aspects will be discussed in more detail in the industry and SWOT analysis later on in this report. The top 10 major competitors in the interactive gaming industry (all figures are from year end 2008) are comprised of the following game developers: Rank Company Name Sales Employees Market Cap Net Income Net Profit USD (m) USD (m) USD (m) Margin 1 Electronic Arts Inc. 3,665.00 9,037 5,715.52 - 454.00 -12.39% 2 KONAMI CORPORATION 3,233.86 5,472 2,067.05 199.48 6.64% 3 Activision Blizzard, Inc. 3,026.00 2,149 12,915.29 -107.00 -3.54% 4 SQUARE ENIX HOLDINGS CO., LTD. 1,605.53 2,973 1,874.94 100.19 6.19% 5 Take-Two Interactive Software, Inc. 1,537.53 2,100 591.14 97.10 6.32% 6 Ubisoft Entertainment SA 1,450.90 4,323 1,429.89 142.36 8.49% 7 THQ Inc. 1,030.47 2,400 184.41 -35.34 -3.58% 8 RealNetworks, Inc. 604.81 1,774 290.21 -243.88 -40.32% 9 Infogrames Entertainment 372.01 555 47.31 -65.39 -21.33% 10 KOEI CO., LTD. 309.42 1,191 469.34 55.96 18.44% Source: Reuters, Factiva14 In this way, competition in the interactive gaming industry (Please refer to Exhibit 1 that highlights the competitive profile matrix) can be described as very strong. Since the “development costs are high and many titles often make little profit, as software development companies rely even more heavily on blockbuster hits for substantial revenue streams”15 10 Ibid 11 Ibid 12 Factiva > Electronic Arts Company Profile. Retrieved 3/15/2009, 2009, from http://global.factiva.com.ezproxy.library.dal.ca/ar/default.aspx 13 Video Game Industry - Wikipedia, the free encyclopaedia. Retrieved 3/15/2009, 2009, from http://en.wikipedia.org/wiki/Video_game_industry 14 Factiva > Electronic Arts Company Profile. Retrieved 3/15/2009, 2009, from http://global.factiva.com.ezproxy.library.dal.ca/ar/default.aspx 15 Video Game Industry - Wikipedia, the free encyclopaedia. Retrieved 3/15/2009, 2009, from http://en.wikipedia.org/wiki/Video_game_industry Page 5 of 44
- 6. 2.3 Value Chain Analysis The Value Chain for the interactive gaming industry can be illustrated in the following manner: - Design of new - - Development of - Attracting the right - Forecasting software titles for gaming studios human capital talent Models/Trends various platforms - - Manufacturing (developers/producers) Services - Value added services - Protection of intellectual property Firm Infrastructure Human Resource Management Technology development (R&D) Procurement Inbound Outbound Marketing Operations Service Logistics Logistics & Sales - Capital layer: - Production - Distribution - Publishing layer: -‘End Users’ (content providers layer: content layer: generating establishing royalty Layer: services & software creation & added game titles for and retail fees with through e- developers) services placement console partners; commerce models - Talent layer: in- - Tools layer: through online - Hardware layer: (online updates, house or individual game engines, and retail marketing/promotion subscription development team mgmt. tools, etc. distribution of the game catalogue based models, channels etc.) Source: Flew, Terry & Humphreys, Sal (2005). "Games: Technology, Industry, Culture". New Media: an Introduction (Second Edition). Oxford University Press. pp. 101-114 According to Ben Sawyer of Digitalmill, the interactive gaming industry value chain is made up of six interconnected layers: 1. Capital and publishing layer: upfront costs of developing new titles and seeking returns through licensing of the titles (typically through royalties from console manufacturers)16. 2. Product and talent layer: consists of developers, designers and artists, who may be working under individual contracts or as part of in-house development teams17. 16 Video Game Industry - Wikipedia, the free encyclopaedia. Retrieved 3/15/2009, 2009, from http://en.wikipedia.org/wiki/Video_game_industry 17 Ibid Page 6 of 44
- 7. 3. Production and tools layer: creation of content production tools, game development middleware, customizable game engines, and production management tools18. 4. Distribution layer: involved in generating and marketing catalogues of games for retail and online distribution19. 5. Hardware (or Virtual Machine or Software Platform) layer: or the providers of the underlying platform, which may be console-based, accessed through online media, or accessed through mobile devices. This layer now includes non-hardware platforms such as virtual machines (e.g. Java or Flash), or software platforms such as browsers or social networking platforms such as Facebook.20 6. End-users layer21: Value-added services after the games have been sold that includes up- selling of another game title, online updates, subscriptions for new features, etc. 2.4 PESTDG Model In order to gain more understanding of the interactive gaming industry, it is important to examine the external macroeconomic factors that are affecting this industry as a whole. The intention of this analysis is to understand the degree to which the environmental forces affecting this industry, and how a company in this industry can take advantage of the opportunities, as well as minimize threats posed to their business. Please refer to Exhibit 2 for a summary of the impact of general environmental trends and events on the interactive gaming industry. 2.4.1 Political In terms of the interactive gaming industry, there are some factors that would affect the future viability of a company operating in this industry. These factors are home market lobbying/pressure groups, future legislation, and funding/grants by governmental bodies. For instance, Montreal has quickly become the number one hub of game development, with “the number of people employed in the game industry sky rocketing to 177% in two years.”22 This trend “has been fuelled by aggressive government incentives, some of which Ubisoft helped to shape a decade ago, encouraging companies to set up shop in the region. Undoubtedly the weaker Canadian dollar of past years helped, as Canada provided US companies with inexpensive outsourcing to culturally-similar game workers.”23 Despite 18 Ibid 19 Ibid 20 Ibid 21 Ibid 22 Video game venture capital - VGVC » Government Activity. Retrieved 3/16/2009, 2009, from http://www.vgvc.net/?cat=165 23 Ibid Page 7 of 44
- 8. these promising trends however, there is a strong possibility in the future that lobbying interests could effectively pressure the governments to implement legislation that prohibits production of violent gaming and having a subversive lifestyle. As a result, these events would have a tremendous negative impact on the game publishing and console industry, perhaps even ‘killing’ the interactive gaming industry as it exists today. 2.4.2 Economic Currently, the interactive gaming industry is facing tremendous challenges because of the increase in costs associated with developing the games, and the recessionary trends occurring throughout the world. In this way, the general economic trends associated with issues in the domestic and global economy, monetary/trade policies, and decline in market trends associated with the interactive gaming industry have tremendous negative consequences for the future viability of companies in this industry. Thus, it is essential for companies in the interactive gaming industry to be more aggressive than ever in acquiring new customers for their products. This is because many of the game publishers can be creative in this type of economy, where they can offer innovative products that improves their overall lifestyle (example of this is designing an interactive exercise [Nintendo Wii Fit] or educational software [Scrabble]). 2.4.3 Socio-Cultural This trend is particularly important because it greatly influences the organization’s strategic formulation of which genre of games that it should compete in. In the interactive gaming industry, a high degree of customization is required, where the end users can adapt their lifestyle and software to the local culture. To a certain extent, the software is somewhat standardized, but creation of the ultimate experience and thrills are the crucial intangibles that makes one game publisher differentiate itself from its competition. In this way, innovation if gaming and quick adoption of technology has positive impacts on the interactive gaming industry as a whole. 2.4.4 Technological Overall, increasing innovations in technology has led to greater development of products being available to the end user. Consequently then, certain technological innovations such as the Internet, and processing power, have led to tremendous growth of interactive gaming. In addition, these trends have generated greater rivalry among the competitors in this industry, through different procurement channels such as building e- commerce models, technological innovations, reducing the cost of obtaining information, and government subsidies that have had a tremendous impact (both negative and positive) on the consumption habits of consumers around the world. Page 8 of 44
- 9. As technological innovation is continuously evolving and revolutionizing the landscape of interactive gaming software and its capabilities, those who want to survive must maintain their competitive advantage developing new and dynamic ways to entice customers. Organization must be aware of the technology adoption life cycle, realize when it will reach maturity, and be prepared through research and development initiatives to be ahead of the curve. 2.4.5 Demographic/Psychographic These types of trends – demographic and psychographic are important in understanding the interactive gaming industry because it creates specific opportunities that organizations can exploit and take advantage of. Understanding specific demographic trends and the impact of aging population in the developed countries, allows an organization to effectively create customized strategy that targets different gamers with products suited to their needs. Psychographic trends are equally as important in understanding the different mixture of groups of people that exist within the country, which directly impacts the nature of the strategy (localized or global) that the firms can engage in. 2.4.6 Global In today’s globalized society, there is a need for organizations to expand their products and services beyond the borders of its home nation. This aspect is especially true game publishing companies, where the emergence of economies in the developing world such as India and China, has caused surging demand for innovative software, creativity in how people interact with each other, customization, and consumption of Western lifestyle. Consequently then, these factors have a significant impact on the organization’s strategic initiatives and negative impact on the environment due to perception of obsolesce notions. Perception of obsolesce means that people perceive a product (especially interactive technology) as being useless after a relatively short period of time because they perceive the new products as being innovative, when the old technology is still useful and functioning more effectively than the newer technology. Thus, it is very important for the organizations to understand the factors of globalization and the impact of competitive industry trends that exist in the interactive gaming industry. 2.5 Porter’s 5 Forces Analysis: Interactive Gaming Industry Industry analysis (please see Exhibit 3 for the Porter’s 5 forces diagram) highlights the underlying issues that determine competitive performance in a dynamic environment, as well as financial viability in the future. Even if the forces affecting this industry change, they remain the determinant of competitive success. Page 9 of 44
- 10. 2.5.1 Buyer Power – (Moderate to High) Buyers in the interactive gaming industry generally fall under one category, which are mainly consumers of software, “since consumer demand is expected to exert strong pull-through on retailers.”24 In this way, consumers have tremendous power in this industry because they can demand better quality of products (resulting in increasing costs for game developers), and “generally playing industry participants off against one another, all at the expense of industry profitability.”25 Consequently then, these buyers have tremendous negotiating advantage depending on their size and influence in the local markets. Moreover, buyers in this industry face low switching costs and can easy switch to other game publishers if they feel that they are not getting value for their money. In this way, “brand loyalty is relatively low and although leading companies achieve a degree of brand recognition and success through established games lines, the success of individual titles is highly dependent upon critical review.”26 Thus, buyer power in this industry is moderate to high, which is unfavourable for the industry as a whole. 2.5.2 Supplier Power – (High) In the interactive gaming industry, games software publishing is “regarded as being ‘weightless’ and labour intensive, because success in this market requires the services of talented software developers, whether working in-house or as third parties.”27 In this way, the variation of inputs (considered to be R&D technology development) increases the notion of supplier power. For instance, “use of intellectual property from other media – utilization of characters from popular films, is also a significant input for many publishers.”28 Thus, supplier power is pretty high, which is favourable for this industry. Consequently then, suppliers can become more powerful than the buyers in this industry if they increase the switching costs for the buyers, decrease availability of substitutes, and offer differentiated products and services. 2.5.3 Threat of New Entrants – (Low to Moderate) Barriers to entry in an industry is determined by the ease of entry by new players who are trying to challenge the market share of existing entities, making the overall industry situation unattractive. In this case, the threat of new entrants in the interactive gaming industry is considered to be low to moderate. Barriers to entry are relatively low because “fixed costs are relatively low and thus conducive to the entry of new players into 24 Marketline > Industry profiles (Gaming Software). Retrieved 3/10/2009, 2009, from http://www.marketlineinfo.com.ezproxy.library.dal.ca/library/DisplayContent.aspx?N=210+4294853461 25 Porter, Michael E., (2008). The Five Competitive Forces That Shape Strategy, Harvard Business Review, Vol. 86 Issue 1, p78-93 26 Marketline > Industry profiles (Gaming Software). Retrieved 3/10/2009, 2009, from http://www.marketlineinfo.com.ezproxy.library.dal.ca/library/DisplayContent.aspx?N=210+4294853461 27 Ibid 28 Ibid Page 10 of 44
- 11. the industry.”29 Despite this favourable trend, “development of games titles is often lengthy, and thus so are timescales for return on investments. Companies entering the market must therefore endure substantial start-up costs.”30 Subsequently then, once significant amounts of proprietary knowledge is developed (software coding), established companies have tremendous competitive advantages in terms of using that knowledge in developing better game titles31, thus significantly reducing costs even further. Despite these negative trends, start-ups can be very successful if they develop innovate branding and game titles which is then readily accepted by consumers (low switching costs). Thus, barriers to entry in this case can be described as low to moderate, depending on how new entrants move to consolidate its position in the market. 2.5.4 Threat of Substitute Products & Services – (Moderate) The presence of varied substitutes in the interactive gaming industry lowers its overall profitability, and unless an entity can distinguish itself through performance and a unique competitive advantage, it may have trouble surviving. Some of the substitutes that exist in this industry are other forms of entertainment such as music, film, live events, and participation in sports. Despite the existing forms of substitutes, the gaming industry enjoys “a strong, captive audience and although indirect competition from other entertainment forms are apparent, they pose modest threat to games market revenues.”32 However, in the future environmental trends and political pressures can act as a deterrent for new entrants to remain competitive within this industry. Thus, existing players in this industry can mitigate the threats somewhat by establishing a strong brand presence, viable competitive advantage through its strengths, and carving out a unique niche for itself. 2.5.5 Competitive Rivalry – (High) The rivalry in the interactive games industry can be described as very “strong and a zero sum game”33. This is because of developmental costs that are quite “high and many titles often make little profit, with development companies relying upon blockbuster hits for a substantial revenue stream.”34 In addition, production of software titles is “minimal (economies of scale process) compared to total development costs and therefore the cost of capacity increases is also minimal, which has the effect of enabling intensified competition.”35 Although exit barriers remain moderate, most competitors in this industry 29 Ibid 30 Ibid 31 Ibid 32 Ibid 33 Ibid 34 Ibid 35 Ibid Page 11 of 44
- 12. are of similar size in terms of market share, and committed to having a focused strategy that is dependent on minute diversification36, which results in greater magnitude of rivalry. 2.5.6 Overall Attractiveness of the Industry Although the interactive gaming industry is characterized as having high degree of competition, high buyer power, relatively favourable competitive trends relating to low to moderate threat of entrants, moderate substitutes, and high supplier power. In this way, this industry is somewhat attractive, and the overall attractiveness would be expected to get worse as unfavourable factors such as consolidation of smaller developers, financial viability, and recessionary factors gets played out in the future. Provided that a game developer in this industry is able to mitigate economic factors and buyer power, specifically through implementing a differentiation strategy, it has a tremendous opportunity to stand out amongst the competition. III. Company Analysis: Activision-Blizzard Inc. 3.1 History Activision-Blizzard Inc. is a console game publisher and online involved in “publishing, developing, and distributing interactive entertainment and peripheral products”37 to its consumers around the world. This company “was founded in 1979 by James Levy, along with four former Atari programmers: David Crane, Alan Miller, Bob Whitehead, and Larry Kaplan. The company was incorporated in the state of California and traded in 1979 as the first independent developer and distributor of entertainment software.”38 In the early stages of the company, Activision Inc. “launched a series of multi- million selling Atari 2600 titles, including the Pitfall! Series, Kaboom, and River Raid in the early 1980s and company completed its initial public offering, in 1983.”39 Throughout its 30 year history, Activision Inc. has gone “through bankruptcy and series of alliances and mergers with small development studios before becoming successful.”40 Blizzard’s past history also has been turbulent in terms of having “a number of owners before ending up in the hand of Vivendi in 1998.”41 More recently in December 2007, it was announced that the French owned media conglomerate “Vivendi SA would merge with fellow games developer and publisher Activision-Blizzard in a deal worth USD 36 Ibid 37 Marketline > Activision, Inc. Overview. Retrieved 3/15/2009, 2009, from http://www.marketlineinfo.com.ezproxy.library.dal.ca/library/DisplayContent.aspx?N=4294841253 38Factiva > Activision Blizzard Company Profile. Retrieved 1/18/2009, 2009, from http://global.factiva.com.ezproxy.library.dal.ca/ar/default.aspx 39 Ibid 40 BBC NEWS | technology | video game giants in $18bn merger. Retrieved 3/17/2009, 2009, from http://news.bbc.co.uk/1/hi/technology/7123582.stm 41 Ibid Page 12 of 44
- 13. $18.8 billion.”42 This deal was finally approved by the European Commission in April 2008, and on July 9, 2008, Activision Inc. announced that stockholders had agreed to the merger, as there were no anti-trust issues as a result of this unification.”43 As a result of this merger, “Vivendi has a 52% stake in the company, whereas rest of the shares are held by institutional and private investors and continues to be traded on NASDAQ stock exchange.”44 As part of the merger, “Blizzard will invest $2 billion USD in the new company, while Activision Inc. is putting up $1 billion USD.”45 It is interesting to note that Activision Inc. and Blizzard Entertainment will remain as separate entities for the foreseeable future. While “Blizzard retains its autonomy and corporate leadership (Michael Morhaime is still President of Blizzard, other Vivendi Games divisions such as Sierra Entertainment”46 were closed down shortly after the merger was completed. The CFO of Activision-Blizzard Inc. – Thomas Tippl, has alluded to future layoffs, stating that the company “will exterminate some of our overlap through redundancy – but we will treat people fairly and respectfully in that process."47 3.2 Business Model Activision-Blizzard Inc.’s model is based on combination of selling interactive gaming software and subscription-based online games48. In this way, “the company operates in two business segments: publishing of interactive entertainment software/peripherals and distribution of interactive entertainment software and hardware products.”49 In terms of the publishing segment, that includes the subscription-based “multi-player online role-playing games, or MMORPGs,”50 develops “markets and sales for the various game products both directly, and by licensing through third party publishers. The direct sales channels for Activision-Blizzard Inc. are “discount warehouses, consumer electronics stores, mass-market retailers, and game specialty stores.”51 This particular 42 Ibid 43 EU Greenlights Activision-Vivendi merger. Retrieved 3/17/2009, 2009, from http://www.joystiq.com/2008/04/16/eu-greenlights-activision-vivendi-merger/ 44 Ibid 45 BBC NEWS | technology | video game giants in $18bn merger. Retrieved 3/17/2009, 2009, from http://news.bbc.co.uk/1/hi/technology/7123582.stm 46 INTERVIEW - Thomas Tippl | gaming industry | interview by MCV. Retrieved 3/17/2009, 2009, from http://www.mcvuk.com/interviews/288/INTERVIEW-Thomas-Tippl 47 Ibid 48 Activision– 2008 Annual Report. Retrieved 3/3/2009, 2009, from http://investor.activision.com/annuals.cfm 49 Marketline > Profile > Activision, inc. Retrieved 1/18/2009, 2009, from http://www.marketlineinfo.com.ezproxy.library.dal.ca/library/iProduct_product.aspx?R=36B9F70C-2ED3 416A-BD6A-74E543D87235&s=IDAHAJ1B 50 BBC NEWS | technology | video game giants in $18bn merger. Retrieved 3/17/2009, 2009, from http://news.bbc.co.uk/1/hi/technology/7123582.stm 51 Thomson Research (Investext) – Activision Blizzard Inc. – Financial Analysis. Retrieved 3/12/2009, 2009, from http://research.thomsonib.com/gaportal/ga.asp Page 13 of 44
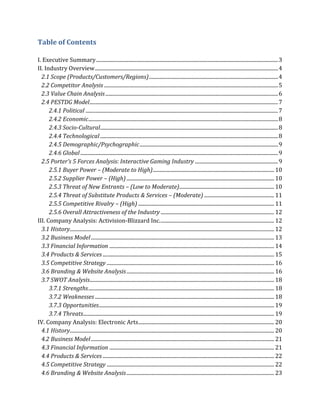
- 14. segment accounted for 80.4% of Activision-Blizzard Inc.’s total revenues in 200852. The distribution segment of Activision-Blizzard is comprised of “providing logistical and sales services to affiliate publishers of entertainment software and manufacturers of entertainment hardware.”53 This particular segment accounted for 19.6% of the company's total revenues.54 3.3 Financial Information The financial position of Activision-Blizzard Inc. can be illustrated by the following diagrams55: Source: Reuters It is interesting to note that most of Activision-Blizzard Inc.’s revenues in terms of geographical regions are generated in North America (60.8%), followed by Europe (35.8%), and Asia-Pacific (3.4%)56. 52 Ibid 53 Ibid 54 Ibid 55 Ibid 56 Activision – 2008 Annual Report. Retrieved 3/3/2009, 2009, from http://investor.activision.com/annuals.cfm Page 14 of 44
- 15. 3500 Revenues & Net Income (Million USD) 3000 2500 2000 1500 Revenue 1000 Net Income 500 0 2004 2005 2006 2007 2008 -500 Year Source: Activision-Blizzard Inc. Annual Report, Investex Report (2008) Analyzing Activision-Blizzard Inc.’s financials over the 2004-2008 period more closely, we can see that it “reported revenues of USD $3,026 million during the fiscal year ended 2008, an increase of 100% over 2007.”57 In addition, “the operating loss of the company was USD $233 million during the fiscal year 2008, a decrease of 418.52% over 2007, and overall net loss of the company was USD $107 million during the fiscal year 2008, a significant decrease of 224.72% over 200758. In comparing the two separate entities, it is interesting note that Activision Inc. as a separate company is much more profitable than when it is combined with Blizzard. This is particularly evident in the Activision Inc. 2008’s “net revenues of $2.9 billion USD, a 92% over the prior year, operating income of $480 million USD, a 558% increase over the prior year, and net income of $345 million, which represents a 302% increase over fiscal 2007.”59 Consequently then, Activision Inc., generated “a GAAP operation margin of 16.5% that exceeded their peak-cycle target range approximately two to three years ahead of plan.”60 (Please refer to Exhibit 4 for a detailed comparison of financial ratios) 3.4 Products & Services Activision-Blizzard Inc. has over the past two years, has become the number one supplier of interactive video game software. This is evident by the fact that “during the fiscal year of 2008, the company had three of the top ten bestselling titles in the U.S. and set an industry record for U.S. sell-through.”61 In addition, “two of the largest franchises, Call of Duty (#1 bestselling PC game title worldwide) and Guitar Hero, both of which surpassed $1 57 Thomson Research (Investext) – Activision Blizzard Inc. – Financial Analysis. Retrieved 3/12/2009, from http://research.thomsonib.com/gaportal/ga.asp 58 Ibid 59 Activision – 2008 Annual Report. Retrieved 3/3/2009, 2009, from http://investor.activision.com/annuals.cfm 60 Ibid 61 Ibid Page 15 of 44
- 16. billion in life-to-date sales during the fiscal year (2007), with Guitar Hero reaching that milestone in a record 26 months.”62 Activision Blizzard Inc.’s portfolio has numerous video game titles “such as Guitar Hero, Call of Duty, and Tony Hawk, as well as Spider-Man, X- Men, Shrek, James Bond and Transformers, and franchises, such as Crash Bandicoot and Spyro and Blizzard Entertainment’s StarCraft, Diablo and WarCraft.”63 3.5 Competitive Strategy As mentioned in the business model section, Activision-Blizzard Inc.’s strategy is primarily based on marketing video gaming software and online based MMORPGs that are subscription-based such as StarCraft, Diablo, and WarCraft. This organization “focuses on diversified categories of games which include action sports, simulation, first-person action, racing, role-playing, action and adventure and music-based gaming.”64 This is particularly evident with its recent acquisition strategy of Bizarre Creations in order to compete in a $1.5 billion USD segment that previously Activision-Blizzard was not competing in, outside of sports65. The reason behind this acquisition was that for many years, it “didn’t have the development capability to put out a top game (to compete with the Need for Speed franchise) and there were not many external options around.”66 In terms of the revenues from gaming platforms through licensing agreements, “82.76% is comprised by console gaming, followed by Handheld which is 10.84%, and PC with 6.39% respectively.”67 3.6 Branding & Website Analysis Brand management in this case is the application of the marketing framework in order to increase brand equity in the consumer’s mind. For Activision-Blizzard, it becomes especially important for the gaming products/procurement services to be positioned in such a way that it becomes the brand of choice for its consumers and be easily distinguished from the competitors in the interactive gaming industry. Thus, integration of an e-commerce strategy with a dynamic website becomes even more important for companies in this industry because of specific factors that relate to strong rivalry, high buyer power, and consolidation trends due to unfavourable economic conditions that exist currently. Visiting the Activision-Blizzard site (see Exhibits 5 to 9), we can see that it is 62 Ibid 63 Marketline > Profile > Activision, inc. Retrieved 1/18/2009, 2009, from http://www.marketlineinfo.com.ezproxy.library.dal.ca/library/iProduct_product.aspx?R=36B9F70C-2ED3- 416A-BD6A-74E543D87235&s=IDAHAJ1B 64 Thomson Research (Investext) – Activision Blizzard Inc. – Financial Analysis. Retrieved 3/12/2009, from http://research.thomsonib.com/gaportal/ga.asp 65 INTERVIEW - Thomas Tippl | gaming industry | interview by MCV. Retrieved 3/17/2009, from http://www.mcvuk.com/interviews/288/INTERVIEW-Thomas-Tippl 66 Ibid 67 Thomson Research (Investext) – Activision Blizzard Inc. – Financial Analysis. Retrieved 3/12/2009, from http://research.thomsonib.com/gaportal/ga.asp Page 16 of 44
- 17. separated into two different entities, with each developer having different categories of games. In measuring how well these websites are designed, a list of common website metrics was devised and websites were compared as follows: Website Metrics Activision Inc. Blizzard Inc.68 Visitor Traffic Rank & (based on 14,680 (Average of 1 week) 1,690 (Average of 1 week) all page views and reach) Exposure Page Views + U.S. users rank #1 with 29.9% + U.S. users rank #1 with 33.6% + German users rank #2 with 6.1% + German users rank #2 with 8.7% Visit Stickiness + 1.79 (Decrease of 7% over last three + 2.58 (Decrease of 5.8% over last months) three months) + Seems to be less sticky; too many gadgets + Seems to have more stickiness; and videos slowing down the speed at which artistic and niche based game titles; no all the elements load on all the pages animated flash elements (much faster + Users are not tracked and asked for loading times) information when buying products + Users are tracked and information is asked when buying products Raw Visits + 3 month average of 0.01% of all internet + 3 month average of 0.0578% of all users in the world internet users in the world. Hits Overall Ranking + Ranked 24/65 competitors in the interactive + Ranked 4/65 competitors in the (Searches) gaming industry interactive gaming industry Ranking by Pages Activision.com - 91.0% blizzard.com - 54.3% Investor.activision.com - 3.0% eu.blizzard.com - 25.8% Devtrackbeenox.activision.com - 2.4% us.blizzard.com - 15.1% Kronos.activision.com - 1.3% ftp.blizzard.com - 2.8% De.activision.com - 0.8% kr.blizzard.com - 0.8% Games.activision.com - 0.8% mobile.blizzard.com - 0.8% Gownload.activision.com - 0.7% download.blizzard.com - 0.1% Source: Activision.com - traffic details from Alexa. Retrieved 3/17/2009, 2009, from http://www.alexa.com/data/details/traffic_details/activision.com 68Activision.com - traffic details from Alexa. Retrieved 3/17/2009, 2009, from http://www.alexa.com/data/details/traffic_details/blizzard.com Page 17 of 44
- 18. 3.7 SWOT Analysis SWOT analysis for Activision-Blizzard Inc.’s can be summarized in the following manner: Strengths Weaknesses Good market position globally Lack of competitive strength in some market Diversification of innovative gaming products segments and services Over-reliance on limited game software titles Weak financial performance after the merger with Vivendi games Opportunities Threats Acquisition of new subscribers – online Piracy gamers from the Asia-Pacific region Intellectual property capabilities (lack of Room for consolidation through strategic competitive advantage) with the rise in acquisitions of smaller game development popularity of third party developers firms Unfavourable economic factors Growing demand for in-home entertainment Overall Market Riskiness due to changing consumer preferences (availability of downloadable content) 3.7.1 Strengths Activision-Blizzard Inc. enjoys a prominent position in terms of being the “world’s leading player in the multiplayer online role-playing games category.”69 In addition, the parent company, Vivendi S.A. is in a strong financial position, and diversified in terms of the kinds of entertainment businesses (mobile phones, film production, television entertainment, and video game entertainment70) it is involved in. 3.7.2 Weaknesses Activision-Blizzard Inc. has some weaknesses in terms of not being competitive in some market segments – mainly sports gaming and acquiring licensing for their movie entertainment business. In addition, there is too much reliance on a few hits (Call for Duty and Guitar Hero) for generation of significant percentage of its revenues. It is interesting to observe that Activision Inc. was in a much better financial position before the merger occurred with Vivendi Games (see financial section of the report for details). 69 Marketline > Profile > Vivendi S.A. Retrieved 3/10/2009, 2009, from http://www.marketlineinfo.com.ezproxy.library.dal.ca/library/iProduct_toc.aspx?R=EEA43AE4-13C5-492C 8768-D27186836EA1&N=4294834008 70 Ibid Page 18 of 44
- 19. 3.7.3 Opportunities There are lots of opportunities for Activision-Blizzard to solidify its market share in continuing to acquire smaller gaming studios (diversify in other game categories). In addition, the “global video games market is forecast to reach $45 billion in 2010, and in the developing markets, the online game market is forecast to be driven by increased penetration of the broadband.”71 Another major opportunity for Activision-Blizzard Inc. is the potential to acquire subscribers” in the Asia Pacific region, where online games became the second-largest category, passing the PC games, and are expected to grow by 23% compounded annually, reaching $4.4 billion in 2010.”72 In this case, Activision-Blizzard can pursue opportunities in expanding its content for downloading, improve efficiencies in online gaming through development of Internet gaming. In essence, following these opportunities could have a great impact on improving Activision-Blizzard’s overall market share and financial viability in the future. 3.7.4 Threats Despite promising opportunities in this market, there are lots of threats facing the players in this industry in terms of increasing piracy, development of intellectual property, and high market riskiness due to eroding margins. Increasingly, intellectual property is being pirated by the means of file sharing networks, and illegal modifications to consoles to facilitate pirated software. According to the IPFI agency, “CD and cassette pirate sales have declined in 2006 and the trend has shifted towards digital, private copying, and development of innovate software by third party developers.”73 In this case, the number of infringing illegal files being pirated on the Internet is estimated to be around $1 billion USD74. Another substantial threat to this industry is relating to global economic slowdown due to recessionary factors. The “recent turmoil in financial markets, very weak housing market indicators and decrease in consumer disposal income,”75 and lower consumer demand has led to negative consequences for all the players in the industry to remain financially viable in the long term. 71 Ibid 72 Ibid 73 Ibid 74 Ibid 75 Ibid Page 19 of 44
- 20. IV. Company Analysis: Electronic Arts 4.1 History Electronic Arts Inc. (EA) is the leading interactive entertainment software company. This company “develops, publishes, and distributes interactive software worldwide for videogame systems, personal computers, cellular handsets and the internet.” 76 Electronic Arts was officially incorporated in 1982 by Trip Hawkins77, and “in 1998, EA bought Westwood Studios for $122 million. In the following year, the company established EA.com, an Internet division to develop games for online players. It also agreed to pay America Online (now a part of Time Warner) about $80 million to operate AOL's game channel.”78 EA started off as a small computer game publisher, and “in the late 1980s, the company began developing games in-house and supported consoles by the early 1990s. EA later grew via acquisition of several successful developers. By the early 2000s, EA had become one of the world's largest third-party publishers.”79 In September 2008, EA Mobile announced a list of nine games that includes Spore Origins, a game for the iPhone and iPod touch.”80 More recently, EA has been involved in series of anti-trust issues relating to licensing agreements with the NFL and intellectual property protection (EULA agreements)81 that resulted in substantial damage to the corporate brand image of Electronic Arts. In February 2008, “Electronic Arts had made a public takeover bid for rival game company Take-Two Interactive, for revised price of $26 per share, which represented a 64% premium over the previous day's closing price.” The reason behind this aggressive action by EA was that there were “rumours had been floating around the internet prior to the offer about Take-Two possibly being bought over by a bigger company, albeit with Viacom as the potential bidder.” However, in September 2008, the buyout offer for Take- Two entertainment was withdrawn by EA, and no reason was given82. 76 Marketline > Profile > Electronic Arts. Retrieved 1/18/2009, 2009, from http://www.marketlineinfo.com.ezproxy.library.dal.ca/library/iProduct_product.aspx?R=E9821E9D-293D 4412 AA7F-C16950961D78&s=IDAGMRNB 77 Ibid 78 Factiva > Electronic Arts Company Profile. Retrieved 3/15/2009, 2009, from http://global.factiva.com.ezproxy.library.dal.ca/ar/default.aspx 79 Electronic Arts - Wikipedia, the free encyclopaedia. Retrieved 3/15/2009, 2009, from http://en.wikipedia.org/wiki/Electronic_arts 80 Ibid 81 Ibid 82 Ibid Page 20 of 44
- 21. 4.2 Business Model EA’s business model is based on transaction based model where it is actively “engaged in developing, publishing and distributing video game software for advanced console systems, casual web-based games and games for mobile phone devices.”83 In this way, EA has been pretty aggressive in responding to competitors trying to take away market share from its sport franchises by entering into “series of exclusive licensing agreements with the NFL, NHL, Collegiate sports, and ESPN which gave EA exclusive first rights to all ESPN content for sports simulation games.”84 Thus, “much of EA's success, both in terms of sales and with regards to its stock market valuation, is due to its strategy of platform-agnostic development and the creation of strong multi-year franchises. EA was the first publisher to release yearly updates of its sports franchises—Madden, FIFA, NHL, NBA Live, Tiger Woods, etc.—with updated player rosters and small graphical and game play tweaks.”85 Only recently in 2006, EA recognized that this strategy had run its course and in “midst of facing increasing threats of franchise fatigue among consumers, it announced that it would concentrate more of its efforts on creating new original intellectual property.”86 4.3 Financial Information The financial position of EA can be illustrated by the following diagram87: Source: Reuters 83 Ibid 84 Ibid 85 New challenges // report. Retrieved 3/17/2009, 2009, from http://www.gamesindustry.biz/articles/new challenges 86 Ibid 87 Factiva > Electronic Arts Company Profile. Retrieved 3/15/2009, 2009, from http://global.factiva.com.ezproxy.library.dal.ca/ar/default.aspx Page 21 of 44
- 22. Analyzing EA’s financials more closely over the 2004-2008, we can see that it reported revenues of “USD $3,665 million during the fiscal year ended 2008, an increase of 18.57% over 2007.”88 However, the operating loss of the company was USD $487 million during the fiscal year 2008, a decrease of 1,348.72% over 200789, and the net loss for this company was USD $454 million during the fiscal year 2008, a increase of 697.37% over 200790. (Please refer to Exhibit 10 for a detailed comparison of financial ratios) 4.4 Products & Services In essence, EA’s core business occurs in “seven segments: EA Games, EA SPORTS, The Sims, POGO, EA Mobile, Hasbro and Casual Entertainment. Due to their similar economic characteristics, products and distribution methods; EA Games, EA SPORTS, The Sims, POGO, Hasbro and Casual Entertainment’s results are aggregated into one reportable segment which is named as the ‘Label segment’.”91 In this way, the flagship brands also include Hollywood franchises including “The Lord of the Rings, The Godfather, Harry Potter, and Batman.”92 However, recently, “EA's aggregate review performance had shown a downward trend in quality over recent years and was expected to affect market shares during competitive seasons.”93 According to the Evan Wilson, who is a Pacific Crest Securities Analyst, “poor reviews and quality are beginning to tarnish the EA brand. According to our ongoing survey of GameRankings.com aggregated review data, Electronic Arts' overall game quality continues to fall...Although market share has not declined dramatically to date, in years such as 2007, which promises to have tremendous competition, it seems likely if quality does not improve.”94 4.5 Competitive Strategy EA’s strategy is primarily based on “geographical performance which combined global publishing organizations represented as one reportable segment, namely publishing, because of their similar economic characteristics, products and distribution methods.”95 In this way, “publishing refers to the manufacturing, marketing, advertising and distribution of products developed, or distribution of certain third-party publishers’ products through 88 Thomson Research (Investext) – Electronic Arts Company Report. Retrieved 3/4/2009, 2009, from http://research.thomsonib.com/gaportal/ga.asp 89 Ibid 90 Ibid 91 Ibid 92 Factiva > Electronic Arts Company Profile. Retrieved 3/15/2009, 2009, from http://global.factiva.com.ezproxy.library.dal.ca/ar/default.aspx 93 Reimer, Jeremy (2006), EA brand “tarnished” according to analyst – Arts Technica, Retrieved 3/15/2009, 2009, from http://arstechnica.com/gaming/news/2006/12/8339.ars 94 Ibid 95 Factiva > Electronic Arts Company Profile. Retrieved 3/15/2009, 2009, from http://global.factiva.com.ezproxy.library.dal.ca/ar/default.aspx Page 22 of 44
- 23. its co-publishing and distribution Program.”96 More recently in 2007, EA had restructured its organization into four publishing labels, and implemented a city-state strategic model. The implications of this will be discussed later in this report in the branding and strategic implications section for EA. 4.6 Branding & Website Analysis Management of brands for EA in essence, is the number one priority for it to position itself as the brand in the consumer’s mind. As mentioned earlier, assimilation of an e-commerce model with a vibrant website becomes even more important for players in this industry because of factors that relate to strong rivalry, high buyer power, and consolidation trends due to unfavourable economic conditions that exist currently. It is interesting to know then how EA perceives its global customers with its development of customizable content (different game titles and genres for each of the regions) for each of the regions it operates in – North America/Latin America, Europe, Asia Pacific/Oceania, and Africa (see Exhibits 11 to 13). In measuring how well these websites are designed, a list of common website metrics was devised and websites were compared as follows: Website Metrics97 Electronic Arts Visitor Traffic Rank & (based on all page 789 (Average of 1 week) views and reach) Exposure Page Views + U.S. users rank #1 with 41.2% + U.K. users rank #2 with 3.9 % Visit Stickiness + 4.46 (Increase of 7.1% over last three months) + Seems to be very sticky; good combination of flash animation and static images (customized local content) + Users are tracked and asked for information when buying products Raw Visits + 3 month average of 0.1147 % of all internet users in the world Hits Overall Ranking (Searches) + Ranked 3/65 competitors in the interactive gaming industry Ranking by Pages thesims2.ea.com - 29.4% ea.com - 10.0% eastore.ea.com - 7.7% thesims2store.ea.com - 4.8% thesims3.ea.com - 4.7% lossims.ea.com - 4.6% fun.ea.com - 2.9% 96Ibid 97Source: Activision.com - traffic details from Alexa. Retrieved 3/17/2009, 2009, from http://www.alexa.com/data/details/traffic_details/ea.com Page 23 of 44
- 24. 4.7 SWOT Analysis SWOT analysis for EA can be summarized in the following manner: Strengths Weaknesses Strong global presence and popularity of Declining operating profit margins game franchises Too dependent on licensing agreements Fairly strong financials Employee morale and productivity Strong R&D (Acquisition of Bio-Ware and Limited diversification – singular game engine Pandemic Studio)98 platform and manufacturing99 Opportunities Threats Growing demand of entertainment industry Piracy & unauthorized file sharing (changing consumer demands)100 Very competitive and market driven by small Strategic acquisition of smaller developers percentage of hit game titles Growing demand for online services Overall market risk (delays in development of new hardware systems) Intellectual property licensing101 4.7.1 Strengths EA Inc. has become “the market leader in the video game publishing market and was ranked second among the Game Developer Magazine’s Annual Top 20 Publishers for the years 2007 and 2008.”102 In addition, it has quickly retained higher market share “with total revenues of $3,665 million in the FY 2008, achieved through strong sales of Rock Band, Madden NFL 08, FIFA 08, Need for Speed ProStreet, and The Simpsons Game. In this way, the company was ahead of its rivals like Activision, Ubisoft, Sony, Take-Two and Sega.”103 In terms of global presence, EA increased its net revenues internationally “by 21 percent increased by 21 percent to $1.723 billion, or 47 percent of total net revenue in fiscal 2008, compared to $1.425 billion, or 46 percent of total net revenue in fiscal 2007.”104 Another strength for EA is that it has consistently increased its spending in R&D over the past three years (investments represent 31.2% (2008) , 33.7% (2007) and 25.7% (2006) of its total revenues)105 It is interesting to note that EA’s “R&D investment as a 98 Thomson Research (Investext) – Electronic Arts Company Report. Retrieved 3/4/2009, 2009, from http://research.thomsonib.com/gaportal/ga.asp 99 Ibid 100 Marketline > Profile > Electronic Arts. Retrieved 1/18/2009, 2009, from http://www.marketlineinfo.com.ezproxy.library.dal.ca/library/iProduct_product.aspx?R=E9821E9D-293D 4412 AA7F-C16950961D78&s=IDAGMRNB 101 Ibid 102 Ibid 103 Ibid 104 Thomson Research (Investext) – Electronic Arts Company Report. Retrieved 3/4/2009, 2009, from http://research.thomsonib.com/gaportal/ga.asp 105 Marketline > Profile > Electronic Arts. Retrieved 1/18/2009, 2009, from http://www.marketlineinfo.com.ezproxy.library.dal.ca/library/iProduct_product.aspx?R=E9821E9D-293D- 4412 AA7F-C16950961D78&s=IDAGMRNB Page 24 of 44
- 25. percentage of sales is one of the highest in the industry.”106 This notion is particularly evident when comparing EA’s R&D figures to its competitors – Take-Two Interactive investments represent“6.1% (2005), 6.2% (2006), and 5%(2007) of its total revenues,”107 while Activision-Blizzard investments represent “9% (2005), 8.8% (2006), and 9.3% (2007) of its total revenues.”108 Thus, EA’s strong investments in R&D has “helped it launch products much faster on a consistent basis,”109 and resulted in greater revenue growth. 4.7.2 Weaknesses EA has some weaknesses in terms of declining profit margins, dependency on licensing agreements, lack of productivity and contribution by employees, and limited diversification in having a single game engine platform for development of game titles. In recent years, EA has recorded declining “net profit margins from 12.8% in 2003 to 2.5% in 2007, and negative operating margin of 12.4% in FY 2008.”110 Another weakness that EA has that it is very dependent on licensing agreements and manufacturers. In this way, “the video game hardware manufacturers set the royalty rates and other fees that it must pay to publish games for their platforms, and therefore have significant influence on its ability to extract significant revenues.”111 Thus if EA “is unable to maintain or acquire licenses to intellectual property, it will publish fewer hit titles and its revenues will decline and competition for these licenses may make them more expensive and reduce its profitability.”112 Another weakness that exists for EA is with respect to employee productivity (see Exhibit 10 in examining the negative return on capital) and the use of single game engine in manufacturing of its games. In comparing the quality levels of games, EA’s PC-games are lower than its competitors, and “none of the company’s products were ranked among the top three quality products in any of the three categories (MMO, RTS, and RPG), while Activision-Blizzard had ranked number one in all three categories.”113 In comparing the average quality rating, Activision-Blizzard’s rating “on all releases is over 90%, while EA is setting a standard of 80% quality scores to be achieved on its core titles by 2011.”114 Thus, continued reliance in developing games on a single game engine would negatively affect EA’s operating performance in the near future. 106 Ibid 107 Ibid 108 Ibid 109 Ibid 110 Ibid 111 Thomson Research (Investext) – Electronic Arts Company Report. Retrieved 3/4/2009, 2009, from http://research.thomsonib.com/gaportal/ga.asp 112 Ibid 113 Marketline > Profile > Electronic Arts. Retrieved 1/18/2009, 2009, from http://www.marketlineinfo.com.ezproxy.library.dal.ca/library/iProduct_product.aspx?R=E9821E9D-293D- 4412 AA7F-C16950961D78&s=IDAGMRNB 114 Ibid Page 25 of 44
- 26. 4.7.3 Opportunities EA has some opportunities that it can take a look at in order to solidify its place in the interactive game industry. In some ways, EA can continue to acquire smaller studios in order to diversify its gaming titles in other titles. For instance, EA recently acquired “BioWare and Pandemic Studio which create action, adventure, and role-playing games, and brought about 10 new intellectual properties.”115 Subsequently then, EA can continue to target smaller developers that will bring it increase its online direct-to-consumer presence. In this way, “Strategic acquisitions add new teams and intellectual properties, which provide the company a chance to further strength its global publishing infrastructure.”116 Another opportunity for EA is with respect to increasing demand for online gaming and downloadable content. According to “research estimates by Ovum, the online games revenue is forecast to reach $14 billion in 2011”117 that represents a 75% increase from 2008. This notion coupled with the faced that internet usage is increasing, can allow EA “to increase its revenues from direct-to-consumer sales and online advertising.”118 Moreover, consumers are consuming more interactive entertainment than ever, which results in significantly changing spending habits over the last decade. Related to this notion is the fact that demographics of gaming have also been rapidly changing, where “the average age of gamers in the US was 35 years in mid 2008, with about 40% of them being women and this continues to rise owing to the increasing number of players aged over 50 years, which was about 25% in mid-2008.”119 For EA, continued development of gaming architecture and mobile platforms represents two significant areas of sustainable revenue growth in the near future. 4.7.4 Threats Despite promising opportunities in this market, similar threats are faced by EA as Activision-Blizzard in terms of piracy, development of intellectual property, and high market riskiness due to eroding margins and exchange rate fluctuations. In essence, significant portion of EA’s financial performance is heavily dependent on delivering ‘hit’ gaming titles that have significant amounts of risk associated with it in terms of developmental costs (operating costs have been increasing from 98.7% in 2007 to 113.3% in 2008120). Thus, these factors represent a huge risk for EA “if its competitors develop more successful products or services, offer competitive products or services at lower price points or based on payment models perceived as offering a better value proposition (such 115 Ibid 116 Ibid 117 Ibid 118 Ibid 119 Ibid 120 See Exhibit 10 – EA Financials Page 26 of 44
- 27. as pay-for-play or subscription-based models).”121 Therefore, EA needs to mitigate these threats by continuing “to develop consistently high-quality and well received products and services, its revenue, margins, and profitability will decline.”122 V. Comparison of the 2 Companies: Activision-Blizzard Inc. & EA Inc. 5.1 Summary of Findings In comparing Activision-Blizzard and Electronic Arts against selected financial, qualitative, and quantitative criteria (See Exhibit 1), we can see that currently Electronic Arts is more successful in terms of generating higher revenues, having a greater market share, availability of product selection, value added services, e-commerce capabilities, and value for money. These aspects can be illustrated further by the market share chart in 2006: Electronic Arts 20% Konami Other 10% 52% Take 2 Interactive 9% Activision- Blizzard 9% Source: Datamonitor123 Despite this, Activision-Blizzard Inc. has over the past 2 years, caught up considerably in terms of gaining market share, improving their product selection, e-commerce capabilities, and reducing operating costs which were lower than EA in fiscal year end 2008 (107.7% for Activision-Blizzard versus 113.3% for EA). More recently in March 2009, Activision- Blizzard has been concentrating on increasing operating income margins in excess of 25%124. In comparison, “EA’s operating margins based on their guidance for the fiscal year March 2009 are at 12%”125. Therefore, this represents a considerable gap that Activision has been able to achieve in surpassing EA as the largest game publishing developer after its acquisition of Blizzard Inc. in 2008. In this way, Activision-Blizzard is in a better 121 Thomson Research (Investext) – Electronic Arts Company Report. Retrieved 3/4/2009, 2009, from http://research.thomsonib.com/gaportal/ga.asp 122 Ibid 123 Marketline > Industry profiles (Gaming Software). Retrieved 3/10/2009, 2009, from http://www.marketlineinfo.com.ezproxy.library.dal.ca/library/DisplayContent.aspx?N=210+4294853461 124 INTERVIEW - Thomas Tippl | gaming industry | interview by MCV. Retrieved 3/17/2009, 2009, from http://www.mcvuk.com/interviews/288/INTERVIEW-Thomas-Tippl 125 Ibid Page 27 of 44
- 28. competitive position for future growth and increased profitability because of its diversified business model, strong manufacturing architecture, and less dependence on licensing agreements as a major source of generating revenues. 5.2 Financial Information Comparison Comparison of Activision-Blizzard and EA Inc.’s financial position can be illustrated by the following diagrams: 4000 Revenues & Net Income (Million USD) 3500 3000 2500 2000 ATVI Revenue 1500 ATVI Net Income 1000 EA Revenue 500 EA Net Income 0 -500 2004 2005 2006 2007 2008 -1000 Year Source: Annual Reports for Activision-Blizzard and EA Inc., Investex Report (2008) ATVI Stock Performance over the past year (May 2008- March 2009) EA Stock Performance over the past year (May 2008- March 2009) Source: Quotes for ATVI - Yahoo! Canada - share prices, charts, news and more. Retrieved 4/10/2009, 2009, from http://ca.finance.yahoo.com/q/bc?s=ATVI&t=1y&l=on&z=l&q=l&c=ERTS Page 28 of 44
- 29. In analyzing the diagrams on the previous page, we can clearly see that Activision- Blizzard has been outperforming Electronic Arts over the past year in terms of stock performance, and generating lower negative profits (-$107 million for Activision-Blizzard versus -$454 million loss for Electronic Arts in 2008). The reasons why both of these firms lost money is because of the extremely high development costs of gaming titles which did not sell as well due to numerous reasons relating to increased piracy, delays in product development, competitive nature of the gaming industry, and decreased ROI for development of newer gaming architecture for mobile and social networking platforms. 5.3 Website Analysis In comparing the website design and e-commerce operations of Activision-Blizzard and EA Inc. (See Exhibits 5-9 and 11-13) different metrics were analyzed such as: visitor, exposure, stickiness, and hits. These aspects can be further illustrated by the following graphs: Average Stay in Seconds Pages Per Visit 700 16 600 14 Number of Pages 500 12 10 Seconds 400 Activision.com 8 Activision 300 6 200 Blizzard.com Blizzard 4 100 EA.com 2 EA 0 0 Mar-08 Jan-09 Mar-09 May-08 Jul-08 Sep-08 Nov-08 Unique Visitors 2500000 Unique Visitors (millions) 2000000 1500000 1000000 Activision-Blizzard EA 500000 0 Apr-08 May-08 Jul-08 Aug-08 Sep-08 Nov-08 Feb-09 Dec-08 Mar-08 Jun-08 Oct-08 Jan-09 Mar-09 Source: SnapShot of activision.com (rank #11,894), blizzard.com (#2,619), ea.com (#835) - compete. Retrieved 4/10/2009, 2009, from http://siteanalytics.compete.com/activision.com+blizzard.com+ea.com/?metric=uv Page 29 of 44
- 30. Overall, EA has a better designed website in terms of overall customizability (based on where the person is located), stickiness, and inclusion of a community forum, content, and ease of use). Activision’s site in comparison is very graphics heavy, too many flash objects embedded, and very hard to get around. Blizzard website is much more artistic, has an integrated community forum, and easier to get around. In this way, Blizzard does a better job in integrating the online community where gamers can discuss the games, give tips, ratings, and suggestions for future game titles. In comparing the e-commerce capabilities for Activision-Blizzard and EA Inc. (See Exhibits 7, 9, and 13), it is much easier for a user to buy a game either by digitally downloading it onto a hard drive or by mail on the Activision site as you do not have to register when buying a game, and the number of click throughs is a lot fewer than buying a game on the Blizzard website. On both of the Blizzard and EA website, the user has to register with their full details in order to buy or download the game from a secure server, which inevitably increases the number of clicks before he or she receives the product of their choice. Over the past 6 months, EA has begun to integrate its online forum and make it a larger presence on its website, but users still do not feel that EA has done enough in incorporating their suggestions to improve their overall experience of the gaming titles that EA has produced. To a certain extent, the discussion that takes place on these online forums and other gaming websites such as IGN.com or Gamespy.com, does influence the buyer behaviour in which games that they buy based upon popularity, overall ratings, and what other people and experts have said about the gaming experience of certain gaming titles. 5.4 Branding & Strategic Implications Management of brands for both of these companies is the number one priority in positioning itself as being the brand for the potential consumer. As mentioned earlier, assimilation of an e-commerce model with a unique website becomes even more important for players in this industry because of factors that relate to strong rivalry, high buyer power, and consolidation trends due to unfavourable economic conditions that exist currently. In comparing the business models, Activision-Blizzard’s subscription model can become even more successful in the future because of the potential growth of subscription- based online gamers in the Asia-Pacific region – 23% compounding growth as compared to 4.0% growth of gamers in North America126). In order for EA to be financial viable in the future, it has to continue to develop its gaming architecture, restructure its labels further, divest its worst selling gaming titles, and continue to develop games for mobile platforms. Recently in 2007, the new CEO John Riccitiello had restructured EA into four labels, “each with responsibility for its own 126 Marketline > Profile > Vivendi S.A. Retrieved 3/10/2009, 2009, from http://www.marketlineinfo.com.ezproxy.library.dal.ca/library/iProduct_toc.aspx?R=EEA43AE4-13C5-492C- 8768-D27186836EA1&N=4294834008 Page 30 of 44
- 31. product development and publishing (the city-state model).”127 The objective behind this reengineering initiative “was to empower the labels to operate more autonomously, streamline decision-making, increase creativity and quality, and get games into the market faster.”128 It is very interesting to note that Riccitiello has said that EA’s previous strategy of acquiring smaller game developers “was a mistake, as it strips smaller studios of its creative talent.”129 In this way, implementation of the city-state model would allow “independent developers to remain autonomous to a large extent, and cited Maxis and Bioware as examples of studios thriving under the new structure.”130 VI. Recommendations 6.1 Strategic Options Analysis: Activision-Blizzard Inc. My recommendations for Activision-Blizzard are: Concentrate on acquiring smaller gaming studios and diversify in other game categories such as sports and strategy gaming genres in which Activision-Blizzard does not have a strong presence in Increase downloadable content (patches, game updates, customizable content, etc.) offered through Xbox Live, Playstation 3, Nintendo Wii, and mobile platforms. Expanding its subscription base in the Asia-Pacific region, where it is expected to grow by 23% compounded annually, reaching $4.4 billion in 2010131 Develop IP (Intellectual property) further through licensing agreements and third party developers of open source games that would mitigate some of risks associated with piracy Following these opportunities should have a great impact on improving Activision- Blizzard’s overall market share and financial viability in the future. 6.2 Strategic Options Analysis: Electronic Arts My recommendations for Electronic Arts are: Mitigate piracy risk through further development of open source gaming for mobile and social networking platforms Fast track the development of new game architecture 127 Gamasutra - news - EA announces new company structure. Retrieved 4/10/2009, 2009, from http://www.gamasutra.com/php-bin/news_index.php?story=14374 128 Ibid 129 EA's CEO: How I learned to acquire developers and not screw them up | game | life from wired.com. Retrieved 4/10/2009, 2009, from http://blog.wired.com/games/2008/02/riccitiello.html 130 Ibid 131 Marketline > Profile > Vivendi S.A. Retrieved 3/10/2009, 2009, from http://www.marketlineinfo.com.ezproxy.library.dal.ca/library/iProduct_toc.aspx?R=EEA43AE4-13C5-492C- 8768-D27186836EA1&N=4294834008 Page 31 of 44
- 32. Divest its worst game titles to improve overall development costs and mitigate risks associate with development of games Continue to target smaller third party developers and decentralize its operations – “Strategic acquisitions add new teams and intellectual properties, which provide the company a chance to further strength its global publishing infrastructure.”132 Develop gaming titles that appeal to women as the demographics are changing, “with about 40% of them being women and this continues to rise owing to the increasing number of players aged over 50 years, which was about 25% in mid-2008.”133 Expansion of its online services through Xbox Live, Nintendo Wii, Playstation 3 by increasing the amount of downloadable content – game updates, patches, customizable content, etc. For EA, continued development of gaming architecture and mobile platforms represents two significant areas of sustainable revenue growth in the near future. 6.3 #1 Priority for the CEO in Activision-Blizzard Inc. If I was the CEO of Activision-Blizzard, my #1 priority would be to continue to acquire smaller third-party developers, diversify into other genres, and expand online subscription based gaming, which represents strong core competencies for Activision- Blizzard Inc. 6.4 #1 Priority for the CEO in Electronic Arts If I was the CEO of Electronic Arts, my #1 priority on my to do list would be improving employee contribution and productivity through further restructuring of developer studios, push the development of new gaming architecture onto game console manufacturers, address the importance of bringing efficiencies in the development process of games (lowering costs), and form strategic alliances with movie studios in developing gaming titles for various platforms – consoles, mobile, and social networking websites. If I was investing in each of the companies, I would put more capital in the third party developers that are producing hit gaming titles and successful mobile games for each of these firms. Having said that, however, I have much more confidence investing in Activision-Blizzard Inc. because its subscription based business model, and it can be more successful in the future if it continues building on its core competencies and invests in the opportunities that exist in the interactive game industry. 132 Ibid 133 Ibid Page 32 of 44