1. TECHNOLOGY
REPORT
Proving the Value of SD-WAN
Customer Proof-of-Concept Data Illustrates the
Benefits of WAN Virtualization
13755 1st Avenue North, Plymouth, MN 55441 | www.ecessa.com
toll free: 1.800.669.6242 | 763.694.9949
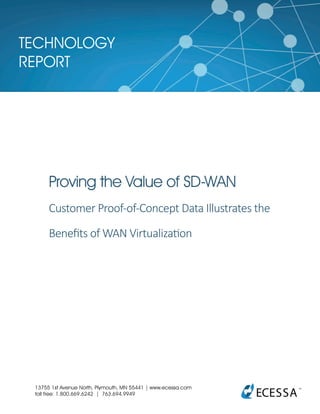
2. Ecessa WAN Virtualization Average Performance Improvement
60 days post implementation
5
PACKET LATENCY IMPROVEMENT
PACKET LOSS IMPROVEMENT
89%
95%
PACKET REORDERING IMPROVEMENT
100%
0
OUTAGES AVOIDED
(over 90 seconds)
FAILOVER DELAY
(seconds)
The word optimization is defined as “an act, process, or methodology of making something as fully perfect,
functional, or effective as possible.”
When it comes to networks, much of what we do can’t be seen, but it can be measured. And despite its flashy
name, the data shows that WAN Optimization is less than a perfect solution. Today, “as fully functional or effective
as possible” isn’t enough of a promise for your organization’s network uptime and usability.
What can improve your network’s performance in a more sustainable and cost saving way? WAN Optimization’s
friend—or enemy, depending on your own point-of-view—SD-WAN.
Known interchangeably as WAN Virtualization and Software Defined Networking, SD-WAN offers significant
improvements over WAN Optimization alone.
At Ecessa, we help organizations complete live Proof of Concept (PoC) deployments so they can see the
return on investment of a virtualized WAN before they commit to a full investment. We’ve completed PoCs for
industry leading organizations in retail, hospitality, industrial, finance, healthcare and more.
Based on real customer data over a 60 day period, SD-WAN has driven the following network performance
improvements in the areas of packet latency, packet loss, packet reordering, number of outages that occurred
which were avoided, and the delay time to failover to another WAN link.
60-day measurement of network performance improvements driven by WAN Virtualization
WAN Virtualization allows for multiple WAN connections to replace the traditional individual private WAN
connection, aggregating bandwidth and duplicating traffic, allowing the links to work continuously. It enables
software defined control of WANs, and is a must-have feature that compliments WAN Optimization.
Driving Network Performance Improvements
13755 1st Avenue North, Plymouth, MN 55441 | www.ecessa.com
toll free: 1.800.669.6242 | 763.694.9949
3. When Optimization Isn’t Enough
When Optimization Isn’t Enough
WAN Virtualization gives millisecond-level management to multiple WAN connections that guarantee businesses
do not have outages, experience degraded performance or pay too much for connectivity.
When Optimization Isn’t Enough
A leading premium grocer provides a great example of a situation where WAN Optimization is not enough. The
regional retail chain needed more bandwidth, and more reliable bandwidth; WAN Virtualization optimizes their
solution. Before we started the SD-WAN effort, they experienced frequent outages, dropped VoIP calls, missed
credit card transactions and had to regularly deploy late night changes and emergency patches. Today they’ve been
up and running without incident for several months, a significant improvement over their previous daily issues.
The graphs on the following pages illustrate
how the Ecessa solution has vastly improved
network performance and changed their daily
operations.
Graph Set No. One - Latency
Network latency is an
expression of how much
time it takes for a packet
of data to get from one
designated point to
another. In our PoCs it
is the measurement of
Round Trip Time (RTT) for
the virtual tunnels.
We test latency by
sending test pings and
measuring the time
needed to traverse the
WAN lines.
Note the performance
improvement in the
bottom chart when WAN
Virtualization is applied to
the two WAN links.
Latency performance of WAN 1, WAN 2 and combined Virtualized WAN.
4. Packet loss is the
failure of one or more
transmitted packets to
arrive at their destination.
We use the same test
pings mentioned on the
previous page to measure
how many test pings
return versus how many
are sent.
In the bottom chart,
note the performance
improvement when WAN
Virtualization is applied to
the two WAN links.
Graph Set No. Two - Packet Loss
13755 1st Avenue North, Plymouth, MN 55441 | www.ecessa.com
toll free: 1.800.669.6242 | 763.694.9949
Packet loss performance of WAN 1, WAN 2 and combined Virtualized WAN.
5. Packet re-ordering
percentage is the
measurement of how
many packets arrive out
of proper sequential
order.
We measure this by
sending test packets and
monitoring how many
return out of proper
order; if packets 5, 6, and
7 return before packets 2,
3, and 4 we count that as
50% re-ordering.
Note the performance
improvement in the
bottom graph when WAN
Virtualization is applied to
the two WAN links.
Graph Set No. Three - Packet Re-order
13755 1st Avenue North, Plymouth, MN 55441 | www.ecessa.com
toll free: 1.800.669.6242 | 763.694.9949
Packet re-order performance of WAN 1, WAN 2 and combined Virtualized WAN.
6. WAN Virtualization
eliminated WAN link
outages.
We use test pings to monitor
the health of WAN links,
along with the previously
mentioned micro parametric
performance data (latency,
loss, re-ordering) and
macro stability data like the
complete loss of test pings.
If there are 3 test pings lost
in a row, we indicate an
outage issue and monitor for
recovery within 90 seconds;
if we do not see a recovery
within 90 seconds, we flag
this as an outage.
The five outage events
reported to the left lasted 90
seconds or longer.
In fact, a total of 23 outages
(18 of which lasted less than
90 seconds) occurred and
were avoided.
Graph Set No. Four - WAN Link Outages
When using the optional packet duplication mode, data is duplicated over both links. As long as one of the
links is fuctioning at any given moment, the data is always successfully sent and received. In this mode, the
occurance of an outage or crossing of a degradation threshold is not required to trigger failover. With SD-WAN
packet duplication, there is no failover and therefore no failover time to record. That’s why SD-WAN is perfect
for real time applications like VoIP, video and VDI. No dropped sessions, no dropped calls.
WAN link outages on WAN 1, WAN 2 and combined Virtualized WAN.
7. When you look at the measurements side by side, the improvements in performance are even more clearly
visible. SD-WAN improves not only the performance of the broadband connection (WAN 2), it also provides
quailty of service above that of the MPLS link (WAN 1). The combined performance of a virtualized WAN
dramatically exceeds that of either individual link.
Graph Set No. Five - Overall Performance Improvement
13755 1st Avenue North, Plymouth, MN 55441 | www.ecessa.com
toll free: 1.800.669.6242 | 763.694.9949
Overall performance measures of WAN 1, WAN 2 and combined Virtualized WAN.
8. Utilizing Virtualization as a WAN Solution
It’s important to start by understanding your goals with metrics and scorecards. It’s imperative to gather
real network performance data to set a baseline and analyze and assess what benefits you can realistically
achieve. Setting up SD-WAN to improve your network performance and continuing to gather data will allow
your organization to measure against the baseline and understand how-- and how much-- WAN Virtualization
makes an impact on your network. Once the value has been established, it’s time to make plans to expand
WAN Virtualization to more locations, which additional features you want to set up and to do any fine tuning.
Network architecture is complex and there is never just one solution to fit all problems. Make sure you think
about some of these must have functions in your network:
• Firewall
Security is top of mind for all IT professionals today and this is a must have feature for all network entry
points. Each solution has a different level of sophistication, but the basics are identifying policies for which
items can come or go through your WAN connections.
• Voice over IP (VoIP) Proxy
Digital telephones are everywhere today; that old copper line that you used growing up is being replaced
with fiber, wireless, or standard Gigabit Ethernet. Regardless of how it finds its way to your door, once on
premise you need to decode those small packets as voice. Prioritization and redundancy for the voice traffic
quickly becomes less of a ‘nice to have’ and more of a critical aspect to the network.
• Quality of Service (QoS)
There is a lot of data streaming through your network every millisecond and not all WAN optimization
gear can help prioritize where that data goes once it leaves your network closet. Make sure that you are
sending that Point of Sale data through the best WAN connection and that guest WiFi traffic can take the
less expensive broadband connection, if it is up and running.
• WAN Optimization
Inspecting, compressing, and caching data before it leaves is always a good idea; much like the old adage
of clean before you move. Clean house, make sure employees are not using precious bandwidth for low-
priority distractions. WAN Optimization is a great complementary technology to WAN Virtualization -- a
high performing network needs both.
Utilizing Virtualization as a WAN Solution
13755 1st Avenue North, Plymouth, MN 55441 | www.ecessa.com
toll free: 1.800.669.6242 | 763.694.9949
9. Time to Impact & The PoC Process
We collect data as part of our PoC process, because we know that looking at SD-WAN as a solution makes a
huge impact. We’re able deliver organizations real data from their own networks to support decisions and
understand the ROI before they buy.
The Ecessa Deployment Plan makes benefiting from SD-WAN easy by taking you through the process step-by-
step -- we think of it as a guided tour. In a matter of a month -- not months -- we can set the baseline, go live
and launch. Here’s a look at the phases of the process.
Want to see your own SD-WAN results? Request a proof-of-concept consultation here.
To monitor the performance of your current network, try our free ISP health check here.
13755 1st Avenue North, Plymouth, MN 55441 | www.ecessa.com
toll free: 1.800.669.6242 | 763.694.9949
PHASE 1: BASELINE
• Install Ecessa equipment in Translucent/Bridge mode
• Gather network performance data for 5-10 days
• Analyze data and define metrics for PoC success
PHASE 2: GO LIVE
PHASE 3: LAUNCH
• Enable/turn on key features of Ecessa devices
• Gather network performance data 10-15 days
• Analyze data and capture improvement metrics
• Review performance scorecard with customer
• Create plans for additional sites, features or updates
• Schedule the next Ecessa device deployments
Time to Impact & The PoC Process
REPORT AUTHOR Mike Siegler has a Bachelor of Arts in Mathematics, a Bachelor of Science
in Electrical Engineering, and a Master of Science in the Management of Technology (MoT).
He has worked in Engineering and Technology Development for the last 15 years at firms
such as Digi International, Seagate Technology, Medtronic, General Electric and United
Technologies. Currently, Mike is the Vice President of Development and Technical Support at
Ecessa Corporation, improving wide area network performance for businesses of all sizes.