IGNOU MSCCFT and PGDCFT Exam Question Pattern: MCFT003 Counselling and Family...
2006 genetic basis of drought resistance at reproductive stage in rice
1. Copyright Ó 2006 by the Genetics Society of America
DOI: 10.1534/genetics.105.045062
Genetic Basis of Drought Resistance at Reproductive Stage in Rice:
Separation of Drought Tolerance From Drought Avoidance
Bing Yue,* Weiya Xue,* Lizhong Xiong,* Xinqiao Yu,† Lijun Luo,† Kehui Cui,*
Deming Jin,* Yongzhong Xing* and Qifa Zhang*,1
*National Key Laboratory of Crop Genetic Improvement and National Center of Plant Gene Research (Wuhan), Huazhong Agricultural
University, Wuhan 430070, China and †Shanghai Agrobiological Gene Center, Shanghai 201106, China
Manuscript received May 1, 2005
Accepted for publication October 19, 2005
ABSTRACT
Drought tolerance (DT) and drought avoidance (DA) are two major mechanisms in drought resistance of
higher plants. In this study, the genetic bases of DTand DA at reproductive stage in rice were analyzed using a
recombinant inbred line population from a cross between an indica lowland and a tropical japonica upland
cultivar. The plants were grown individually in PVC pipes and two cycles of drought stress were applied to
individual plants with unstressed plants as the control. A total of 21 traits measuring fitness, yield, and the
root system were investigated. Little correlation of relative yield traits with potential yield, plant size, and root
traits was detected, suggesting that DTand DA were well separated in the experiment. A genetic linkage map
consisting of 245 SSR markers was constructed for mapping QTL for these traits. A total of 27 QTL were
resolved for 7 traits of relative performance of fitness and yield, 36 QTL for 5 root traits under control, and 38
for 7 root traits under drought stress conditions, suggesting the complexity of the genetic bases of both DT
and DA. Only a small portion of QTL for fitness- and yield-related traits overlapped with QTL for root traits,
indicating that DT and DA had distinct genetic bases.
D ROUGHT is one of the major abiotic stresses
limiting plant production. The worldwide water
shortage and uneven distribution of rainfall makes the
membrane stability (Tripathy et al. 2000), abscisic acid
(ABA) content (Quarrie et al. 1994, 1997), stomatal
regulation (Price et al. 1997), leaf water status, and root
improvement of drought resistance especially impor- morphology (Champoux et al. 1995; Ray et al. 1996;
tant (Luo and Zhang 2001). Fulfillment of this goal Price and Tomos 1997; Yadav et al. 1997; Ali et al. 2000;
would be enhanced by an understanding of the genetic Courtois et al. 2000; Zheng et al. 2000; Zhang et al.
and molecular basis of drought resistance. 2001; Kamoshita et al. 2002; Price et al. 2002). However,
However, little progress has been made in character- it is not clear how these attributes are related to the
izing the genetic determinants of drought resistance, performance of the genotypes at the whole-plant level,
because it is a complex phenomenon comprising a num- and how they function to reduce the drought damage to
ber of physio-biochemical processes at both cellular fitness- and productivity-related traits.
and organismic levels at different stages of plant de- Plants are most susceptible to water stress at the
velopment (Tripathy et al. 2000). Drought resistance reproductive stage. Dramatic reduction of grain yield
includes drought escape (DE) via a short life cycle or occurs when stress coincides with the irreversible re-
developmental plasticity, drought avoidance (DA) via productive processes, making the genetic analysis of
enhanced water uptake and reduced water loss, drought drought resistance at the reproductive stage crucially im-
tolerance (DT) via osmotic adjustment (OA), antioxi- portant (Cruz and O’Toole 1984; Price and Courtois
dant capacity, and desiccation tolerance. The recent 1999; Boonjung and Fukai 2000; Pantuwan et al.
development of high-density linkage maps has provided 2002). However, variation of flowering time in segre-
the tools for dissecting the genetic basis underlying gating populations often made the phenotyping of
complex traits, such as drought resistance, into individ- drought resistance rather inaccurate. Staggering the
ual components. Quantitative trait locus (QTL) map- seed-sowing time has been suggested to synchronize the
ping has been carried out in an attempt to determine flowering time of a population in QTL mapping (Price
the genetic basis of several traits that may be related to and Courtois 1999). Lanceras et al. (2004) also re-
drought resistance, including OA (Lilley et al. 1996; ported QTL mapping of yield and yield components
Zhang et al. 1999, 2001; Robin et al. 2003), cell- under different water regimes in the field by synchro-
nizing flowering time of the mapping population. How-
1
ever, the success has been limited because of the
Corresponding author: National Key Laboratory of Crop Genetic
Improvement, Huazhong Agricultural University, Hongshang District, difficulty in achieving a real synchronization of the
Wuhan 430070, China. E-mail: qifazh@mail.hzau.edu.cn flowering time in a segregating population. In addition
Genetics 172: 1213–1228 (February 2006)
2. 1214 B. Yue et al.
to flowering time, segregation for plant size and root Traits and measurements: A total of 21 traits were scored in
volumes also confounds the accuracy of QTL mapping. this study; 9 of them were traits collected from the above-
ground part of the plants and the other 12 were root traits
It is almost impossible to distinguish the genetic basis of
(Table 1).
DT from other contributing factors (such as DA and The traits collected from above-ground parts were related to
DE) in drought resistance under field conditions in fitness and productivity, including yield and yield component
which drought stress is applied to and withdrawn from traits, biomass, and fertility. Yield and yield-related traits were
all plants simultaneously. examined for all plants under stress and the control con-
In this study, we adopted a protocol for drought ditions, including grain yield per plant (in grams), number of
spikelets per panicle, 1000-grain weight (in grams), fertile
treatment by planting and stressing rice plants of a panicle rate (%), spikelet fertility (%), biomass (in grams) and
recombinant inbred line (RIL) population in individual harvest index (%). Fertile panicle rate was the proportion of
polyvinyl chloride (PVC) pipes in which the various the number of fertile panicles (with 5 grains or more on each
genotypes were stressed to the same extent at the same panicle) in all the panicles of a plant. Spikelet fertility was
developmental stage. We showed that such an experi- measured as the number of grains divided by the total number
of spikelets of a plant. Harvest index was scored as grain yield
mental design cleanly separated DT from DA, thus divided by the total dry matter of the above-ground part. The
allowing relatively independent analyses of the genetic relative performance of the phenotypes for each trait was mea-
bases of DT and DA. sured simply as the ratios of the measurements taken under
drought stress and control conditions.
In addition, two traits related to the water status of the
plants, leaf-drying score and number of days to leaf rolling,
MATERIALS AND METHODS were also recorded. Leaf-drying score was recorded on the
basis of the degrees of leaf drying immediately after rewatering
Plant materials and drought stress treatment: A population as 0 (no leaf drying) to 4 (.20% of the leaf area was drying).
consisting of 180 RILs at F9/F10 generation was developed Number of days to leaf rolling of each plant was recorded as
from a cross between the lowland rice cultivar Zhenshan 97 the number of days from the application of drought stress to
(Oryza sativa L. ssp. indica) and the upland rice cultivar the day when all leaves became rolled at noon.
IRAT109 (O. sativa L. ssp. japonica). Zhenshan 97 is the main- The root traits were scored at seed maturity of the plants. To
tainer line for a number of elite hybrids widely cultivated in measure these traits, the plastic bag containing the soil and
China, and IRAT109 was developed in Cote d’Ivoire. roots was pulled out from the PVC pipe and laid out on a 2-mm
For phenotyping, rice plants were grown in PVC pipes, one sieve screen frame. The lowest visible root in the soil after
plant per pipe, under a rain-out shelter with movable roofs. removing the plastic bag was scored as the maximum root
The pipe was 20 cm in diameter and 1 m in length with holes depth (in centimeters). The body of soil and roots was cut into
on two sides at 25, 50, and 75 cm from the top. Each pipe was two parts at 30 cm from the basal node of the plant and the soil
loaded with a plastic bag filled with 38 kg of thoroughly mixed was washed away carefully to collect roots. The volumes (in
soil composed of two parts of clay and one part of river sand, to milliliters) of roots from the two parts were measured in a
which 25 g of fertilizers (including 4 g each of N, P2O5, and cylinder using the water-replacing method (Price and Tomos
K2O) was added. 1997). The root mass below 30 cm was considered to be deep
Sowing time was staggered among the lines to synchronize root, from which a number of measurements were derived.
flowering on the basis of the heading dates of the lines Root growth rate in depth and root growth rate in volume were
observed in 2002. Three to five germinated seeds were directly calculated by dividing the maximum root depth and the total
sown in each pipe and only one healthy plant was kept at root volume, respectively, by the root growth period (number
30 days after sowing. At the beginning of the tillering stage, 1 g of days from sowing to heading of the plant). Drought-
of urea (dissolved in water) was applied to each pipe. The induced root growth was evaluated by two traits: drought-
plants were fully irrigated by watering every day until the induced root growth in depth and drought-induced deep-root
drought treatment. Drought stress was individually applied to rate in volume, which were calculated as the differences of
each plant at the booting stage. To apply drought stress, water maximum root depth and deep-root rate in volume between
was added to the full capacity of the pipe, the plugs on the pipe the measurements obtained under drought stress and control
were then removed, and small holes were punched on the conditions.
plastic bag to drain the water slowly. Rain was kept off by The abbreviations for and descriptions of these traits are
closing the roof during periods of rain. When all leaves of a listed in Table 1 and used hereafter.
stressed plant became fully rolled, as visualized at noon—a DNA markers, map construction, and QTL analysis: A total
point corresponding to the relative water content in the range of 245 nuclear simple sequence repeat (SSR) markers were
of 72–75%, as checked in this study—watering was applied to used for constructing the linkage map. The SSR primers and
the full capacity of the pipe. With the full water level main- marker assays essentially followed Temnykh et al. (2000, 2001)
tained for 1 day, the second cycle of drought stress was applied and McCouch et al. (2002). The program of Mapmaker/EXP
to the plant until all leaves became fully rolled again. After the 3.0 (Lincoln et al. 1992) was used to construct the genetic
second round of stress, watering was resumed for the rest of linkage map. The means of the traits were used to identify QTL
the life cycle. by Windows QTL Cartographer 2.0 (Zeng 1994). The LOD
The pipes were laid out in six blocks following a randomized thresholds were determined by 500 random permutations,
complete block design. Drought stress was applied to three of which resolved that, at a false positive rate of ,0.05 for each
the blocks with the other three blocks used as control. In 2003, trait, the LOD thresholds ranged from 1.9 to 2.4 for 20 of
150 RILs and the parents were phenotyped with two pipes per the 21 traits. The only exception was relative fertile panicles
block for each genotype. In 2004, 75 RILs and the parents were (RFP), in which the LOD threshold was 2.6 for the data of
tested to represent the resistant and susceptible lines on the 2003 and 4.1 for 2004. For ease of presentation, a uniform
basis of relative yield in 2003, with only one pipe per block for threshold of 2.4 was adopted for the 20 traits, and 2.6 and 4.1
each genotype. were used for RFP for the 2 years, respectively. The results of
3. Genetic Basis of Drought Resistance in Rice 1215
TABLE 1
Abbreviations, full names, and descriptions of the traits investigated in this study
Abbreviation Trait Description
RY Relative yield per plant (%) Yield per plant under drought stress/Yield per plant
under control conditions
RSF Relative spikelet fertility (%) Spikelet fertility under drought/Spikelet fertility
under control conditions
RBM Relative biomass (%) Biomass per plant under drought/Biomass per plant
under control conditions
RFP Relative rate of fertile panicles (%) Rate of fertile panicles (with five seeds or more) per
plant under drought/Rate of fertile panicles per
plant under control conditions
RHI Relative harvest index (grain yield/biomass) (%) Harvest index under drought/Harvest index under
control conditions
RGW Relative grain weight (%) Weight of 1000 seeds under drought/Weight of
1000 seeds under control conditions
RSN Relative number of spikelets per panicle (%) No. of spikelets per panicle under drought/no. of
spikelets per panicle under control conditions
LDS Leaf-drying score Degrees of leaf drying immediately after rewatering,
scored 1 (no drying) to 5 (.20% area dried)
DLR No. of days to leaf rolling No. of days to leaf rolling starting from day of drought
treatment
MRDC Maximum root depth under control (cm) The lowest visible root at the soil surface after removing
the plastic bag under control conditions
MRDD Maximum root depth under drought (cm) The lowest visible root at the soil surface after removing
the plastic bag under drought conditions
DIRD Drought-induced root growth in depth (cm) The difference of maximum root depth under drought
and control conditions
RGDC Root growth rate in depth under control Maximum root depth divided by root growth period
conditions (cm/day) under control conditions
RGDD Root growth rate in depth under drought Maximum root depth divided by root growth period
conditions (cm/day) under drought conditions
RVC Root volume under control conditions (ml) The volume of roots under control conditions measured
using the water-replacing method
RVD Root volume under drought conditions (ml) The volume of roots under drought conditions measured
using the water-replacing method
DRVC Deep root rate in volume under control Percentage of root volume ,30 cm in the total root
conditions (%) volume under control conditions
DRVD Deep root rate in volume under drought Percentage of root volume ,30 cm in the total root
conditions (%) volume under drought conditions
RGVC Root growth rate in volume under control Total root volume divided by root growth period under
conditions (ml/day) control conditions
RGVD Root growth rate in volume under drought Total root volume divided by root growth period under
conditions (ml/day) drought conditions
DIDRV Deep root rate in volume induced by drought The difference in deep-root rate in volume under
conditions (%) drought and control conditions
both years were presented for QTL with a LOD score .2.4 in the traits, although the relative proportions of variance
1 year but in the range of 2.0–2.4 in the other year for the 20 varied from one trait to another (Table 3).
traits.
IRAT109 showed more drought resistance than
Zhenshan 97 in both years by having higher values in
relative performance of the traits related to fitness and
RESULTS
productivity (Table 2). The differences between the two
Phenotypic variation of the parents and RILs: The parents for relative yield, relative biomass, relative spike-
phenotypic differences between parents as well as the let fertility, and relative grain weight were significant at
variation in the RIL population are summarized in the 0.01 probability level in 2003. Thus Zhenshan 97
Table 2. Transgressive segregation was observed in the suffered much more drought damage than IRAT109.
RIL population for all the traits investigated. ANOVA of The reverse performance was observed between the
the data collected in 2003 indicated that variation due parents for the two traits related to water status (Table
to genotype differences was highly significant for all 2). The leaf-drying score of IRAT109 was significantly
4. 1216 B. Yue et al.
TABLE 2
The measurements of the traits in the RIL population and the parents in 2003 and 2004
Trait Zhenshan 97 IRAT109 Mean of RILs Range of RILs
RY 43.9/65.7*** 80.6**/81.9 58.2/52.6 (19.6–90.8)/(17.9–90.5)
RSF 54.2/69.1 74.3**/88.6 63.9/63.7 (24.2–94.5)/(22.4–95.6)
RBM 79.0/81.8 94.9**/89.6 90.4/81.0 (70.3–100.0)/(57.1–99.2)
RFP 88.3/92.5**** 93.5/100.0**** 80.0/94.0 (28.1–100.0)/(68.6–100.0)
RHI 52.1/66.9 65.6/74.8 59.2/58.6 (20.3–100.0)/(18.3–96.9)
RGW 73.5/76.2 88.0**/97.8*,**** 87.6/82.0 (58.0–104.1)/(63.2–104.1)
RSN 89.6/98.3**** 91.9/94.8*** 84.8/94.3 (52.1–100.5)/(68.6–100.2)
LDS 3.0*/2.67* 1.7/1.3 2.4/1.8 (1.0–3.8)/(0.3–3.3)
DLR 18.5**/22.0*,*** 10.3/16.7**** 12.1/19.4 (7.0–17.5)/(8.0–26.7)
MRDC 53.6/53.3 61.1**/67.0* 61.8/57.9 (47.2–79.8)/(39.0–75.5)
MRDD 76.7/82.7 79.5/92.3*** 81.9/87.1 (64.8–94.5)/(69.0–95.7)
DIRD 23.1*/29.4 18.4/25.3*** 20.1/29.2 (7.0–33.8)/(14.7–48.0)
RGDC 0.8/0.8 0.8/0.9 0.8/0.9 (0.6–1.0)/(0.5–1.0)
RGDD 1.2/1.3 1.0/1.3*** 1.0/1.1 (0.7–1.4)/(0.8–1.6)
RVC 84.0***/51.0 84.3***/70.0* 112.3/82.6 (46.3–231.4)/(43.9–146.9)
RVD 73.0***/45.2 102.5**,***/75.7 107.8/89.7 (43.0–234.6)/(29.8–175.1)
DRVC 8.7/8.9 22.4**,***/12.8* 13.3/9.2 (2.5–28.8)/(0.8–22.4)
DRVD 17.6/16.4 25.6/33.0*,*** 19.0/24.8 (3.7–36.3)/(10.6–44.1)
RGVC 1.3***/0.8 1.1/0.8 1.4/1.0 (0.8–2.3)/(0.7–1.7)
RGVD 1.1/0.7 1.3/1.1 1.3/1.1 (0.6–2.3)/(0.4–1.8)
DIDRV 8.9/7.5 3.2/20.2**,**** 5.7/15.6 (ÿ4.2–18.9)/(1.6–29.1)
The number at the left of the ‘‘/’’ is the result of 2003, and the number at the right is the result of 2004. *,**Significantly higher
than the other parent at the 0.05 and 0.01 probability levels based on t-test. ***,****Significantly higher than the other year of the
same parent at the 0.05 and 0.01 probability levels based on t-test.
less than that of Zhenshan 97 in both years, while grain weight, and relative harvest index were highly
Zhenshan 97 could sustain longer time than IRAT109 correlated with each other (Table 4). This suggested that
before leaf rolling as reflected by the DLR scores. the yield loss and harvest index reduction under drought
For most of the root traits (Table 2), IRAT109 had stress in late season were associated with the reduction of
higher values than Zhenshan 97 under both control and spikelet fertility, fertile panicle rate, biomass and grain
drought stress conditions in both years. In at least one weight. In particular, a very high correlation (0.85–0.95)
year, the differences between parents for maximum root was observed between relative yield, relative spikelet
depth under control, root volume and deep-root rate fertility, and relative harvest index in both years.
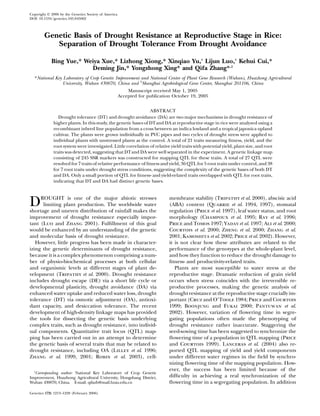
under both drought stress and control conditions, and Figure 1 illustrates the relationships of relative yield
drought-induced deep-root rate in volume were signif- and relative biomass with yield and biomass under con-
icant. Zhenshan 97, however, showed more drought- trol conditions. It was clear from Figure 1 that relative
induced root growth in depth than IRAT109 did, and yield was not correlated with yield under control con-
the difference was significant in 2003. Again, trans- ditions, and thus genotypes with high and low yield
gressive segregation was observed in all the root traits. potential were equally stressed. Similarly, there was little
When the data collected from the 2 years were correlation between relative biomass and biomass un-
compared, DLR was substantially higher in 2004 than der control conditions, and thus genotypes with large
in 2003 for both parents (Table 2), indicating that the and small plant sizes were equally stressed. Moreover,
stress developed more slowly in 2004 due to the milder relative yield was not significantly correlated with bio-
weather conditions during drought stress (the tempera- mass under control, and neither was relative biomass
ture and evaporation was higher in 2003). Consequently, a significantly correlated with yield under control.
number of other traits also showed significant differences There was no correlation between the two traits re-
between the 2 years in one or both parents, including lated to water status of the plants (Table 4). There were
relative yield, relative number of fertile panicles, relative no consistent correlations between these two traits with
grain weight, and relative spikelet number. Significant the relative performance of the traits related to fitness
differences between the 2 years were also observed in and productivity in 2 years, except the negative corre-
several root traits in one or both parents. lation detected in both years between relative biomass
Correlations of the traits: The traits related to fitness and number of days to leaf rolling.
and productivity, e.g., relative yield, relative spikelet fertil- The root traits investigated were also highly corre-
ity, relative rate of fertile panicle, relative biomass, relative lated with each other (Table 5). In general, constitutive
5. Genetic Basis of Drought Resistance in Rice 1217
TABLE 3 TABLE 3
ANOVA of the traits based on the data of 2003 (Continued)
Trait Variation d.f. MS F P Trait Variation d.f. MS F P
RY Genotype 151 1262.89 7.23 0.0000 RGVD Genotype 151 0.43 6.9 0.0000
Block 2 1550.86 8.88 0.0002 Block 2 0.74 11.92 0.0000
Error 302 174.56 Error 302 0.06
RSF Genotype 150 1222.68 3.83 0.0000 DIDRV Genotype 151 209.78 2.73 0.0000
Block 2 946.45 2.97 0.0521 Block 2 204.93 2.67 0.0702
Error 300 319.06 Error 302 76.72
RBM Genotype 150 289.24 1.38 0.0120
Block 2 623.25 2.97 0.0518 MS, mean square; F, F-statistic.
Error 300 209.63
RFP Genotype 150 589.01 2.90 0.0000
Block 2 1738.76 8.54 0.0003
root growth (maximum root depth and root volume
Error 300 203.45 under control) had high and consistent correlations
RHI Genotype 149 1560.11 3.14 0.0000 with other root traits. For example, maximum root
Block 2 978.40 1.97 0.1391 depth was highly significantly correlated in both years
Error 298 497.14 with all the root traits, except drought-induced root
RGW Genotype 150 138.38 2.77 0.0000 growth in volume. A similar situation was also obvious
Block 2 28.76 0.58 0.5683 for root volume under control that was also highly cor-
Error 300 49.93
RSN Genotype 150 323.34 2.83 0.0000
related with most root traits. The highest correlation
Block 2 31.27 0.27 0.7655 (.0.90) detected was between root volume and root
Error 300 114.38 growth rate under both control and drought conditions.
LDS Genotype 149 2.32 4.83 0.0000 Correlations between traits in different groups are
Block 2 5.89 12.27 0.0000 shown in Table 6. In general, there was not much cor-
Error 298 0.48 relation between the relative performance of fitness-
DLR Genotype 151 16.00 7.07 0.0000 and productivity-related traits and the root traits, with
Block 2 6.67 2.95 0.0525
Error 302 2.26
exceptions of only a few marginal cases in 2004, all of
MRDC Genotype 151 109.84 3.73 0.0000 which suggested root growth under drought had small
Block 2 1397.86 47.42 0.0000 negative effects on yield and biomass. Thus, variation in
Error 302 29.48 root traits contributed very little toward reducing the
MRDD Genotype 150 126.42 2.70 0.0000 drought stress of the upground parts in this experiment.
Block 2 3330.98 71.11 0.0000 In addition, relative yield, relative biomass, and relative
Error 300 46.84 fertility were not significantly correlated with flowering
DIRD Genotype 149 123.42 2.01 0.0000
Block 2 875.99 14.24 0.0000
time (data not shown), as expected on the basis of the
Error 298 61.53 experimental design. All this demonstrated that the
RGDC Genotype 151 0.02 2.59 0.0000 pipe planting effectively minimized the effects of DA or
Block 2 0.22 25.52 0.0000 DE on relative yield and yield-related traits. Therefore,
Error 302 0.01 the relative yield, relative spikelet fertility, and relative
RGDD Genotype 150 0.06 5.07 0.0000 biomass examined in this study were indeed regulated
Block 2 0.17 15.4 0.0000 almost exclusively by DT mechanisms under the ex-
Error 300 0.01
RVC Genotype 151 4398.12 10.35 0.0000
perimental conditions and thus can be viewed as DT
Block 2 411.89 0.97 0.3824 traits although the underlying mechanisms remain to
Error 302 424.96 be investigated.
RVD Genotype 151 5195.99 12.85 0.0000 Table 6 also showed no correlation between leaf-
Block 2 1578.62 3.90 0.0211 drying score and the root traits. Number of days to leaf
Error 302 404.31 rolling was negatively correlated with a number of traits
DRVC Genotype 151 0.02 5.45 0.0000 measuring root volumes under both drought stress and
Block 2 0.07 19.09 0.0000
Error 302 0.004
control conditions; thus leaf rolling occurred sooner in
DRVD Genotype 151 0.04 4.32 0.0000 plants with larger root volumes. However, there was one
Block 2 0.04 4.87 0.0083 highly significant positive correlation between number
Error 302 0.01 of days to leaf rolling and root growth in depth under
RGVC Genotype 151 0.42 5.85 0.0000 drought, indicating drought-induced root growth in
Block 2 depth may have a positive effect on delaying leaf rolling.
Error 302 0.07 The linkage map: A total of 410 SSR markers were
(continued ) surveyed and 245 (59.8%) of them showed polymor-
phism between the two parents. A linkage map was
6. 1218 B. Yue et al.
TABLE 4
Coefficients of pairwise correlations of the above-ground traits investigated in 2003 and 2004
RY RSF RBM RFP RHI RGW RSN LDS
RSF 0.88/0.85
RBM 0.35/0.40 0.15/0.03
RFP 0.58/0.46 0.64/0.51 0.26/0.14
RHI 0.95/0.85 0.89/0.94 0.15/ÿ0.07 0.46/0.44
RGW 0.44/0.61 0.36/0.47 0.10/0.27 0.30/0.38 0.44/0.48
RSN 0.37/0.03 0.21/ÿ0.07 0.23/ÿ0.04 0.27/0.01 0.33/0.08 0.32/0.04
LDS ÿ0.31/0.03 ÿ0.26/0.05 ÿ0.23/0.13 ÿ0.34/0.14 ÿ0.24/0.05 ÿ0.15/0.04 ÿ0.21/0.09
DLR ÿ0.36/ÿ0.21 ÿ0.23/ÿ0.11 ÿ0.29/ÿ0.37 ÿ0.12/0.00 ÿ0.33/ÿ0.03 ÿ0.39/0.05 ÿ0.27/0.12 0.09/ÿ0.21
Critical values at the 0.01 probability level are 0.21 and 0.30 for 2003 and 2004, respectively. The number at the left of the ‘‘/’’ is
the result of 2003, and the number at the right is the result of 2004.
constructed using Mapmaker analysis based on data from both cases, one QTL was detected in both years and
the 245 SSR markers assayed on the 180 RILs (Figure 2). the others were detected in only 1 year. As in the traits
The map covered a total length of 1530 cM with an av- for relative performance described above, the region
erage interval of 6.2 cM between adjacent markers. RM219–RM296 on chromosome 9 showed a large effect
QTL for relative performance of the traits related on number of days to leaf rolling (QDlr9). Also a QTL
to fitness and productivity: QTL detected for relative for leaf-drying score (QLds3b) had a large effect on the
performance of seven traits related to fitness and pro- trait in both years.
ductivity are listed in Table 7(see also Figure 2). A total QTL for root traits under control conditions: A total
of 27 QTL were resolved for the seven traits, including of 36 QTL were resolved for the five root traits under
8 QTL detected in both years and 19 QTL observed in control conditions (Table 9; Figure 2), of which 7 were de-
only 1 year. The detection is quite consistent, consider- tected in both years and the remaining 29 in only 1 year.
ing the large scale of the experiment, the nature of the Again, the effects observed in 2004 were larger than
traits, and the secondary statistics of ratios as input data. those in 2003 for all the QTL detected in both years,
All the QTL that were detected in both years appeared except for one QTL, QRgvc3, for root growth rate in
to have larger effects in 2004 than in 2003, as indicated volume under control conditions. While the IRAT109
by the LOD scores and the amounts of variation ex- alleles at 22 of the 36 QTL contributed positively to the
plained. This is expected since the lines planted in 2004 root traits, alleles from Zhenshan 97 at 5 of the 7 QTL
were selected on the basis of the extreme phenotypes that were observed in both years had positive effects on
from the previous year. the root traits. Of the 19 QTL each explaining .10% of
Alleles from IRAT109 at 14 of the QTL had positive phenotypic variation, the IRAT109 alleles at 12 QTL
effects on the relative performance of these traits, while contributed to the increase of the trait measurements.
alleles from Zhenshan 97 at the other 13 loci contrib- Again, there were a number of regions where QTL for
uted positively to the relative performance (Table 7). Of two or more traits were detected, including the intervals
the 8 QTL that were consistently detected in both years, RM472–RM104 on chromosome 1, RM231–RM489
the IRAT109 alleles at 7 QTL had positive effects on the on chromosome 3, both RM471–RM142 and RM349–
relative performance of these traits. Interestingly, one RM131 on chromosome 4, both RM125–MRG4499 and
region on chromosome 9, RM316–RM219, was partic- RM429–RM248 on chromosome 7, RM316-RM219 on
ularly active by exhibiting significant effects simulta- chromosome 9, and RM287–RM229 on chromosome 11.
neously on relative yield (QRy9), relative spikelet fertility In all the QTL having effects on multiple traits, except
(QRsf9), relative biomass (QRbm9), and relative harvest one, alleles from the same parents contributed in the
index (QRhi9). Another region on chromosome 8, same direction to different traits, suggesting the likeli-
RM284–RM556, was detected to have a significant ef- hood that different QTL are due to the effects of the
fect on relative yield (QRy8), relative spikelet fertility same genes.
(QRsf8), and relative number of fertile panicles (QRfp8). QTL for root traits under drought stress: A total of
It is also worth noting that almost all the QTL detected 38 QTL were observed for the seven root traits under
in both years had large effects on the traits as reflected drought stress conditions (Table 10; Figure 2), including
by the large proportions of the phenotypic variation 6 detected in both years and 32 detected in only 1 year.
explained (10% or more). Unlike other traits described above, the effects of QTL
QTL for the two plant water status traits: Six QTL detected in 2004 were not necessarily larger than those
were resolved for leaf-drying score and four QTL for resolved in 2003 for the QTL detected simultaneously in
number of days to leaf rolling (Table 8; Figure 2). In both years. Alleles from IRAT109 at 23 of the 38 QTL
7. Genetic Basis of Drought Resistance in Rice 1219
Figure 1.—Scatter plots of relative performance of yield and biomass against yield and biomass under control conditions in
2003 (left) and 2004 (right). (A) Relative yield against yield under control; (B) relative biomass against biomass under control; (C)
relative yield against biomass under control; (D) relative biomass against yield under control.
contributed to the increase of the trait measurements, notypic variation, alleles from IRAT109 at 17 loci had
whereas at the other 15 QTL, alleles from Zhenshan 97 positive effects on these root traits.
were in the direction of increasing the trait measure- The QTL were distributed very unevenly among the
ments. Of the 22 QTL each explaining .10% of phe- chromosomes, with 11 QTL on chromosome 4, 5 QTL
8. 1220 B. Yue et al.
on chromosome 7, 4 QTL on each of chromosomes 2
ÿ0.18/0.30
RGVD
and 3, 3 QTL on each of chromosomes 1, 8, 9, and 11,
1 QTL on each of chromosomes 6 and 10, but none
on chromosomes 5 and 12. There were also obvious
hotspots where QTL for two or more of the root traits
0.81/0.73
ÿ0.21/0.06
RGVC
under drought stress were detected, including regions
mostly on chromosome 4, as well as chromosomes 3, 7,
9, and 11 (Figure 2).
Comparison of chromosomal locations of QTL for
different types of traits: Of the 21 chromosomal re-
0.26/0.33
0.21/0.51
0.58/0.80
gions resolved with QTL for relative performance of
DRVD
fitness- and productivity-related traits, 9 overlapped with
the QTL intervals for root traits (Figure 2). One region
Coefficients of pairwise correlations of the root traits investigated in this study in 2003 and 2004
0.62/0.75 on chromosome 9, RM316–RM219, in which multiple
0.50/0.46
0.42/0.50
ÿ0.26/0.19
QTL were detected, showed relatively large effects on
DRVC
both root traits and relative performance of fitness and
productivity; the other 9 regions had only 1 QTL, each
with relatively small effects on the respective traits (Figure
2; Tables 7, 9, and 10). In addition, positive alleles for
0.46/0.51
0.19/0.45
0.80/0.77
0.96/0.94
ÿ0.23/0.21
the two types of traits were contributed by different
RVD
parents in 4 of the 9 overlapping regions, including the
region RM316–RM219 on chromosome 9. The distinct
chromosomal locations between QTL for fitness- and
productivity-related traits and root traits, and the dif-
0.89/0.87
0.53/0.47
0.22/0.32
0.95/0.93
0.83/0.73
ÿ0.27/0.04
ferent directions of the allelic contributions for most
RVC
overlapping QTL, were in good agreement with the
results of correlation analysis, further suggesting that
TABLE 5
root traits and relative performance of the fitness and
productivity traits had different genetic determinants.
ÿ0.49/ÿ0.65
ÿ0.52/ÿ0.62
ÿ0.10/ÿ0.19
ÿ0.29/ÿ0.43
ÿ0.34/ÿ0.38
0.28/0.03
0.46/0.21
Number of days to leaf-rolling and leaf-drying score
RGDD
are two traits reflecting plant water status. All four QTL
for number of days to leaf rolling overlapped with one
or more QTL for root traits, but none of them over-
lapped with QTL for the relative performance of fitness-
ÿ0.21/ÿ0.25
ÿ0.29/ÿ0.27
ÿ0.02/ÿ0.04
ÿ0.15/ÿ0.10
0.19/ÿ0.01
and productivity-related traits (Figure 2). Of the six
0.67/0.55
0.32/0.36
0.43/0.22
RGDC
QTL for leaf-drying score, only one with small effect
overlapped with a QTL for relative spikelet number that
also seemed to have impact on deep-root rate in volume
induced by drought. Again, these results agreed well
with the correlation results above, in which number of
ÿ0.13/ÿ0.42
ÿ0.26/ÿ0.42
ÿ0.26/ÿ0.35
ÿ0.33/ÿ0.53
0.09/ÿ0.13
ÿ0.20/ÿ0.39
ÿ0.20/ÿ0.27
0.60/0.44
0.46/0.28
days to leaf rolling was significantly correlated with some
DIRD
of the root traits, while the leaf-drying score had little
correlation with either root traits or above-ground traits
(Tables 4 and 6).
See Table 4 legend for explanations.
0.54/0.19
0.24/0.15
0.41/0.19
0.33/0.31
0.29/0.29
0.43/0.46
0.64/0.59
0.35/0.29
0.29/0.31
0.34/0.46
MRDD
DISCUSSION
The PVC pipe protocol successfully separated
ÿ0.49/ÿ0.80
ÿ0.20/ÿ0.30
drought tolerance and drought avoidance: A major dif-
0.48/0.42
0.38/0.48
0.62/0.58
0.56/0.50
0.79/0.76
0.57/0.48
0.57/0.53
0.51/0.43
ÿ0.13/0.01
MRDC
ficulty in genetic analysis of drought resistance by apply-
ing and relieving drought treatment at the same time
for all plants, as adopted by many previous studies, is
the inability to resolve the whole-plant resistance into
individual components, such as DE, DA, and DT. Pre-
DIDRV
MRDD
RGDD
RGDC
DRVD
RGVD
DRVC
RGVC
DIRD
vious studies showed that the drought resistance in-
RVD
RVC
dex (relative yield) was often negatively correlated with