SlideShare une entreprise Scribd logo
1  sur  4
Christian S. Gle
BEEd 3rd – A
QUARTILE DEVIATION
Objectives:
To present the procedures in getting the quartile deviation from ungrouped and grouped
data.
Subject Matter:
Topic:
Reference:
Materials:
Methodology:

Measures of Variability
- Quartile Deviation
Educational Measurement and Evaluation
pp. 97-99
power point presentation, chalkboard
computation

Lesson Content:
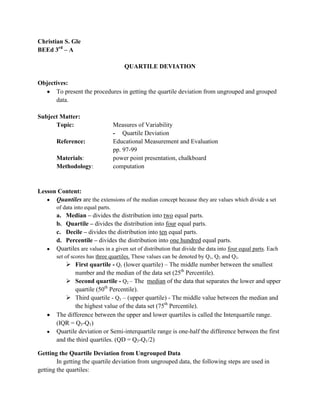
Quantiles are the extensions of the median concept because they are values which divide a set
of data into equal parts.

a. Median – divides the distribution into two equal parts.
b. Quartile – divides the distribution into four equal parts.
c. Decile – divides the distribution into ten equal parts.
d. Percentile – divides the distribution into one hundred equal parts.
Quartiles are values in a given set of distribution that divide the data into four equal parts. Each
set of scores has three quartiles. These values can be denoted by Q1, Q2 and Q3.
 First quartile - Q1 (lower quartile) – The middle number between the smallest

number and the median of the data set (25th Percentile).
 Second quartile - Q2 – The median of the data that separates the lower and upper
quartile (50th Percentile).
 Third quartile - Q3 – (upper quartile) - The middle value between the median and
the highest value of the data set (75th Percentile).
The difference between the upper and lower quartiles is called the Interquartile range.
(IQR = Q3-Q1)
Quartile deviation or Semi-interquartile range is one-half the difference between the first
and the third quartiles. (QD = Q3-Q1/2)
Getting the Quartile Deviation from Ungrouped Data
In getting the quartile deviation from ungrouped data, the following steps are used in
getting the quartiles:
1. Arrange the test scores from highest to lowest.
2. Assign serial numbers to each score. The first serial number is assigned to the lowest
test score, while the last serial number is assigned to the highest test score.
3. Determine the first quartile (Q1). To be able to locate Q1, divide N by 4. Use the
obtained value in locating the serial number of the score that falls under Q1.
4. Determine the third quartile (Q3), by dividing 3N by 4. Locate the serial number
corresponding to the obtained answer. Opposite this number is the test score
corresponding to Q3.
5. Subtract Q1 from Q3 and divide the difference by 2.
Consider the test scores in the table below:
Score
17
17
26
27
30
30
31
37

=

Serial Number
1
2
3
4
5
6
7
8

=2

Q1 = (
= 21.5
=

=6

Q3 = (

N=8

= 30.5

QD = (

)

=(

)
= 4.5

Getting the Quartile Deviation from Grouped Data
In getting the quartile deviation from grouped data, the following steps are used in getting
the quartiles:
1. Cumulate the frequencies from the bottom to the top of the grouped frequency
distribution.
2. For the first quartile, use the formula Q1 =L +

(i) where:

L = exact lower limit if the Q1 class
N/4 = locator of the Q1 class
N = total number of scores
CF = cumulative frequency below the Q1 class
i = class size/interval
3. For the third quartile, use the formula Q3 = L +

(i) where:

L = exact lower limit if the Q3 class
3N/4 = locator of the Q3 class
N = total number of scores
CF = cumulative frequency below the Q3 class
i = class size/interval
Example:
Computation of the Quartile Deviation for Grouped Test Scores
Classes

Frequency (f)

Cumulative Frequency (CF)

46-50
41-45
36-40
31-35
26-30
21-25
16-20
11-15

5
7
9
10
8
6
4
4

53
48
41
32
33
14
8
4

N = 53
The computational procedures for determining the quartile deviation for grouped test
scores are reflected in the above table.

For the first quartile
=

= 13. 25

CF = 8 f = 6 L = 20.5

Q1

=L+
= 20. 5 +

(i)
(5)
= 20. 5 +

CF = 32 f = 9 L = 35.5

(5)

Q3

= 20. 5 +
= 25.75

(i)

= 35.5 +
= 35.5 +

For the third quartile
=

=L+

(5)
(5)

= 35.5 +

= 40.5

= 40.22

After obtaining the first and third quartiles, we can now compute QD. Thus QD = (

QD

=(
=(

)
)

= 7.235 or 7.24

).

Contenu connexe

Tendances

sampling simple random sampling
sampling simple random samplingsampling simple random sampling
sampling simple random samplingDENNY VARGHESE
 
Introduction To Statistics
Introduction To StatisticsIntroduction To Statistics
Introduction To Statisticsalbertlaporte
 
Sampling design
Sampling designSampling design
Sampling designBalaji P
 
Types of Scores & Types of Standard Scores
Types of Scores & Types of Standard ScoresTypes of Scores & Types of Standard Scores
Types of Scores & Types of Standard ScoresCRISALDO CORDURA
 
Types of Variables
Types of VariablesTypes of Variables
Types of VariablesAli Mustafa
 
Inferential statistics.ppt
Inferential statistics.pptInferential statistics.ppt
Inferential statistics.pptNursing Path
 
Measures of Variability
Measures of VariabilityMeasures of Variability
Measures of Variabilityjasondroesch
 
Basics of statistics
Basics of statisticsBasics of statistics
Basics of statisticsdonthuraj
 
The sampling distribution
The sampling distributionThe sampling distribution
The sampling distributionHarve Abella
 
Chapter 2: Frequency Distribution and Graphs
Chapter 2: Frequency Distribution and GraphsChapter 2: Frequency Distribution and Graphs
Chapter 2: Frequency Distribution and GraphsMong Mara
 
Sampling - Stratified vs Cluster
Sampling - Stratified vs ClusterSampling - Stratified vs Cluster
Sampling - Stratified vs ClusterAniruddha Deshmukh
 

Tendances (20)

Item analysis
Item analysisItem analysis
Item analysis
 
sampling simple random sampling
sampling simple random samplingsampling simple random sampling
sampling simple random sampling
 
Introduction To Statistics
Introduction To StatisticsIntroduction To Statistics
Introduction To Statistics
 
Tscore
TscoreTscore
Tscore
 
Item analysis
Item analysis Item analysis
Item analysis
 
Sampling design
Sampling designSampling design
Sampling design
 
Types of Scores & Types of Standard Scores
Types of Scores & Types of Standard ScoresTypes of Scores & Types of Standard Scores
Types of Scores & Types of Standard Scores
 
Item analysis with spss software
Item analysis with spss softwareItem analysis with spss software
Item analysis with spss software
 
Types of Variables
Types of VariablesTypes of Variables
Types of Variables
 
Inferential statistics.ppt
Inferential statistics.pptInferential statistics.ppt
Inferential statistics.ppt
 
Measures of Variability
Measures of VariabilityMeasures of Variability
Measures of Variability
 
Basics of statistics
Basics of statisticsBasics of statistics
Basics of statistics
 
Kruskal Wall Test
Kruskal Wall TestKruskal Wall Test
Kruskal Wall Test
 
Inferential statistics
Inferential statisticsInferential statistics
Inferential statistics
 
Hypothesis Testing
Hypothesis TestingHypothesis Testing
Hypothesis Testing
 
The sampling distribution
The sampling distributionThe sampling distribution
The sampling distribution
 
Chapter 2: Frequency Distribution and Graphs
Chapter 2: Frequency Distribution and GraphsChapter 2: Frequency Distribution and Graphs
Chapter 2: Frequency Distribution and Graphs
 
Measures of Dispersion
Measures of DispersionMeasures of Dispersion
Measures of Dispersion
 
Sampling - Stratified vs Cluster
Sampling - Stratified vs ClusterSampling - Stratified vs Cluster
Sampling - Stratified vs Cluster
 
Cluster sampling
Cluster samplingCluster sampling
Cluster sampling
 

Similaire à Quartile Deviation

Education 309 – Statistics for Educational Research
Education 309 – Statistics for Educational ResearchEducation 309 – Statistics for Educational Research
Education 309 – Statistics for Educational ResearchSzarah Blaisze
 
Quiz Game Presentation - Math 10/23.pptx
Quiz Game Presentation - Math 10/23.pptxQuiz Game Presentation - Math 10/23.pptx
Quiz Game Presentation - Math 10/23.pptxjayronniepranada2
 
Tabulation of Data, Frequency Distribution, Contingency table
Tabulation of Data, Frequency Distribution, Contingency tableTabulation of Data, Frequency Distribution, Contingency table
Tabulation of Data, Frequency Distribution, Contingency tableJagdish Powar
 
3_-frequency_distribution.pptx
3_-frequency_distribution.pptx3_-frequency_distribution.pptx
3_-frequency_distribution.pptxitzsudipto99
 
Frequency Distribution (Class-interval- Tally).pptx
Frequency Distribution (Class-interval- Tally).pptxFrequency Distribution (Class-interval- Tally).pptx
Frequency Distribution (Class-interval- Tally).pptxAlwinCAsuncion
 
Analysis and interpretation of Assessment.pptx
Analysis and interpretation of Assessment.pptxAnalysis and interpretation of Assessment.pptx
Analysis and interpretation of Assessment.pptxAeonneFlux
 
3. Descriptive statistics.pdf
3. Descriptive statistics.pdf3. Descriptive statistics.pdf
3. Descriptive statistics.pdfYomifDeksisaHerpa
 
Nota Bab 1 JF608
Nota Bab 1 JF608Nota Bab 1 JF608
Nota Bab 1 JF608Mira Awang
 
box plot or whisker plot
box plot or whisker plotbox plot or whisker plot
box plot or whisker plotShubham Patel
 
The Frequency distribution table.pptx
The Frequency distribution table.pptxThe Frequency distribution table.pptx
The Frequency distribution table.pptxmariadanielapereyra
 
Steps in Constructing a Frequency Distribution Table.pptx
Steps in Constructing a Frequency Distribution Table.pptxSteps in Constructing a Frequency Distribution Table.pptx
Steps in Constructing a Frequency Distribution Table.pptxPinakaShunga1
 
Group 3 measures of central tendency and variation - (mean, median, mode, ra...
Group 3  measures of central tendency and variation - (mean, median, mode, ra...Group 3  measures of central tendency and variation - (mean, median, mode, ra...
Group 3 measures of central tendency and variation - (mean, median, mode, ra...reymartyvette_0611
 
local_media4419196206087945469 (1).pptx
local_media4419196206087945469 (1).pptxlocal_media4419196206087945469 (1).pptx
local_media4419196206087945469 (1).pptxJayArRodriguez2
 
Statistical Methods: Quartile, Decile, Percentile.pptx
Statistical Methods: Quartile, Decile, Percentile.pptxStatistical Methods: Quartile, Decile, Percentile.pptx
Statistical Methods: Quartile, Decile, Percentile.pptxDr. Ramkrishna Singh Solanki
 
lesson-data-presentation-tools-1.pptx
lesson-data-presentation-tools-1.pptxlesson-data-presentation-tools-1.pptx
lesson-data-presentation-tools-1.pptxAnalynPasto
 

Similaire à Quartile Deviation (20)

Education 309 – Statistics for Educational Research
Education 309 – Statistics for Educational ResearchEducation 309 – Statistics for Educational Research
Education 309 – Statistics for Educational Research
 
LECTURE NO 7.pdf
LECTURE NO 7.pdfLECTURE NO 7.pdf
LECTURE NO 7.pdf
 
Quartile
QuartileQuartile
Quartile
 
Quiz Game Presentation - Math 10/23.pptx
Quiz Game Presentation - Math 10/23.pptxQuiz Game Presentation - Math 10/23.pptx
Quiz Game Presentation - Math 10/23.pptx
 
Quartile Deviation.pptx
Quartile Deviation.pptxQuartile Deviation.pptx
Quartile Deviation.pptx
 
Tabulation of Data, Frequency Distribution, Contingency table
Tabulation of Data, Frequency Distribution, Contingency tableTabulation of Data, Frequency Distribution, Contingency table
Tabulation of Data, Frequency Distribution, Contingency table
 
Assessment compiled
Assessment compiledAssessment compiled
Assessment compiled
 
3_-frequency_distribution.pptx
3_-frequency_distribution.pptx3_-frequency_distribution.pptx
3_-frequency_distribution.pptx
 
Frequency Distribution (Class-interval- Tally).pptx
Frequency Distribution (Class-interval- Tally).pptxFrequency Distribution (Class-interval- Tally).pptx
Frequency Distribution (Class-interval- Tally).pptx
 
Analysis and interpretation of Assessment.pptx
Analysis and interpretation of Assessment.pptxAnalysis and interpretation of Assessment.pptx
Analysis and interpretation of Assessment.pptx
 
3. Descriptive statistics.pdf
3. Descriptive statistics.pdf3. Descriptive statistics.pdf
3. Descriptive statistics.pdf
 
Nota Bab 1 JF608
Nota Bab 1 JF608Nota Bab 1 JF608
Nota Bab 1 JF608
 
box plot or whisker plot
box plot or whisker plotbox plot or whisker plot
box plot or whisker plot
 
Lecture 03.
Lecture 03.Lecture 03.
Lecture 03.
 
The Frequency distribution table.pptx
The Frequency distribution table.pptxThe Frequency distribution table.pptx
The Frequency distribution table.pptx
 
Steps in Constructing a Frequency Distribution Table.pptx
Steps in Constructing a Frequency Distribution Table.pptxSteps in Constructing a Frequency Distribution Table.pptx
Steps in Constructing a Frequency Distribution Table.pptx
 
Group 3 measures of central tendency and variation - (mean, median, mode, ra...
Group 3  measures of central tendency and variation - (mean, median, mode, ra...Group 3  measures of central tendency and variation - (mean, median, mode, ra...
Group 3 measures of central tendency and variation - (mean, median, mode, ra...
 
local_media4419196206087945469 (1).pptx
local_media4419196206087945469 (1).pptxlocal_media4419196206087945469 (1).pptx
local_media4419196206087945469 (1).pptx
 
Statistical Methods: Quartile, Decile, Percentile.pptx
Statistical Methods: Quartile, Decile, Percentile.pptxStatistical Methods: Quartile, Decile, Percentile.pptx
Statistical Methods: Quartile, Decile, Percentile.pptx
 
lesson-data-presentation-tools-1.pptx
lesson-data-presentation-tools-1.pptxlesson-data-presentation-tools-1.pptx
lesson-data-presentation-tools-1.pptx
 

Plus de Christian Sisles Gle

The Federal Government Supporting Childrn's Success
The Federal Government Supporting Childrn's  SuccessThe Federal Government Supporting Childrn's  Success
The Federal Government Supporting Childrn's SuccessChristian Sisles Gle
 
Discipline Techniques for Preschool Classroom
Discipline Techniques for Preschool ClassroomDiscipline Techniques for Preschool Classroom
Discipline Techniques for Preschool ClassroomChristian Sisles Gle
 
Discipline Techniques for Preschool Classroom
Discipline Techniques for Preschool ClassroomDiscipline Techniques for Preschool Classroom
Discipline Techniques for Preschool ClassroomChristian Sisles Gle
 
SCIENCE MATERIALS AND EQUIPMENTS INSIDE THE PRESCHOOL CLASSROOM (Part 2)
SCIENCE MATERIALS AND EQUIPMENTS INSIDE THE PRESCHOOL CLASSROOM (Part 2)SCIENCE MATERIALS AND EQUIPMENTS INSIDE THE PRESCHOOL CLASSROOM (Part 2)
SCIENCE MATERIALS AND EQUIPMENTS INSIDE THE PRESCHOOL CLASSROOM (Part 2)Christian Sisles Gle
 
SCIENCE MATERIALS AND EQUIPMENTS INSIDE THE PRESCHOOL CLASSROOM
SCIENCE MATERIALS AND EQUIPMENTS INSIDE THE PRESCHOOL CLASSROOMSCIENCE MATERIALS AND EQUIPMENTS INSIDE THE PRESCHOOL CLASSROOM
SCIENCE MATERIALS AND EQUIPMENTS INSIDE THE PRESCHOOL CLASSROOMChristian Sisles Gle
 
Computer as Information and Communication Technology
Computer as Information and Communication TechnologyComputer as Information and Communication Technology
Computer as Information and Communication TechnologyChristian Sisles Gle
 
Summary of Sigmund Freud’s Psychosexual Stages and erik Erikson's Psychosocia...
Summary of Sigmund Freud’s Psychosexual Stages and erik Erikson's Psychosocia...Summary of Sigmund Freud’s Psychosexual Stages and erik Erikson's Psychosocia...
Summary of Sigmund Freud’s Psychosexual Stages and erik Erikson's Psychosocia...Christian Sisles Gle
 
Theoretical Perspectives on Development
Theoretical Perspectives on DevelopmentTheoretical Perspectives on Development
Theoretical Perspectives on DevelopmentChristian Sisles Gle
 

Plus de Christian Sisles Gle (20)

God Works All Things For Good
God Works All Things For GoodGod Works All Things For Good
God Works All Things For Good
 
The Federal Government Supporting Childrn's Success
The Federal Government Supporting Childrn's  SuccessThe Federal Government Supporting Childrn's  Success
The Federal Government Supporting Childrn's Success
 
How To Use Positive Reinforcement
How To Use Positive ReinforcementHow To Use Positive Reinforcement
How To Use Positive Reinforcement
 
Discipline Techniques for Preschool Classroom
Discipline Techniques for Preschool ClassroomDiscipline Techniques for Preschool Classroom
Discipline Techniques for Preschool Classroom
 
Discipline Techniques for Preschool Classroom
Discipline Techniques for Preschool ClassroomDiscipline Techniques for Preschool Classroom
Discipline Techniques for Preschool Classroom
 
Teacher Exchange Programs
Teacher Exchange ProgramsTeacher Exchange Programs
Teacher Exchange Programs
 
Quartile Deviation
Quartile DeviationQuartile Deviation
Quartile Deviation
 
SCIENCE MATERIALS AND EQUIPMENTS INSIDE THE PRESCHOOL CLASSROOM (Part 2)
SCIENCE MATERIALS AND EQUIPMENTS INSIDE THE PRESCHOOL CLASSROOM (Part 2)SCIENCE MATERIALS AND EQUIPMENTS INSIDE THE PRESCHOOL CLASSROOM (Part 2)
SCIENCE MATERIALS AND EQUIPMENTS INSIDE THE PRESCHOOL CLASSROOM (Part 2)
 
The Four Pillars of Education
The Four Pillars of EducationThe Four Pillars of Education
The Four Pillars of Education
 
SCIENCE MATERIALS AND EQUIPMENTS INSIDE THE PRESCHOOL CLASSROOM
SCIENCE MATERIALS AND EQUIPMENTS INSIDE THE PRESCHOOL CLASSROOMSCIENCE MATERIALS AND EQUIPMENTS INSIDE THE PRESCHOOL CLASSROOM
SCIENCE MATERIALS AND EQUIPMENTS INSIDE THE PRESCHOOL CLASSROOM
 
Looking At The Teacher
Looking At The TeacherLooking At The Teacher
Looking At The Teacher
 
Computer as Information and Communication Technology
Computer as Information and Communication TechnologyComputer as Information and Communication Technology
Computer as Information and Communication Technology
 
Gestalt Psychology
Gestalt PsychologyGestalt Psychology
Gestalt Psychology
 
Identity Development
Identity DevelopmentIdentity Development
Identity Development
 
Quality Preschool Plan Goals
Quality Preschool Plan GoalsQuality Preschool Plan Goals
Quality Preschool Plan Goals
 
Athletics
AthleticsAthletics
Athletics
 
Systematic Appraoch to Teaching
Systematic Appraoch to TeachingSystematic Appraoch to Teaching
Systematic Appraoch to Teaching
 
The Balanced Approach
The Balanced ApproachThe Balanced Approach
The Balanced Approach
 
Summary of Sigmund Freud’s Psychosexual Stages and erik Erikson's Psychosocia...
Summary of Sigmund Freud’s Psychosexual Stages and erik Erikson's Psychosocia...Summary of Sigmund Freud’s Psychosexual Stages and erik Erikson's Psychosocia...
Summary of Sigmund Freud’s Psychosexual Stages and erik Erikson's Psychosocia...
 
Theoretical Perspectives on Development
Theoretical Perspectives on DevelopmentTheoretical Perspectives on Development
Theoretical Perspectives on Development
 

Dernier

HMCS Max Bernays Pre-Deployment Brief (May 2024).pptx
HMCS Max Bernays Pre-Deployment Brief (May 2024).pptxHMCS Max Bernays Pre-Deployment Brief (May 2024).pptx
HMCS Max Bernays Pre-Deployment Brief (May 2024).pptxEsquimalt MFRC
 
Application orientated numerical on hev.ppt
Application orientated numerical on hev.pptApplication orientated numerical on hev.ppt
Application orientated numerical on hev.pptRamjanShidvankar
 
Fostering Friendships - Enhancing Social Bonds in the Classroom
Fostering Friendships - Enhancing Social Bonds  in the ClassroomFostering Friendships - Enhancing Social Bonds  in the Classroom
Fostering Friendships - Enhancing Social Bonds in the ClassroomPooky Knightsmith
 
Salient Features of India constitution especially power and functions
Salient Features of India constitution especially power and functionsSalient Features of India constitution especially power and functions
Salient Features of India constitution especially power and functionsKarakKing
 
1029 - Danh muc Sach Giao Khoa 10 . pdf
1029 -  Danh muc Sach Giao Khoa 10 . pdf1029 -  Danh muc Sach Giao Khoa 10 . pdf
1029 - Danh muc Sach Giao Khoa 10 . pdfQucHHunhnh
 
General Principles of Intellectual Property: Concepts of Intellectual Proper...
General Principles of Intellectual Property: Concepts of Intellectual  Proper...General Principles of Intellectual Property: Concepts of Intellectual  Proper...
General Principles of Intellectual Property: Concepts of Intellectual Proper...Poonam Aher Patil
 
How to Give a Domain for a Field in Odoo 17
How to Give a Domain for a Field in Odoo 17How to Give a Domain for a Field in Odoo 17
How to Give a Domain for a Field in Odoo 17Celine George
 
Holdier Curriculum Vitae (April 2024).pdf
Holdier Curriculum Vitae (April 2024).pdfHoldier Curriculum Vitae (April 2024).pdf
Holdier Curriculum Vitae (April 2024).pdfagholdier
 
Jual Obat Aborsi Hongkong ( Asli No.1 ) 085657271886 Obat Penggugur Kandungan...
Jual Obat Aborsi Hongkong ( Asli No.1 ) 085657271886 Obat Penggugur Kandungan...Jual Obat Aborsi Hongkong ( Asli No.1 ) 085657271886 Obat Penggugur Kandungan...
Jual Obat Aborsi Hongkong ( Asli No.1 ) 085657271886 Obat Penggugur Kandungan...ZurliaSoop
 
Basic Civil Engineering first year Notes- Chapter 4 Building.pptx
Basic Civil Engineering first year Notes- Chapter 4 Building.pptxBasic Civil Engineering first year Notes- Chapter 4 Building.pptx
Basic Civil Engineering first year Notes- Chapter 4 Building.pptxDenish Jangid
 
Unit-IV; Professional Sales Representative (PSR).pptx
Unit-IV; Professional Sales Representative (PSR).pptxUnit-IV; Professional Sales Representative (PSR).pptx
Unit-IV; Professional Sales Representative (PSR).pptxVishalSingh1417
 
FSB Advising Checklist - Orientation 2024
FSB Advising Checklist - Orientation 2024FSB Advising Checklist - Orientation 2024
FSB Advising Checklist - Orientation 2024Elizabeth Walsh
 
The basics of sentences session 3pptx.pptx
The basics of sentences session 3pptx.pptxThe basics of sentences session 3pptx.pptx
The basics of sentences session 3pptx.pptxheathfieldcps1
 
UGC NET Paper 1 Mathematical Reasoning & Aptitude.pdf
UGC NET Paper 1 Mathematical Reasoning & Aptitude.pdfUGC NET Paper 1 Mathematical Reasoning & Aptitude.pdf
UGC NET Paper 1 Mathematical Reasoning & Aptitude.pdfNirmal Dwivedi
 
Kodo Millet PPT made by Ghanshyam bairwa college of Agriculture kumher bhara...
Kodo Millet  PPT made by Ghanshyam bairwa college of Agriculture kumher bhara...Kodo Millet  PPT made by Ghanshyam bairwa college of Agriculture kumher bhara...
Kodo Millet PPT made by Ghanshyam bairwa college of Agriculture kumher bhara...pradhanghanshyam7136
 
Explore beautiful and ugly buildings. Mathematics helps us create beautiful d...
Explore beautiful and ugly buildings. Mathematics helps us create beautiful d...Explore beautiful and ugly buildings. Mathematics helps us create beautiful d...
Explore beautiful and ugly buildings. Mathematics helps us create beautiful d...christianmathematics
 
2024-NATIONAL-LEARNING-CAMP-AND-OTHER.pptx
2024-NATIONAL-LEARNING-CAMP-AND-OTHER.pptx2024-NATIONAL-LEARNING-CAMP-AND-OTHER.pptx
2024-NATIONAL-LEARNING-CAMP-AND-OTHER.pptxMaritesTamaniVerdade
 
Introduction to Nonprofit Accounting: The Basics
Introduction to Nonprofit Accounting: The BasicsIntroduction to Nonprofit Accounting: The Basics
Introduction to Nonprofit Accounting: The BasicsTechSoup
 
Python Notes for mca i year students osmania university.docx
Python Notes for mca i year students osmania university.docxPython Notes for mca i year students osmania university.docx
Python Notes for mca i year students osmania university.docxRamakrishna Reddy Bijjam
 

Dernier (20)

HMCS Max Bernays Pre-Deployment Brief (May 2024).pptx
HMCS Max Bernays Pre-Deployment Brief (May 2024).pptxHMCS Max Bernays Pre-Deployment Brief (May 2024).pptx
HMCS Max Bernays Pre-Deployment Brief (May 2024).pptx
 
Application orientated numerical on hev.ppt
Application orientated numerical on hev.pptApplication orientated numerical on hev.ppt
Application orientated numerical on hev.ppt
 
Fostering Friendships - Enhancing Social Bonds in the Classroom
Fostering Friendships - Enhancing Social Bonds  in the ClassroomFostering Friendships - Enhancing Social Bonds  in the Classroom
Fostering Friendships - Enhancing Social Bonds in the Classroom
 
Salient Features of India constitution especially power and functions
Salient Features of India constitution especially power and functionsSalient Features of India constitution especially power and functions
Salient Features of India constitution especially power and functions
 
1029 - Danh muc Sach Giao Khoa 10 . pdf
1029 -  Danh muc Sach Giao Khoa 10 . pdf1029 -  Danh muc Sach Giao Khoa 10 . pdf
1029 - Danh muc Sach Giao Khoa 10 . pdf
 
General Principles of Intellectual Property: Concepts of Intellectual Proper...
General Principles of Intellectual Property: Concepts of Intellectual  Proper...General Principles of Intellectual Property: Concepts of Intellectual  Proper...
General Principles of Intellectual Property: Concepts of Intellectual Proper...
 
How to Give a Domain for a Field in Odoo 17
How to Give a Domain for a Field in Odoo 17How to Give a Domain for a Field in Odoo 17
How to Give a Domain for a Field in Odoo 17
 
Holdier Curriculum Vitae (April 2024).pdf
Holdier Curriculum Vitae (April 2024).pdfHoldier Curriculum Vitae (April 2024).pdf
Holdier Curriculum Vitae (April 2024).pdf
 
Jual Obat Aborsi Hongkong ( Asli No.1 ) 085657271886 Obat Penggugur Kandungan...
Jual Obat Aborsi Hongkong ( Asli No.1 ) 085657271886 Obat Penggugur Kandungan...Jual Obat Aborsi Hongkong ( Asli No.1 ) 085657271886 Obat Penggugur Kandungan...
Jual Obat Aborsi Hongkong ( Asli No.1 ) 085657271886 Obat Penggugur Kandungan...
 
Mehran University Newsletter Vol-X, Issue-I, 2024
Mehran University Newsletter Vol-X, Issue-I, 2024Mehran University Newsletter Vol-X, Issue-I, 2024
Mehran University Newsletter Vol-X, Issue-I, 2024
 
Basic Civil Engineering first year Notes- Chapter 4 Building.pptx
Basic Civil Engineering first year Notes- Chapter 4 Building.pptxBasic Civil Engineering first year Notes- Chapter 4 Building.pptx
Basic Civil Engineering first year Notes- Chapter 4 Building.pptx
 
Unit-IV; Professional Sales Representative (PSR).pptx
Unit-IV; Professional Sales Representative (PSR).pptxUnit-IV; Professional Sales Representative (PSR).pptx
Unit-IV; Professional Sales Representative (PSR).pptx
 
FSB Advising Checklist - Orientation 2024
FSB Advising Checklist - Orientation 2024FSB Advising Checklist - Orientation 2024
FSB Advising Checklist - Orientation 2024
 
The basics of sentences session 3pptx.pptx
The basics of sentences session 3pptx.pptxThe basics of sentences session 3pptx.pptx
The basics of sentences session 3pptx.pptx
 
UGC NET Paper 1 Mathematical Reasoning & Aptitude.pdf
UGC NET Paper 1 Mathematical Reasoning & Aptitude.pdfUGC NET Paper 1 Mathematical Reasoning & Aptitude.pdf
UGC NET Paper 1 Mathematical Reasoning & Aptitude.pdf
 
Kodo Millet PPT made by Ghanshyam bairwa college of Agriculture kumher bhara...
Kodo Millet  PPT made by Ghanshyam bairwa college of Agriculture kumher bhara...Kodo Millet  PPT made by Ghanshyam bairwa college of Agriculture kumher bhara...
Kodo Millet PPT made by Ghanshyam bairwa college of Agriculture kumher bhara...
 
Explore beautiful and ugly buildings. Mathematics helps us create beautiful d...
Explore beautiful and ugly buildings. Mathematics helps us create beautiful d...Explore beautiful and ugly buildings. Mathematics helps us create beautiful d...
Explore beautiful and ugly buildings. Mathematics helps us create beautiful d...
 
2024-NATIONAL-LEARNING-CAMP-AND-OTHER.pptx
2024-NATIONAL-LEARNING-CAMP-AND-OTHER.pptx2024-NATIONAL-LEARNING-CAMP-AND-OTHER.pptx
2024-NATIONAL-LEARNING-CAMP-AND-OTHER.pptx
 
Introduction to Nonprofit Accounting: The Basics
Introduction to Nonprofit Accounting: The BasicsIntroduction to Nonprofit Accounting: The Basics
Introduction to Nonprofit Accounting: The Basics
 
Python Notes for mca i year students osmania university.docx
Python Notes for mca i year students osmania university.docxPython Notes for mca i year students osmania university.docx
Python Notes for mca i year students osmania university.docx
 

Quartile Deviation

  • 1. Christian S. Gle BEEd 3rd – A QUARTILE DEVIATION Objectives: To present the procedures in getting the quartile deviation from ungrouped and grouped data. Subject Matter: Topic: Reference: Materials: Methodology: Measures of Variability - Quartile Deviation Educational Measurement and Evaluation pp. 97-99 power point presentation, chalkboard computation Lesson Content: Quantiles are the extensions of the median concept because they are values which divide a set of data into equal parts. a. Median – divides the distribution into two equal parts. b. Quartile – divides the distribution into four equal parts. c. Decile – divides the distribution into ten equal parts. d. Percentile – divides the distribution into one hundred equal parts. Quartiles are values in a given set of distribution that divide the data into four equal parts. Each set of scores has three quartiles. These values can be denoted by Q1, Q2 and Q3.  First quartile - Q1 (lower quartile) – The middle number between the smallest number and the median of the data set (25th Percentile).  Second quartile - Q2 – The median of the data that separates the lower and upper quartile (50th Percentile).  Third quartile - Q3 – (upper quartile) - The middle value between the median and the highest value of the data set (75th Percentile). The difference between the upper and lower quartiles is called the Interquartile range. (IQR = Q3-Q1) Quartile deviation or Semi-interquartile range is one-half the difference between the first and the third quartiles. (QD = Q3-Q1/2) Getting the Quartile Deviation from Ungrouped Data In getting the quartile deviation from ungrouped data, the following steps are used in getting the quartiles:
  • 2. 1. Arrange the test scores from highest to lowest. 2. Assign serial numbers to each score. The first serial number is assigned to the lowest test score, while the last serial number is assigned to the highest test score. 3. Determine the first quartile (Q1). To be able to locate Q1, divide N by 4. Use the obtained value in locating the serial number of the score that falls under Q1. 4. Determine the third quartile (Q3), by dividing 3N by 4. Locate the serial number corresponding to the obtained answer. Opposite this number is the test score corresponding to Q3. 5. Subtract Q1 from Q3 and divide the difference by 2. Consider the test scores in the table below: Score 17 17 26 27 30 30 31 37 = Serial Number 1 2 3 4 5 6 7 8 =2 Q1 = ( = 21.5 = =6 Q3 = ( N=8 = 30.5 QD = ( ) =( ) = 4.5 Getting the Quartile Deviation from Grouped Data In getting the quartile deviation from grouped data, the following steps are used in getting the quartiles: 1. Cumulate the frequencies from the bottom to the top of the grouped frequency distribution.
  • 3. 2. For the first quartile, use the formula Q1 =L + (i) where: L = exact lower limit if the Q1 class N/4 = locator of the Q1 class N = total number of scores CF = cumulative frequency below the Q1 class i = class size/interval 3. For the third quartile, use the formula Q3 = L + (i) where: L = exact lower limit if the Q3 class 3N/4 = locator of the Q3 class N = total number of scores CF = cumulative frequency below the Q3 class i = class size/interval Example: Computation of the Quartile Deviation for Grouped Test Scores Classes Frequency (f) Cumulative Frequency (CF) 46-50 41-45 36-40 31-35 26-30 21-25 16-20 11-15 5 7 9 10 8 6 4 4 53 48 41 32 33 14 8 4 N = 53 The computational procedures for determining the quartile deviation for grouped test scores are reflected in the above table. For the first quartile = = 13. 25 CF = 8 f = 6 L = 20.5 Q1 =L+ = 20. 5 + (i) (5)
  • 4. = 20. 5 + CF = 32 f = 9 L = 35.5 (5) Q3 = 20. 5 + = 25.75 (i) = 35.5 + = 35.5 + For the third quartile = =L+ (5) (5) = 35.5 + = 40.5 = 40.22 After obtaining the first and third quartiles, we can now compute QD. Thus QD = ( QD =( =( ) ) = 7.235 or 7.24 ).