
Recommandé
Recommandé
Contenu connexe
Tendances
Tendances (20)
Similaire à Chapman's Ice Cream Social Media Campaign 2017
Similaire à Chapman's Ice Cream Social Media Campaign 2017 (20)
Plus de Amandine Bula
Plus de Amandine Bula (12)
Dernier
Dernier (20)
Chapman's Ice Cream Social Media Campaign 2017
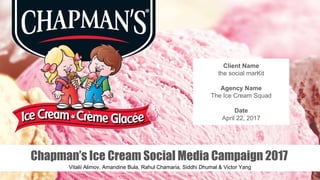
- 1. Chapman’s Ice Cream Social Media Campaign 2017 Vitalii Alimov, Amandine Bula, Rahul Chamaria, Siddhi Dhumal & Victor Yang Client Name the social marKit Agency Name The Ice Cream Squad Date April 22, 2017
- 2. Background ● Canada’s largest independent ice cream manufacturer ● Headquarter is located in Markdale, ON ● Today Chapman offers a wide range of 289 products ● Focuses on “For the kid in all of Us” ● First Co. to introduce ‘Peanut/Nut Free” red label on products “Ice cream goodness to every Canadian family” 2
- 3. SWOT Analysis 3 STRENGTHS WEAKNESSES ● Largest Canadian Ice Cream Manufacturer (competitive advantage over international brands). ● “Susan Daglish Award” for leadership and commitment to anaphylaxis safety. ● Chapman is a mono brand that have only one type of product to offer to wholesalers ● Lack of social media engagement OPPORTUNITIES THREATS ● Ice Cream market potential is going to increase from 2.54 billions to 2.74 billions in 2019 ● Canadian ice cream consumers are looking for items with lower calories , less sugar and portioned sizes. ● There is a decline of 4.95 litre in ice cream consumption in canada from 2004 - 2006 ● In 2016 fertility rate in Canada equalled to 1.61% ● International ice cream brands entering Canadian ice cream market
- 4. Objective 4 ● To build a social media community by gaining 113,000 combined followers on Facebook and Instagram ● To generate $344,960 trackable in-store sales across Canada (excluding Quebec) which are directly attributed by launching Facebook and Instagram campaign from May 1st to August 31st, 2017
- 5. Competitors Analysis 5 *Statista market share canada report Also confirmed by Dairy Facts and Figures from 2016 Sources: https://www.statista.com/statistics/475333/leading-take-home-brands-ice-cream-brands-by-market-share-canada/ http://www.dairyinfo.gc.ca/index_e.php?s1=dff-fcil&s2=proc-trans&s3=kp-pc
- 6. 6 Like 53,810 people 633,927 people 140,546 people Content Created content Few curated content Created content Mainly ads Created content Last Post March 4, 2017 August 1, 2016 August 28, 2016 Talking About* 239 people 401 people 75 people Highest Activity* February 2017 Summer 2016 Summer 2016 Reach* 129 wall posts 6,346 likes 1,489 comments 129 replies 127 wall posts 15,167 likes 1,382 comments 950 replies 88 wall posts 7,111 likes 739 comments 471 replies Sentiment* 90% Positive 52% Positive 55% Positive All the elements with a (*) are information found out through the Facebook analysis on Sysomos (02/22/2016-02/22/2017) Social Media Analysis
- 7. 7 Posts 104 523 210 Followers 1,271 50.3k 1,299 Content Created content Customers content Created content Created content Frequency 2-3 times/week Every week Every week Last Post March 5, 2017 March 7, 2017 23 weeks ago Social Media Analysis
- 8. Website Analysis 8 URL www.chapmans.ca www.breyers.ca www.haagen-dazs.ca Website Score 61.6 (Good) 63.6 (Good) 51.4 (Average) Ranking in Canada 32,224 79,197 107,405 HTML Title Tag “Welcome to Chapman’s Ice Cream” “Breyers” “Häagen-Dazs ice cream” Top Traffic Source Organic Organic Paid Advertising Landing Page Attributes No empty Alt attributes No empty Alt attributes 32 Alt attributes are empty.
- 9. Target Audiences - Primary 9 Age 25-65 Occupation Working professionals, Housewife’s Average income $71K - 91K Lifestyle Parents with kids and teens at home Geographic (Canada) Urban, suburban, rural Behaviours Unpredictable lifestyle, Driven around family responsibilities, Minimal leisure time
- 10. Target Audiences - Secondary 10 Age 18 - 24 Occupation Full-time College & University students working part-time Average income $ 9K -100K Lifestyle Individuals living on their own, away from family home Geographic (Canada) Urban, Suburban Behaviours College life, Active on Social media
- 11. Buyer Persona - Holly 11 Holly is a stay at home hockey mom. She is married and has two kids. She loves spending time with her family. Image Credit - www.prettyprudent.com
- 12. Communications Strategy What & Where? Social Media Campaign on Facebook & Instagram Why? Building Chapman’s an online community to generate $350K sales across Canada When? (3 phases) How & Who? Offer saving coupons, create engaging posts and present a “WOW” contest to our target audience March/April Pre-Campaign Content Creation May-Aug Online Campaign Management & Updates Sept/Oct Post-Campaign Measurement & Analysis 12
- 13. Online Campaign Timeline MAY JUNE JULY AUGUST W1 W2 W3 W4 W5 W6 W7 W8 W9 W10 W11 W12 W13 W14 W15 W16 W17 W18 SOCIAL MEDIA CAMPAIGN $$$ $$$ $$$ SKI CONTEST 13
- 14. Barbeque Video When & Where? May 1st, on Facebook & Instagram Scenario A barbeque with the Chapman family & their neighbors the Donalson Estimate Budget $10,000 14
- 15. Ski Contest 15 Start & End Dates July 16 9:00AM August 16 11:59PM Winner Announcement August 30 3:00PM Prize Family trip for 5 Days/4 Nights in Whistler, BC Technicality Hootsuite Sweepstakes on Facebook Estimate Budget $15,000
- 16. Content Samples 16 Penny & David Adventures - Tuesday Bring Chapman’s mascots alive Snippet of their lives, tastes, personalities Fun Fact - Friday Facts about ice cream or the company Turnover between Penny & David
- 17. Content Samples 17 Engagement Post - Wednesday Short question Vote with an emoji
- 18. Content Samples 18 Engagement Post - Friday Long question Get inspired by the audience
- 19. Content Samples 19 Shout Out Saturday Showcase the audience picture Contest “Tag Chapman’s”
- 20. Content Samples 20 Yummy Sunday Step-by-step 1-minute video Similar to Tasty Recipe made with Chapman’s product
- 21. Content Samples 21 Celebration Content Food Day Celebration Day Holidays
- 22. Content Samples 22 Celebration Content Food Day Celebration Day Holidays
- 23. Content Samples 23 Curated Content Monday & Thursday BuzzSumo
- 24. Budget 24 Pre Campaign Post March/April May June July August Sep/Oct $11,163 $42,906 $45,906 $74,491 $75,856 $593 Total : $251,915 95% Total Budget $250,000
- 25. Budget 25
- 26. Coupons & Facebook Ads 26 MAY JUNE JULY AUGUST W1 W2 W3 W4 W5 W6 W7 W8 W9 W10 W11 W12 W13 W14 W15 W16 W17 W18 SOCIAL MEDIA CAMPAIGN $$$ Analysis $$$ Analysis $$$ Analysis SKI CONTEST $1 off coupons Coupon Code + Contest
- 27. Coupons, Ads & SEM 27 Keyword Group Clicks/Keyword Total Spent Chapman’s, Ice cream, Frozen dessert etc. 100 $19,928.80 Monthly spending on Coupons and Facebook/Instagram Ads Months Total Number of Coupons Coupon Spending Facebook/Instagram Spending May 19,164 $ 19,164.00 $ 12,000.00 June 19,164 $ 19,164.00 $ 15,000.00 July 28,749 $ 28,749.00 $ 30,000.00 August 19,164 $ 19,164.00 $ 20,000.00 Total 86,241 $ 86,241.00 $ 77,000.00
- 28. Social Platforms Goals 28 Pre Campaign 53,825 Likes 1,284 Followers Post Campaign 156,800 Likes 11,200 Followers Avg. Engagement Rate 1% 4.21% BENCHMARKS ● 70% positive sentiment ● 20% Unique visitors ● 1.6% CTR ● 156,800 coupons download ● Bounce Rate - below 30%
- 30. Recommendations 30 ● The video ● Post daily ● Original and curated content ● Facebook and Instagram stories ● Food & celebration days ● Sysomos and Hootsuite Content
- 31. Recommendations 31 Measurement ● Analyze the outcome of published content ● Track website traffic using Google Analytic ● Adjust the bids according to the results of the Facebook Ads ● Calculate the frequency of downloaded and redeemed coupons Website ● Add button under “Connect with Us” ● Make website layout more user friendly
- 32. Roll-Out Plan Rollout Campaign Plan Due Date Campaign Start May June July Campaign End August Q1 Q2 Q3 Q4 Q1 Q2 Q3 Q4 Q1 Q2 Q3 Q4 Q1 Q2 Q3 Q4 Campaign Launch 1 May 1st wave of Coupons 1 May 2nd wave of Coupons 1 June Last wave of Coupons 16 July Gather all coupons and draw the winner 16 Aug Winner announcement 16 Aug End of campaign 31 Aug
- 33. 33 Thank you!