Accounting For Management Unit 4
•Télécharger en tant que DOCX, PDF•
6 j'aime•1,804 vues

UNIT - IV: COST CONCEPTS: Classification of costs - Direct and Indirect expenses- Cost Sheet - Unit Costing - Job Costing - Mechanics & Application of Marginal Costing in terms of cost control - Profit Planning - concept of CVP relationship; BEP and their applications.

Recommandé
Contenu connexe
Tendances
Tendances (20)
Similaire à Accounting For Management Unit 4
Similaire à Accounting For Management Unit 4 (20)
Plus de Amit Sarkar
Plus de Amit Sarkar (20)
Dernier
Dernier (20)
Accounting For Management Unit 4
- 1. UNIT - IV: COST CONCEPTS: Classification of costs - Direct and Indirect expenses- Cost Sheet - Unit Costing - Job Costing - Mechanics & Application of Marginal Costing in terms of cost control - Profit Planning - concept of CVP relationship; BEP and their applications. Elements of Cost The elements of costs are the essential part of the cost. There are broadly three elements of cost, as explained below: (A) Material The substance from which the produce is made is called material. It can be direct as well as indirect. I) Direct Material: It refers to those materials which become an integral part of the final productand can be easily traceable to specific physical units. e.g., carton, wrapping, card-board boxes etc.). II) Indirect Material: All materials which are used for purpose ancillary to the business and which cannot conveniently be assigned to specific physical units are known as `indirect materials’. Oil, grease, consumable stores, printing and stationery material etc. Are a few examples of indirect materials? (b) Labour In order to convert materials into finished products, human effort is required. Such human effort is known as labour. Labour can be direct as well as indirect. I) Direct Labour: It is defined as the wages paid to workers who are engaged in the production process and whose time can be conveniently and economically traceable to specific physical units.e.g., wages paid to driver, conductoretc. Of a bus in transport service. Indirect Labour: Labour employed for the purpose of carrying out tasks Incidental to goods produced or services provided is called indirect labour or indirect wages. Wages which cannot be directly identified with a job, process or operation, are generally treated as indirect wages. Examples of indirect labour are: wages of store-keepers, foremen, supervisors, inspectors, internal transport men etc. (C) Expenses Expenses may be direct or indirect. I) Direct Expenses:
- 2. These are expenses which can be directly, conveniently and wholly identifiable with a job, process oroperation. Examples of such expenses are: cost of special layout, design or drawings, hire of special machinery required for a particular contract, maintenance cost of special tools needed for a contract job, etc. Ii) Indirect Expenses: Expenses which cannot be charged to production directly and which are neither indirect materials nor indirect wages are known as indirect expenses. Examples are rent, rates and taxes, insurance, depreciation, repairs and maintenance, power, lighting and heating etc. Overheads The term overheads includes, indirect material, indirect labour and indirect expenses, explained in the preceding paragraphs. Overheads may be incurred in the factory, office or selling and distribution departments/divisions in an undertaking. Thus overheads may be of three types: Factory overheads Office and administrative overheads and Selling and distribution overheads. CLASSIFICATION (OR) TYPES OF COSTS Cost may be classified into different categories depending upon the purpose of classification. Some of the important categories in which the costs are classified are as follows: 1. Fixed, Variable and Semi-Variable Costs The cost which varies directly in proportion with every increase or decrease in the volume of output or productionis known as variable cost. Some of its examples are as follows: · Wages of laborers · Costof direct material · Power The cost which does not vary but remains constant within a given period of time and a range of activity in spite of the fluctuations in production is known as fixed cost. Some of its examples are as follows: · Rent or rates · Insurance charges
- 3. · Management salary The cost which does not vary proportionately but simultaneously does not remain stationary at all times is known as semi-variable cost. It can also be named as semi-fixed cost. Some of its examples are as follows: · Depreciation · Repairs Fixed costs are sometimes referred to as “period costs” and variable costs as “direct costs” in system of direct costing. Fixed costs canbe further classified into: · Committed fixed costs · Discretionary fixed costs Committed fixed costs consist largely of those fixed costs that arise from the possession of plant, equipment and a basic organization structure. For example, once a building is erected and a plant is installed, nothing much can be done to reduce the costs such as depreciation, property taxes, insurance and salaries of the key personnel etc. without impairing an organization’s competence to meet the long-term goals. Discretionary fixed costs are those which are set at fixed amount for specific time periods by the management in budgeting process. These costs directly reflect the top management policies and have no particular relationship with volume of output. These costs can, therefore, be reduced or entirely eliminated as demanded by the circumstances. Examples of such costs are research and development costs, advertising and sales promotion costs, donations, management consulting fees etc. These costs are also termed as managed or programmed costs. In some circumstances, variable costs are classified into the following: · Discretionary cost · Engineered cost The term discretionary costs is generally linked with the class of fixed cost. However, in the circumstances where management has predetermined that the organization would spend a certain percentage of its sales for the items like research, donations, sales promotion etc., discretionary costs will be of a variable character. Engineered variable costs are those variable costs which are directly related to the production or sales level. These costs exist in those circumstances where specific relationship exists between input and output. Forexample, in an automobile industry there may be exact specifications as one radiator, two fan belts, one battery etc. would be required for one car. In a case where more than one car is to be produced, various inputs will have to be increased in the direct proportionof the output. Thus, an increase in discretionary variable costs is due to the authorization of management whereas an increase in engineered variable costs is due to the volume of output or sales. 2. Product Costs and PeriodCosts The costs which are a part of the cost of a product rather than an expense of the period in which they are incurred are called as “product costs.” They are included in inventory values. In financial statements, such costs are treated as assets until the goods they are
- 4. assigned to are sold. They become an expense at that time. These costs may be fixed as well as variable, e.g., cost of raw materials and direct wages, depreciation on plant and equipment etc. The costs which are not associated with production are called period costs. They are treated as an expense of the period in which they are incurred. They may also be fixed as well as variable. Such costs include general administration costs, salaries salesmen and commission, depreciation on office facilities etc. They are charged against the revenue of the relevant period. Differences between opinions exist regarding whether certain costs should be considered as product or period costs. Some accountants feel that fixed manufacturing costs are more closely related to the passage of time than to the manufacturing of a product. Thus, according to them variable manufacturing costs are product costs whereas fixed manufacturing and other costs are period costs. However, their view does not seem to have been yet widely accepted. 3. Directand Indirect Costs The expenses incurred on material and labor which are economically and easily traceable for a product, service or jobs are considered as direct costs. In the process of manufacturing of production of articles, materials are purchased, laborers are employed and the wages are paid to them. Certain other expenses are also incurred directly. All of these take an active and direct part in the manufacture of a particular commodity and hence are called direct costs. The expenses incurred on those items which are not directly chargeable to production are known as indirect costs. For example, salaries of timekeepers, storekeepers and foremen. Also certain expenses incurred for running the administration are the indirect costs. All of these cannot be conveniently allocated to production and hence are called indirect costs. 4. Decision-Making Costs andAccounting Costs Decision-making costs are special purpose costs that are applicable only in the situation in which they are compiled. They have no universal application. They need not tie into routine-financial accounts. They do not and should not conform the accounting rules. Accounting costs are compiled primarily from financial statements. They have to be altered before they can be used for decision-making. Moreover, they are historical costs and show what has happened under an existing set of circumstances. Decision-making costs are future costs. They represent what is expected to happen under an assumed set of conditions. For example, accounting costs may show the cost of a product when the operations are manual whereas decision-making cost might be calculated to show the costs when the operations are mechanized. 5. Relevantand Irrelevant Costs Relevant costs are those which change by managerial decision. Irrelevant costs are those which do not get affected by the decision. For example, if a manufacturer is planning to close down an unprofitable retail sales shop, this will affect the wages payable to the workers of a shop. This is relevant in this connection since they will disappear on closing
- 5. down of a shop. But prepaid rent of a shop or unrecovered costs of any equipment which will have to be scrapped are irrelevant costs which should be ignored. 6. Shutdown and Sunk Costs A manufacturer or an organization may have to suspend its operations for a period on account of some temporary difficulties, e.g., shortage of raw material, non-availability of requisite labor etc. During this period, though no work is done yet certain fixed costs, such as rent and insurance of buildings, depreciation, maintenance etc., for the entire plant will have to be incurred. Such costs ofthe idle plant are known as shutdown costs. Sunk costs are historical or past costs. These are the costs which have been created by a decision that was made in the past and cannot be changed by any decision that will be made in the future. Investments in plant and machinery, buildings etc. are prime examples of such costs. Since sunk costs cannot be altered by decisions made at the later stage, they are irrelevant for decision-making. An individual may regret for purchasing or constructing an asset but this action could not be avoided by taking any subsequent action. Of course, an asset can be sold and the cost of the asset will be matched against the proceeds from sale of the asset for the purpose of determining gain or loss. The person may decide to continue to own the asset. In this case, the cost of asset will be matched against the revenue realized over its effective life. However, he/she cannot avoid the cost which has already been incurred by him/her for the acquisition of the asset. It is, as a matter of fact, sunk cost for all present and future decisions. Example Jolly Ltd. purchased a machine for $. 30,000. The machine has an operating life of five yea$ without any scrap value. Soon after making the purchase, management feels that the machine should not have been purchased since it is not yielding the operating advantage originally contemplated. It is expected to result in savings in operating costs of $. 18,000 over a period of five years. The machine can be sold immediately for $. 22,000. To take the decision whether the machine should be sold or be used, the relevant amounts to be compared are $. 18,000 in cost savings over five yea$ and $. 22,000 that can be realized in case it is immediately disposed. $. 30,000 invested in the asset is not relevant since it is same in both the cases. The amount is the sunk cost. Jolly Ltd., therefore, sold the machinery for $. 22,000 since it would result in an extra profit of $. 4,000 as compared to keeping and using it. 7. Controllable and Uncontrollable Costs Controllable costs are those costs which can be influenced by the ratio or a specified member of the undertaking. The costs that cannot be influenced like this are termed as uncontrollable costs. A factory is usually divided into a number of responsibility centers, each of which is in charge of a specific level of management. The officer in charge of a particular department can control costs only of those matte$ which come directly under his control, not of other matte$. For example, the expenditure incurred by tool room is controlled by the foreman in
- 6. charge of that section but the share of the tool room expenditure which is apportioned to a machine shop cannot be controlled by the foreman of that shop. Thus, the difference between controllable and uncontrollable costs is only in relation to a particular individual or level of management. The expenditure which is controllable by an individual may be uncontrollable by another individual. 8. Avoidable or Escapable Costs and Unavoidable or Inescapable Costs Avoidable costs are those which will be eliminated if a segment of a business (e.g., a product or department) with which they are directly related is discontinued. Unavoidable costs are those which will not be eliminated with the segment. Such costs are merely reallocated if the segment is discontinued. For example, in case a product is discontinued, the salary of a factory manager or factory rent cannot be eliminated. It will simply mean that certain other products will have to absorb a large amount of such overheads. However, the salary of people attached to a product or the bad debts traceable to a product would be eliminated. Certain costs are partly avoidable and partly unavoidable. For example, closing of one department of a store might result in decrease in delivery expenses but not in their altogether elimination. It is to be noted that only avoidable costs are relevant for deciding whether to continue or eliminate a segment of a business. 9. Imputed or Hypothetical Costs These are the costs which do not involve cash outlay. They are not included in cost accounts but are important for taking into consideration while making management decisions. For example, interest on capital is ignored in cost accounts though it is considered in financial accounts. In case two projects require unequal outlays of cash, the management should take into consideration the capital to judge the relative profitability of the projects. 10. Differentials, Incremental or DecrementCost The difference in total cost between two alternatives is termed as differential cost. In case the choice of an alternative results in an increase in total cost, such increased costs are known as incremental costs. While assessing the profitability of a proposed change, the incremental costs are matched with incremental revenue. This is explained with the following example: Example A company is manufacturing 1,000 units of a product. The present costs and sales data are as follows: Selling price per unit $. 10 Variable costper unit $. 5 Fixed costs $. 4,000 The management is considering the following two alternatives: i. To accept an export order for another 200 units at $. 8 per unit. The expenditure of the export order will increase the fixed costs by $. 500.
- 7. ii. To reduce the production from present 1,000 units to 600 units and buy another 400 units from the market at $. 6 per unit. This will result in reducing the present fixed costs from $. 4,000 to $. 3,000. Which alternative the management should accept? Solution Statement showing profitability under different alternatives is as follows: Particulars Present situation $. $. Proposed situations Sales. Less: Variable purchase costs Fixed costs Profit 5,000 4,000 10,000 9,000 1,000 6,000 4,500 11,600 10,500 1,100 5,400 3,000 10,000 8,400 1,600 Observations i. In the present situation, the company is making a profit of $. 1,000. ii. In the proposed situation (i), the company will make a profit of $. 1,100. The incremental costs will be $. 1,500 (i.e. $. 10,500 - $. 9,000) and the incremental revenue (sales) will be $. 1,600. Hence, there is a net gain of $. 100 under the proposed situation as compared to the existing situation. iii. In the proposed situation (ii), the detrimental costs are $. 600 (i.e. $. 9,000 to $. 8,400) as there is no decrease in sales revenue as compared to the present situation. Hence, there is a net gain of $. 600 as compared to the present situation. Thus, under proposal (ii), the company makes the maximum profit and therefore it should adoptalternative (ii). The technique of differential costing which is based on differential cost is useful in planning and decision-making and helps in selecting the best alternative. In case the choice results in decrease in total costs, this decreased cost will be known as detrimental costs. 11. Out-of-PocketCosts Out-of-pocket cost means the present or future cash expenditure regarding a certain decision that will vary depending upon the nature of the decision made. For example, a company has its own trucks for transporting raw materials and finished products from one place to another. It seeks to replace these trucks by keeping public carriers. In making this decision, of course, the depreciation of the trucks is not to be considered but the management should take into account the present expenditure on fuel, salary to drive$ and maintenance. Such costs are termed as out-of-pocketcosts. 12. Opportunity Cost
- 8. Opportunity cost refers to an advantage in measurable terms that have foregone on account of not using the facilities in the manner originally planned. For example, if a building is proposed to be utilized for housing a new project plant, the likely revenue which the building could fetch, if rented out, is the opportunity cost which should be taken into account while evaluating the profitability of the project. Suppose, a manufacturer is confronted with the problem of selecting anyone of the following alternatives: a. Selling a semi-finished productat $. 2 per unit b. Introducing it into a further process to make it more refined and valuable Alternative (b) will prove to be remunerative only when after paying the cost of further processing, the amount realized by the sale of the product is more than $. 2 per unit. Also, the revenue of $. 2 per unit is foregone in case alternative (b) is adopted. The term “opportunity cost”refers to this alternative revenue foregone. 13. Traceable, Untraceable orCommon Costs The costs that can be easily identified with a department, process or product are termed as traceable costs. For example, the cost of direct material, direct labor etc. The costs that cannot be identified so are termed as untraceable or common costs. In other words, common costs are the costs incurred collectively for a number of cost centers and are to be suitably apportioned for determining the cost of individual cost centers. For example, overheads incurred for a factory as a whole, combined purchase cost for purchasing several materials in one consignment etc. Joint cost is a kind of common cost. When two or more products are produced out of one material or process, the cost of such material or process is called joint cost. For example, when cottonseeds and cotton fibers are produced from the same material, the cost incurred till the split-off or separation point will be joint costs. 14. Production, Administration and Selling and Distribution Costs A business organization performs a number of functions, e.g., production, illustration, selling and distribution, research and development. Costs are to be curtained for each of these functions. The Chartered Institute of Management accountants, London, have defined each of the above costs as follows: i. Production Cost The cost of sequence of operations which begins with supplying materials, labor and services and ends with the primary packing of the product. Thus, it includes the cost of direct material, direct labor, direct expenses and factory overheads. ii. Administration Cost The cost of formulating the policy, directing the organization and controlling the operations of an undertaking which is not related directly to a production, selling, distribution, research or development activity or function. iii. Selling Cost It is the cost of selling to create and stimulate demand (sometimes termed as marketing) and of securing orders. iv. Distribution Cost
- 9. It is the cost of sequence of operations beginning with making the packed product available for dispatch and ending with making the reconditioned returned empty package, if any, available for reuse. v. ResearchCost It is the cost of searching for new or improved products, new application of materials, or new or improved methods. vi. DevelopmentCost The cost of process which begins with the implementation of the decision to produce a new or improved product or employ a new or improved method and ends with the commencement of formal productionof that productor by the method. vii. Pre-ProductionCost The part of development cost incurred in making a trial production as preliminary to formal production is called pre-production cost. 15. ConversionCost The cost of transforming direct materials into finished products excluding direct material cost is known as conversion cost. It is usually taken as an aggregate of total cost of direct labor, direct expenses and factory overheads. COST SHEET PROFORMA OF COST SHEET PARTICULARS TOTALCOST Rs. TOTAL COST Rs. Opening stock Raw Materials Add: Purchase Add: carriage inward Add:octroi and customs duty Less: closing stock of raw materials Cost of direct material consumed Add: direct wages Prime cost Add: works of factory overheads Indirect materials Indirect wages Leave wages Bonus to workers Overtime wages Fuel and power Rent and taxes
- 10. Insurance Factory lightings Supervision Works stationery Canteen and welfare expenses Repairs Works salaries Depreciation of plant and machinery Work expenses Gas and water Technical directors fees Laboratory expenses Works transport expenses Works telephone expenses Add: opening stock of work- in- progress Less: closing stock of work-in-progress Less: sale of waste (scrap) Works cost Add: Office and Administration Overheads Office salaries Directors fees Office rents and rates Office stationery and printing Sundry office expenses Depreciation on office furniture Subscription to trade journals Office lightings Establishment charges Directors travelling expenses Consultants fees Contribution to provident fund Postage Legal charges Audit fees Bank charges Audit fees Depreciatiom&repairs of office equipments Bonus to staff Cost of production
- 11. Add: opening stock of finished goods Less: closing stock of finished goods Cost of goods sold Add: Selling &Distribution overheads Advertising Show room expenses Salesman’s salaries and expenses Carriage outward Commission of sales agents Cost of catalogues Expenses o delivery vans Collection charges Travelling expenses Cost of tenders Warehouse expenses Cost of mailing literature Sales mangers salaries Insurance of showroom Sale directors fees Sales office expenses Rent of sales office Depreciation of delivery vans Expenses of sales branch establishments Branch office expenses TOTAL COST OF SALES PROFIT OR LOSS SALES NON COST ITEMS Non – costitems re those items which do not form part of costof a product. Such items should not be considered while ascertaining the costof a product. These are items included in the profit & loss A/C. These will not come in the costsheet a) Income tax paid b) Interest on capital c) Interest on loan d) profit/loss on sale of fixed assets e) Donations f) Capital expenditure
- 12. g) Discount on shares &debentures h) Commission to partners, managers etc i) Brokerage j) Preliminary expenses written off. k) Wealth tax etc Problem The following figures have been extracted from the records of a manufacturing company for the year ending 31st December 2008. You are required to prepare a statement of cost showing: 1. Cost of raw materials consumed. 2. Prime cost 3. Factory cost 4. Cost of production 5. Cost of goods sold 6. Total costof goods sold and profit on sales. Rs: Stockof raw materials ( 1-1-2008) 3000 Stockof raw materials ( 31-12-2008) 2400 Purchase of Raw materials 14000 Stockof work in progress (1-1- 2008) 1000 Stockof work in progress (31-12- 2008) 800 Carriage inward 500 Manufacturing wages 4000 Other direct expenses 200 Experiment expenses 400
- 13. Wastage of materials 500 Factory overheads 7000 Indirect wages 1000 Establishment on cost 2000 Selling overhead 4000 Distribution overhead 1000 Stockof finished goods(1-1-2008) 1200 Stockof finished goods(31-12-2008) 3000 Sales 4000 Costsheetfor the period of 31-12-2008 Particulars Rs Rs Opening stockof raw materials 3000 Add:- Purchase of raw materials 14000 (3000+14000) 17000 Less:- closing stockof raw materials 2400 Materials Consumed (17000-2400) 14600 Add:- Carriage Inwards 500 Manufacturing Wages 4000 Other Direct Expenses 200 Prime Cost(14600+500+4000+200) 19300 Add:- Factory Overheads:- Factory Overheads 7000 Indirect Wages 400 Experiment Expenses 1000 Wastage of Materials 50 Work cost Total(7000+400+1000+50) 8450 Add:- Openining work in progress 1000 9450 Less: Closing work in progress 800 8650 Work Cost/ FactoryCost 27950
- 14. Add:- Office and Administration over head:- Establishment Cost 2000 2000 Costof Production 29950 Add:- Opening stockof finished goods 1200 Less:- closing stockof finished goods 3000 (-)1800 Costof Goods Sold 28150 Add:- Selling overheads 4000 32150 Add:- Distribution overhead 1000 Total Cost/ Costof Sales 33150 Profit( Balancing Figure) 6850 Sales 40000 Components of total cost:- Prime Cost Factory Cost/Work Cost Office Cost/ Cost of production Cost of sale Total Cost Prime Cost ( First Cost/ Basic Cost) Direct Material Cost Direct Labor Cost Direct Expenses Prime Cost = Direct Material Cost+ Direct Labor Cost+ Direct Expenses Factory Cost or Works Cost Factory Overheads
- 15. Indirect Materials cost – Repairs and maintenance Indirect Labor cost- Salaries for supervisors/factory employees Indirect Expenses- Rent Taxes, Electricity etc Factory Cost= Prime Cost+ factory or works Overheads Office Cost/ Cost of Production Office Overheads Indirect Materials cost- Ex: (Office Stationary) Indirect Labor cost- (Salaries for Office employees) Indirect Expenses- Bank charges, Telephone charges etc Office Cost= Work Cost+ Office and Administrative Overheads Cost of sale/ total cost Selling and distribution overheads Indirect Materials cost- Ex: (Advertising Expenses, sales promotions) Indirect Labor cost- (Salesman Salary) Indirect Expenses- Warehouse, freight, fitting, heating, lighting of warehouse etc Marginal Costing: Marginal Cost: The term Marginal Cost refers to the amount at any given volume of output by which the aggregate costs are charged if the volume of output is changed by one unit. Accordingly, it means that the added or additional costofan extra unit of output. Marginal cost may also be defined as the "cost of producing one additional unit of product." Thus, the concept marginal cost indicates wherever there is a change in the volume of output; certainly there will be some change in the total cost. It is concerned with the changes in variable costs. Fixed cost is treated as a period cost and is transferred to Profit and Loss Account.
- 16. Marginal Costing: Marginal Costing may be defined as "the ascertainment by differentiating between fixed cost and variable cost, of marginal cost and of the effect on profit of changes in volume or type of output." With marginal costing procedure costs are separated into fixed and variable cost. According to J. Batty, Marginal costing is "a technique of cost accounting pays special attention to the behavior of costs with changes in the volume of output." This definition lays emphasis on the ascertainment of marginal costs and also the effect of changes in volume or type of output on the company's profit. FEATURES OF MARGINAL COSTING (1) All elements of costs are classified into fixed and variable costs. (2) Marginal costing is a technique of costcontroland decision making. (3) Variable costs are charged as the costof production. (4) Valuation of stock of work in progress and finished goods is done on the basis of variable costs. (5) Profit is calculated by deducting the fixed cost from the contribution, i.e., excess of selling price over marginal costof sales. (6) Profitability of various levels of activity is determined by costvolume profit analysis. Mechanics ofMarginalCosting: The Following are the main important equations of Marginal Cost: Sales = Variable Cost+ Fixed Expenses ± Profit I Loss (or) Sales - Variable Cost= Fixed Cost± Profit or Loss (or) Sales - Variable Cost= Contribution Contribution = Fixed Cost+ Profit Contribution The term Contribution refers to the difference between Sales and Marginal Cost of Sales. It also termed as "Gross Margin." Contribution enables to meet fixed costs and profit. Thus, contribution will first covered fixed cost and then the balance amount is added to Net profit. Contribution can be represented as: Contribution = Sales - Marginal Cost Contribution = Sales - Variable Cost Contribution = Fixed Expenses + Profit
- 17. Contribution - Fixed Expenses = Profit Sales - Variable Cost= Fixed Cost+ Profit METHODS OF COSTING The basic principles of ascertaining costs are the same in every system of cost accounting. However, the methods of analyzing and presenting the cost may vary from industry to industry. The method to be used in collecting and presenting costs will depend upon the nature of production. Basically there are two methods of costing, namely. Job costing and Process costing. Job costing: Job costing is used where production is not repetitive and is done against orders. The work is usually carried out within the factory. Each job is treated as a distinct unit, and related costs are recorded separately. This type of costing is suitable to printers, machine tool manufacturers, job foundries, furniture manufactures etc. The following methods are commonly associated with job costing: Batch costing: Where the cost of a group of product is ascertained, it is called 'batch costing'. In this case a batch of similar products is treated as a job. Costs are collected according to batch order number and the total cost is divided by the numbers in a batch to find the unit cost of each product. Batch costing is generally followed in general engineering factories which produce components in convenient batches, biscuit factories, bakeries and pharmaceutical industries. Contract costing: A contract is a big job and, hence, takes a longer time to complete. For each individual contract, account is kept to record related expenses in a separate manner. It is usually followed by concerns involved in construction work e.g. building roads, bridge and buildings etc. Process Costing: Where an article has to undergo distinct processes before completion, it is often desirable to find out the cost of that article at each process. A separate account for each process is opened and all expenses are charged thereon. The cost of the product at each stage is, thus, accounted for. The output of one process becomes the input to the next process. Hence, the process cost per unit in different processes is added to find out the total cost per unit at the end. Process costing is often found in such industries as chemicals, oil, textiles, plastics, paints, rubber, food processors, flour, glass, cement, mining and meat packing. The following methods are used in process costing:
- 18. Output/Unit Costing: This method is followed by concerns producing a single article or a few articles which are identical and capable of being expressed in simple, quantitative units. This is used in industries like mines, quarries, oil drilling, cement works, breweries, brick works etc. for example, a tonne of coal in collieries, one thousand bricks in brick works etc. The object here is to find out the cost per unit of output and the cost of each item of such cost. A cost sheet is prepared for a definite period. The cost per unit is calculated by dividing the total expenditure incurred during a given period by the number of units produced during the same period. Operating Costing: This method is applicable where services are rendered rather than goods produced. The procedure is same as in the case of unit costing. The total expenses of the operation are divided by the units and cost per unit of service is arrived at. This is followed in transport undertakings, municipalities, hospitals, hotels etc. Multiple Costing: Some products are so complex that no single system of costing is applicable. Where a concern manufactures a number of components to be assembled into a complete article, no one method would be suitable, as each component differs from the other in respect of materials and the manufacturing process. In such cases, it is necessary to find out the cost of each component and also the final product by combining the various methods discussed above. This type of costing is followed to cost such products as radios, airplanes, cycles, watches, machine tools, refrigerators, electric motors etc. Operating Costing: In this method each operation at each stage of production or process is separately identified and costed. The procedure is somewhat similar to the one followed in process costing. Process costing involves the costing of large areas of activity whereas operation costing is confined to every minute operation of each process. This method is followed in industries with a continuous flow of work, producing articles of a standard nature, and which pass through several distinct operations in a sequence to completion. Since this method provides for a minute analysis of cost, it ensures greater accuracy and better control of costs. The costs of each operation per unit and cost per unit upto each stage of operation can be calculated quite easily. This method is in force in industries where toys, leather and engineering goods are manufactured. Departmental Costing: When costs are ascertained department by department, such a method is called 'departmental costing'. Where the factory is divided into a number of departments, this method is followed. The total cost of each department is ascertained and
- 19. divided by the total units produced in that department in order to obtain the cost per unit. This method is followed by departmental stores, publishing houses etc. TECHNIQUES OF COSTING In addition to the different costing methods, various techniques are also used to find the costs. Thesetechniques may be grouped under the following heads: Historical Absorption Costing: It is the ascertainment of costs after they have been incurred. It is defined as the practice of charging all costs, both variable and fixed, to operations, process or products. It is also known as traditional costing. Since costs are ascertained after they have been incurred, it does not help in exercising control over costs. However, It is useful in submitting tenders, preparing job estimates etc. Marginal Costing: It refers to the ascertainment of costs by differentiating between fixed costs and variable costs. In this technique fixed costs are not treated as product costs. They are recovered from the contribution (the difference between sales and variable cost of sales). The marginal or variable cost of sales includes direct material, direct wages, direct expenses and variable overhead. This technique helps management in taking important policy decisions such as product pricing in times of competition, whether to make or not, selection of productmix etc. Differential Costing: Differential cost is the difference in total cost between alternatives evaluated to assist decision making. This technique draws the curtain between variable costs and fixed costs. It takes into consideration fixed costs also (unlike marginal costing) for decision making under certain circumstances. This technique considers all the revenue and cost differences amongst the alternative courses of action to assist management in arriving at an appropriate decision. Standard Costing: It refers to the ascertainment and use of standard costs and the measurement and analysis of variances. Standard cost is a predetermined cost which is computed in advance of production on the basis of a specification of all factors affecting costs. The standards are fixed for each element of cost. To find out variances, the standard costs are compared with actual costs. The variances are investigated later on and wherever necessary, rectificational steps are initiated promptly. The technique helps in measuring the efficiency of operations from time to time.
- 20. Applications of MarginalCosting in terms of Costcontrol: (1)Profit Planning, (2) Acceptance of offer and submission of tenders. (3) Make or buy decisions. (4) Shutdown or continue decisions or alternative use of productionfacilities. (5) Retain or replace a machine. (6) Decisions as to whether to sell in the export market or in the home market. (7) Fixation of Selling Price (8) Whether to expand or contract. (9) Productmix decisions PROFIT PLANNING The basic objective of running any business organization is to earn profits. Profits determine the financial position, liquidity and solvency of the company. They serve as a yardstick for judging the competence and efficiency of the management. Profit planning is therefore a fundamental part of the management function and is a vital part of the total budgeting process. The management determines the profit goals and prepares budgets that will lead them to the realization of these goals. However, profit planning can be done only when management is aware about the various factors which affect profits. Some of the important factors affecting profits are as follows: Selling Price Variation in the selling price causes variation in the amount of profit also. An increase in the selling price increases the profits and vice versa. Cost The term ‘cost’, means ‘the amount of expenditure (actual or notional) incurred on or attributable to a specified thing or activity’. A variation in the cost also affects the amount of profit. Volume The term ‘volume’ refers to the level of activity. This may be expressed in any of the following manners: (i) Sales capacity as a percentage of maximum sales; (ii) Value of sales; (iii) Quantity of sales; (iv) Productioncapacity as a percentage of maximum production; (v) Value of production;
- 21. (vi) Quantity of production ADVANTAGES OF MARGINAL COSTING: 1. Effective cost control: since marginal costing techniques segregate total cost to fixed and variable portions the emphasis is laid on variable cost for control. The fixed costs are also controlled by ascertaining them separately for computing profit and for control. The constant focus on cost and volume, and their effect on profit pave way for costreduction. 2. Simplicity: The statement prepared under marginal costing can be easily followed, as it breaks up the costas variable and fixed. 3. Helpful to the management: It enables the management to start a new line of production which is advantageous. It is helpful in determining which is profitable and whether to buy or manufacture a product. The management can take decision regarding pricing. 4. Fixation of selling price: The differentiation between fixed and variable costs is very helpful in determining the selling price of the products or services. Sometimes, different prices are charged for the same article in different markets to meet varying degrees of competition. 5. Budgetary control: The classification of expenses is very helpful in budgeting and flexible budget for various levels of activities. 6. Production planning: It shows the amount of profit at every level of output with the help of cost-volume-profit relationship. Here the break-even chart is made use of. 7. Profit planning: The cost-volume-profit relationship is perfectly analyzed to reveal efficiently of products, processes and departments. Break-even point and Margin of safety are the two important concepts helpful in profit planning. Most advantageous is that the volume and cost to maximize profits with in the existing limitations can be planned. 8. Meaningful reporting: Marginal costing serves as a good basis for reporting to management. The profits are analyzed from the point of view of sales rather than that of production. 9. Make or buy decision: Sometimes, a decision has to be made whether to manufacture a component or buy it ready-made from the market. The decision to purchases it would be taken if the price paid recovers some of the fixed expenses. 10.Better presentation: The statements and graphs prepared under marginal costing are better understood by the management executives. The B.E.P. analysis
- 22. presents the behavior of cost, sales, contribution, and so on in terms of charts and graphs. Thus the results can easily be grasped. 11.Preparing tenders: Many business enterprises have to compete in the market in quoting the lowest price. Total variable cost, when separately calculated, becomes the ‘floor price’. Any price above this floor price may be quoted to increase the total contribution. DISADVANTAGES OF MARGINAL COSTING: In spite of some many advantages, the technique of marginal costing suffers from the following limitations: 1. Assumptions: The technique of marginal costing is based upon a number of assumptions which may not hold good under all circumstances. 2. All costs are not divisible into fixed and variable: There are certain costs, which are semi-variable in nature. It is very difficult and arbitrary to classify these costs into fixed and variable elements. Variable costs do not always either remain constant or vary in direct proportion to volume of output because of the laws of diminishing and increasing returns. 3. Automation: In these days of automation and technical advancement, huge investments are made in heavy machinery which results in heavy amount of fixed costs. Ignoring fixed costs, in this context, while decision-making is not rational. 4. Production aspect is ignored: Marginal costing lays too much emphasis on selling function and, as such, production function has been considered to be less significant. But from the business point of view, both the functions are equally important. 5. Not applicable in all types of business: In contract type and job order business, full cost of the job or the contract is to be charged. Therefore, it is difficult to apply marginal costing in these types of business. Though marginal costing suffers from certain limitations, it is a very useful tool in the hands of the management and is extensively used for control, decision-making and profit planning. ASSUMPTIONS OF MARGINAL COSTING: 1. All costs canbe divided into two categories: Fixed and variable. The variable part of semi-variable costcan be identified. 2. Fixed costs remain constant at all levels of activity. 3. Variable costs vary in total, but remain constant per unit.
- 23. 4. Prices of variable costs, suchas material prices and labor rates remain unchanged. 5. Selling price, unless otherwise mentioned, remains constant at different levels of activity. 6. The productrisk remains unaltered, unless specified otherwise. 7. Level of efficiency of operations is uniform throughout a costing period. No changes in manufacturing process dueto non-static operating efficiency. 8. No stocks of finished products unless otherwise mentioned. It means the number of units produced and sold is the same. COST VOLUME PROFIT ANALYSIS Cost Volume Profit Analysis (C V P) is a systematic method of examining the relationship between changes in the volume of output and changes in total sales revenue, expenses (costs) and net profit. In other words. it is the analysis of the relationship existing amongst costs, sales revenues, output and the resultant profit. Objectives of CostVolume Profit Analysis The following are the important objectives of costvolume profit analysis: (1) Costvolume is a powerful tool for decision making. (2) It makes use of the principles of Marginal Costing. (3) It enables the management to establish what will happen to the financial results if a specified level of activity or volume fluctuates. (4) It helps in the determination of break-even point and the level of output required to earn a desired profit. (5) The PN ratio serves as a measure of efficiency of each product, factory, sales area etc. and thus helps the management to choosea most profitable line of business. (6) It helps us to forecast the level of sales required to maintain a given amount of profit at different levels of prices. BREAK EVEN ANALYSIS Break-Even Analysis is also called Cost Volume Profit Analysis. The term Break-Even Analysis is used to measure interrelationship between costs, volume and profit at various level of activity. A concern is said to break-even when its total sales are equal to its total costs. It is a point of no profits no loss. This is a point where contribution is equal to fixed cost. In other words, the break-even point where income is equal to expenditure {or) total sales equal to total cost.
- 24. BREAK EVEN CHART: The break-even point can be calculated by the following formula: Break-Even Point in Units (1) Break-Even Point in Units (or) B E P (in units) Total Fixed Cost Break-Even Point in Units = ---------------------------- Contribution per unit (Or) Total Fixed Cost Break-Even Point in Units = --------- ------------------- Selling Price Per Unit – Variable CostPer Unit Break-EvenPointin Sales Volume (1) Break- Even Sales: Fixed Cost Break-Even Sales= ------------------------------------ X Sales Sales - Variable Cost (OR)
- 25. Fixed Cost Break-Even Sales= ------------------------ P/V RATIO CONTRIBUTION P/V RATIO (PROFT –VOLUME RATIO)= --------- --------------------------- X 100 SALES BREAKEVEN ANALYSIS The study of Cost-Volume-Profit (CVP) relationship is often referred as BEA. The term BEA is interpreted in two senses. In its narrow sense, it is concerned with finding out BEP; BEP is the point at which total revenue is equal to total cost. It is the point of no profit, no loss. In its broad determine the probable profit at any level of production. Assumptions: 1. All costs are classified into two – fixed and variable. 2. Fixed costs remain constant at all levels of output. 3. Variable costs vary proportionally with the volume of output. 4. Selling price per unit remains constant in spite of competition or change in the volume of production. 5. There will be no change in operating efficiency. 6. There will be no change in the general price level. 7. Volume of production is the only factor affecting the cost. 8. Volume of sales and volume of productionare equal. Hence there is no unsold stock. 9. There is only one product or in the case of multiple products. Sales mix remains constant. Merits:
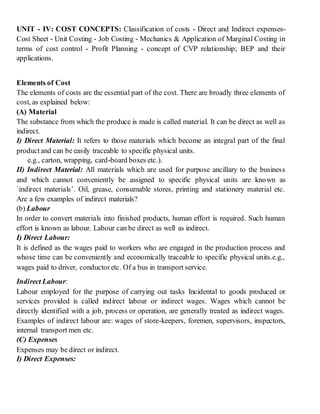
- 26. 1. Information provided by the Break Even Chart can be understood more easily then those contained in the profit and Loss Account and the coststatement. 2. Break Even Chart discloses the relationship between cost, volume and profit. It reveals how changes in profit. So, it helps management in decision-making. 3. It is very useful for forecasting costs and profits long term planning and growth 4. The chart discloses profits at various levels of production. 5. It serves as a useful tool for costcontrol. 6. It can also be used to study the comparative plant efficiencies of the industry. 7. Analytical Break-even chart present the different elements, in the costs – direct material, direct labour, fixed and variable overheads. Demerits: 1. Break-even chart presents only cost volume profits. It ignores other considerations such as capital amount, marketing aspects and effect of government policy etc., which are necessary in decision making. 2. It is assumed that sales, total cost and fixed cost can be represented as straight lines. In actual practice, this may not be so. 3. It assumes that profit is a function of output. This is not always true. The firm may increase the profit without increasing its output. 4. A major drawback of BEC is its inability to handle production and sale of multiple products. 5. It is difficult to handle selling costs such as advertisement and sale promotion in BEC. 6. It ignores economics of scale in production. 7. Fixed costs do not remain constant in the long run. 8. Semi-variable costs are completely ignored. 9. It assumes production is equal to sale. It is not always true because generally there may be opening stock. 10. When production increases variable cost per unit may not remain constant but may reduce on account of bulk buying etc. 11. The assumption of static nature of business and economic activities is a well-known defect of BEC. Break Even Point Representation
- 27. Requirements of Break EvenAnalysis 1. Fixed cost 2. Variable cost 3. Contribution 4. Margin of safety 5. Profit volume ratio 6. Break-Even-Point 1. Fixed cost: Expenses that do not vary with the volume of production are known as fixed expenses. Eg. Manager’s salary, rent and taxes, insurance etc. It should be noted that fixed changes are fixed only within a certain range of plant capacity. The concept of fixed overhead is most useful in formulating a price fixing policy. Fixed cost per unit is not fixed. 2. Variable Cost: Expenses that vary almost in direct proportion to the volume of production of sales are called variable expenses. Eg. Electric power and fuel, packing materials consumable stores. It should be noted that variable costper unit is fixed.
- 28. 3. Contribution: Contribution is the difference between sales and variable costs and it contributed towards fixed costs and profit. It helps in sales and pricing policies and measuring the profitability of different proposals. Contribution is a sure test to decide whether a productis worthwhile to be continued among different products. Contribution = Sales – Variable cost Contribution = Fixed Cost+ Profit. 4. Margin of safety: Margin of safety is the excess of sales over the break even sales. It can be expressed in absolute sales amount or in percentage. It indicates the extent to which the sales can be reduced without resulting in loss. A large margin of safety indicates the soundness of the business. The formula for the margin of safety is: Present sales – Break even sales or ratioV.P. Profit Margin of safety can be improved by taking the following steps. 1. Increasing production 2. Increasing selling price 3. Reducing the fixed or the variable costs or both 4. Substituting unprofitable productwith profitable one. 5. Profit Volume Ratio is usually called P. V. ratio. It is one of the most useful ratios for studying the profitability of business. The ratio of contribution to sales is the P/V ratio. It may be expressed in percentage. Therefore, every organization tries to improve the P. V. ratio of each product by reducing the variable cost per unit or by increasing the selling price per unit. The concept of P. V. ratio helps in determining break even-point, a desired amount of profit etc. The formula is, Sales onContributi X 100 6. Break – Even- Point: If we divide the term into three words, then it does not require further explanation. Break-divide
- 29. Even-equal Point-place or position Break Even Point refers to the point where total cost is equal to total revenue. It is a point of no profit, no loss. This is also a minimum point of no profit, no loss. This is also a minimum point of production where total costs are recovered. If sales go up beyond the Break Even Point, organization makes a profit. If they come down, a loss is incurred. 1. Break Even point (Units) = unitperonContributi ExpensesFixed 2. Break Even point (In Rupees) = onContributi expensesFixed X sales Applications of Break Even Analysis Safety Margin: The break-even chart helps the management to know at a glance the profits generated at the various levels of sales. The safety margin refers to the extent to which the firm can afford a decline before it starts incurring losses. Safety Margin = (Sales – BEP)/Sales x 100 TargetProfit: The break-even analysis can be utilized for the purpose of calculating the volume of sales necessary to achieve a target profit. When a firm has some target profit, this analysis will help in finding out the extent of increase in sales by using the following formula: Target Sales Volume = Fixed Cost+ Target Profit/Contribution Margin Per Unit. By way of illustration, we can take Table 1 given above. Suppose the firm fixes the profit as Rs. 100, then the volume of output and sales should be 250 units. Only at this level, it gets a profit of Rs. 100. By using the formula, the same result will be obtained.
- 30. Changein Price: The management is often faced with a problem of whether to reduce prices or not. Before taking a decision on this question, the management will have to consider a profit. A reduction in price leads to a reduction in the contribution margin. This means that the volume of sales will have to be increased even to maintain the previous level of profit. The higher the reduction in the contribution margin, the higher is the increase in sales needed to ensure the previous profit. The formula for determining the new volume of sales to maintain the same profit, given a reduction in price, will be New Sales Volume = Total Fixed Cost + Total Profit/New Selling Price – Average Variable Cost For example, suppose a firm has a fixed cost of Rs. 8,000 and the profit target is Rs.20,000. If the sales price is Rs.8 and the average variable cost is Rs. 4, then the total volume of sales should be 7,000 units on the basis of the formula given under target price. Changein Costs: When costs undergo change, the selling price and the quantity produced and sold also undergo changes. Changes in costcan be in two ways: (i) Change in variable cost, and (ii) Change in fixed cost. (i) Variable CostChange: An increase in variable costs leads to a reduction in the contribution margin. This reduction in the contribution margin will shift the break-even point downward. Conversely, with the fall in the proportion of variable costs, contribution margins increase and break-even point moves upwards. Under conditions of changing variable costs, the formulas to determine the new quantity or the new selling price are: (a) New Quantity or Sales Volume = Contribution to Margin/Present Selling Price – New Variable CostPer Unit
- 31. (b) New Selling Price = Present Sale Price + New Variable Cost-PresentVariable Cost Example: The contribution margin is Rs. 64,000, the present sale price is Rs.10 and the present variable cost is Rs.6. If the variable cost per unit goes up from Rs.6 to Rs. 7, what will be the new sales volume and price? New Sales Volume = 64,000 /10-7 = 64,000 /3 = 21,300 units New Sales Price = (10+7-6) = Rs.11. (ii) Fixed CostChange: An increase in fixed cost of a firm may be caused either due to a tax on assets or due to an increase in remuneration of management, etc. It will increase the contribution margin and thus push the break-even point upwards. Again to maintain the earlier level of profits, a new level of sales volume or new price has to be found out. New Sales Volume = Present Sale Volume + (New Fixed Cost + Present Fixed Costs)/(PresentSelling Price-Present Variable Cost) New Sale Price = Present Sale Price + (New Fixed Costs – Present Fixed Costs)/Present Sale Volume Example: The fixed cost of a firm increases from Rs. 5,000 to Rs. 6,000. The variable cost is Rs. 5 and the sale price is Rs. 10 and the firm sells 1,000 units of the product New Sales Volume = 1,000 + 6,000 – 5,000/10-5=1,000+1,000/5 = 1,000+200 = 1,200 units New Sale Price =10 + 6,000-5,000/1,000 = 10 + 1,000/1,000 = Rs.10 + Re 1 = Rs. 11
- 32. Decision on Choice of Techniqueof Production: A firm has to decide about the most economical production process both at the planning and expansion stages. There are many techniques available to produce a product. These techniques will differ in terms of capacity and costs. The breakeven analysis is the most simple and helpful in the case of decision on a choice of technique of production. For example, for low levels of output, some conventional methods may be most probable as they require minimum fixed cost. For high levels of output, only automatic machines may be most profitable. By showing the cost of different alternative techniques at different levels of output, the break-even analysis helps the decision of the choice among these techniques. Makeor BuyDecision: Firms often have the option of making certain components or for purchasing them from outside the concern. Break-even analysis can enable the firm to decide whether to make or buy. Example: A manufacturer of car buys a certain components at Rs. 20 each. In case he makes it himself, his fixed and variable cost would be Rs. 24,000 and Rs.8 per component respectively. BEP = Fixed Cost/PurchasePrice – Variable Cost =24,000/20-8 = 24,000/12 = 2,000 units From this, we can infer that the manufacturer can produce the parts himself if he needs more than 2,000 units per year. However, certain considerations need to be taken account of in a buying decision, such as: (i) Is the required quality of the productavailable? (ii) Is the supply from the market certain and timely? (iii) Do the supplies of the components try to take any monopoly advantage?
- 33. PlantExpansion Decisions: Firms often have the option of making certain components or for purchasing them from outside the concern. Break-even analysis can enable the firm to decide whether to make or buy. Example: A manufacturer of car buys a certain components at Rs. 20 each. In case he makes it himself, his fixed and variable cost would be Rs. 24,000 and Rs.8 per component respectively. BEP = Fixed Cost/PurchasePrice – Variable Cost =24,000/20-8 = 24,000/12 = 2,000 units From this, we can infer that the manufacturer can produce the parts himself if he needs more than 2,000 units per year. However, certain considerations need to be taken account of in a buying decision, such as: (i) Is the required quality of the productavailable? (ii) Is the supply from the market certain and timely? (iii) Do the supplies of the components try to take any monopoly advantage? PlantShutDown Decisions: In the shut-down decisions, a distinction should be made between out of pocket and sunk costs. Out of pocket costs include all the variable costs plus the fixed cost which do not vary with output. Sunk fixed costs are the expenditures previously made but from which benefits still remain to be obtained e.g., depreciation. Advertisingand Promotion MixDecisions: The main objective of advertisement is to stimulate or increase sales to all customers— former, present and future. If there is keen competition, the firm has to undertake vigorous
- 34. campaign of advertisement. The management has to examine those marketing activities that stimulate consumer purchasing and dealer effectiveness. The break-even point concept helps the management to know about the circumstances. It enables him not only to take appropriate decision but by showing how these additional fixed cost would influence BEPs. The advertisement cost pushes up the total cost curve by the amount of advertisement expenditure. Decision RegardingAddition or Deletion of Product Line: If a product has outlived its utility in the market immediately, the production must be abandoned by the management and examined what would be its consequent effect on revenue and cost. Alternatively, the management may like to add a product to its existing product line because it expects the product as a potential profit spinner. The break-even analysis helps in such a decision. COST SHEET The components of cost explained above can be presented in the form of a statement. Such a statement of cost giving total cost, cost per unit alongwith different cost components of is termed as a cost sheet. The computation of different cost components and preparation is a costsheet can be understood with the following illustration : Illustration 10.1 : Calculate the Prime cost, Factory cost, Total cost of production and Cost of sales from the following particulars : Rs . Rs. Raw Materials consumed ...... 20,000 Wages paid to labourers ...... 5,000
- 35. Directly chargeable expenses ...... 1000 Oil & Waste ...... 100 Wages of Foremen ...... 1,000 Storekeepers' Wages ...... 500 Electric Power ...... 200 Lighting : Factory 500 Office 200 700 Rent : Factory 2,00 0 Office 1,00 0 3,000 Repairs & Renewals : Factory Plant 500 Machinery 1,00 0 Office Premises 200 1,700 Depreciation : Office Premises 500 Plant & Machinery 200 700 Consumable Stores 1,000...... Manager's Salary ...... 2,000
- 36. Directors' Fees ...... 500 Office Printing & Stationery ...... 200 Telephone Charges ...... 50 Postage & Telegrams ...... 100 Salesmen's Commission & Salary ...... 500 Travelling Expenses ...... 200 Advertisin g ...... 500 Warehouse Charges ...... 200 Carriage Outward ...... 150
- 37. 26 Solution : COST SHEET Rs. Rs. Direct material : Raw material consumed 20000 Direct labour : Wages paid to labourers 5000 Direct expenses : Directly chargeable expenses 1000 PRIME COST 26,000 Add : Factory Overheads : Indirect material : Consumable stores 1,00 0 Oil and waste 100 1,100 Indirect labour : Wages of foreman 1,00 0 Storekeepers' wages 500 1,500 Indirect expenses : Electric power 200 Factory lighting 500 Factory rent 2,00 0 Repairs & Renewals : Plant 500 Machinery 1,00
- 38. 0 Depreciation : Plant & machinery 200 4,400 7,000 FACTORYOR WORKS COST 33,000 Add : Office and administrative overheads : Indirect material : Office printing and stationery 200 Indirect labour : Manager's salary 2,00 0 Directors' fees 500 2,500 Indirect expenses : Office lighting 200 Office rent 1,00 0 Repairs and renewals office premises 200 Dep. on office premises 500 Telephone charges 50 Postage & telegrams 100 2,050 4,750 TOTAL COST OF PRODUCTION 37750 Add: Selling & Distribution overheads : Indirect labour : Salesmen's commission and salary 500 Indirect expenses : Travelling expenses 200 Advertising 500
- 39. Warehouse charges 200 COST OF SALES Carriage outward 150 1,050 1,550 39,300
- 40. Illustration 10.2: The following figures have been extracted from the books of XYZ Ltd. for the year ending 31st March, 2000. Rs. Direct materials 70,000 Direct wages 75,000 Indirect wages 10,000 Other direct expenses 15,000 Factory rent and rates 5,000 Office rent and rates 500 Indirect materials 500 Depreciation of plant 1,500 Depreciation of office furniture 100 Managing Director's remuneration 12,000 General factory expenses 5,700 General office expenses 1,000 General selling expenses 1,000 Travelling expenses 1,100 Office salaries 4,500 Carriage outward 1,000 Advertisements 2,000 Sales 2,50,000 From the above figures, calculate the following : (a) Prime cost (b) Works cost (c) Cost of production (d) Cost of sales (e) Net profit
- 41. Solution : XYZ LTD. CostSheet for the year ending 31st March, 2000 R s . Rs. Direct materials consumed 70,000 Direct wages 75,000 Direct expenses 15,000 Prime Cost 1,60,000 Factoryoverhead: Indirect wages 10,000 Factory rent & rates 5,000 Indirect materials 500 Depreciation of plant 1,500 General factory expenses 5,700 22,700 Works cost 1,82,700 Office and Administration Overhead Office rent and rates 500 Depreciation of office furniture 100 Managing Director's remuneration 12,000 Office salaries 4,500 General office expenses 1,000 18,100 Costof Production 2,00,800 Selling and distribution overhead:
- 42. Travelling expenses 1,100 Carriage outward 1,000 Advertisements 2,000 General selling expenses 1,000 5,100 Costof Sales 2,05,900 Profit 44,100 Sales 2,50,000