1. 4QFY2010 Result Update I Infrastructure
May 31, 2010
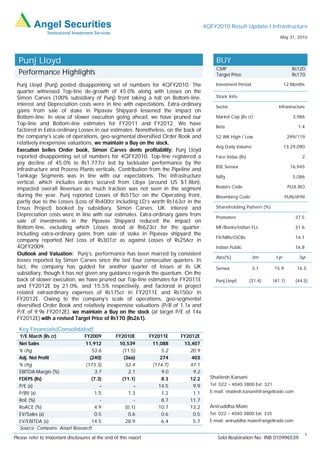
Punj Lloyd BUY
CMP Rs120
Performance Highlights Target Price Rs170
Punj Lloyd (Punj) posted disappointing set of numbers for 4QFY2010. The Investment Period 12 Months
quarter witnessed Top-line de-growth of 45.0% along with Losses on the
Simon Carves (100% subsidiary of Punj) front taking a toll on Bottom-line. Stock Info
Interest and Depreciation costs were in line with expectations. Extra-ordinary Sector Infrastructure
gains from sale of stake in Pipavav Shipyard lessened the impact on
Bottom-line. In view of slower execution going ahead, we have pruned our Market Cap (Rs cr) 3,986
Top-line and Bottom-line estimates for FY2011 and FY2012. We have
Beta 1.4
factored in Extra-ordinary Losses in our estimates. Nonetheless, on the back of
the company’s scale of operations, geo-segmental diversified Order Book and 52 WK High / Low 299/119
relatively inexpensive valuations, we maintain a Buy on the stock.
Avg Daily Valume 13,29,090
Execution belies Order book, Simon Carves dents profitability: Punj Lloyd
reported disappointing set of numbers for 4QFY2010. Top-line registered a Face Value (Rs) 2
yoy decline of 45.0% to Rs1,777cr led by lackluster performance by the
BSE Sensex 16,945
Infrastructure and Process Plants verticals. Contribution from the Pipeline and
Tankage Segments was in line with our expectations. The Infrastructure Nifty 5,086
vertical, which includes orders secured from Libya (around US $1.8bn),
impacted overall Revenues as much traction was not seen in the segment Reuters Code PUJL.BO
during the year. Punj reported Losses of Rs515cr on the Operating front, Bloomberg Code PUNJ@IN
partly due to the Losses (Loss of Rs400cr including LD’s worth Rs163cr in the
Ensus Project) booked by subsidiary, Simon Carves, UK. Interest and Shareholding Pattern (%)
Depreciation costs were in line with our estimates. Extra-ordinary gains from
Promoters 37.5
sale of investments in the Pipavav Shipyard reduced the impact on
Bottom-line, excluding which Losses stood at Rs623cr for the quarter. MF/Banks/Indian FLs 31.6
Including extra-ordinary gains from sale of stake in Pipavav shipyard the
FII/NRIs/OCBs 14.1
company reported Net Loss of Rs301cr as against Losses of Rs256cr in
4QFY2009. Indian Public 16.8
Outlook and Valuation: Punj’s, performance has been marred by consistent
Abs(%) 3m 1yr 3yr
losses reported by Simon Carves since the last four consecutive quarters. In
fact, the company has guided for another quarter of losses at its UK Sensex 3.1 15.9 16.5
subsidiary, though it has not given any guidance regards the quantum. On the
back of slower execution, we have pruned our Top-line estimates for FY2011E Punj Lloyd (31.4) (41.1) (44.5)
and FY2012E by 21.0%, and 15.5% respectively, and factored in project
related extraordinary expenses of Rs175cr in FY2011E and Rs150cr in
FY2012E. Owing to the company’s scale of operations, geo-segmental
diversified Order Book and relatively inexpensive valuations (P/B of 1.1x and
P/E of 9.9x FY2012E), we maintain a Buy on the stock (at target P/E of 14x
FY2012E) with a revised Target Price of Rs170 (Rs261).
Key Financials(Consolidated)
Y/E March (Rs cr) FY2009 FY2010E FY2011E FY2012E
Net Sales 11,912 10,539 11,088 13,407
% chg 53.6 (11.5) 5.2 20.9
Adj. Net Profit (240) (366) 274 403
% chg (173.3) 52.4 (174.7) 47.1
EBITDA Margin (%) 3.7 2.1 9.0 9.2
FDEPS (Rs) (7.3) (11.1) 8.3 12.2 Shailesh Kanani
P/E (x) - - 14.5 9.9 Tel: 022 – 4040 3800 Ext: 321
P/BV (x) 1.5 1.3 1.2 1.1 E-mail: shailesh.kananil@angeltrade.com
RoE (%) - - 8.7 11.7
RoACE (%) 4.9 (0.1) 10.7 13.2 Aniruddha Mate
EV/Sales (x) 0.5 0.6 0.6 0.5 Tel: 022 – 4040 3800 Ext: 335
EV/EBITDA (x) 14.5 28.9 6.4 5.7 E-mail: aniruddha.mate@angeltrade.com
Source: Company, Angel Research
1
Please refer to important disclosures at the end of this report Sebi Registration No: INB 010996539
2. Punj Lloyd I 4QFY2010 Result Update
Exhibit 1: 4QFY2010 Performance (Consolidated)
Y/E March (Rs cr) 4QFY10 4QFY09 % chg FY2010 FY2009 % chg
Net Sales 1,777 3,231 (45.0) 10,539 11,976 (12.0)
Total Expenditure 2,291 3,294 (30.4) 10,320 11,603 (11.1)
Materials 801 1,110 (27.9) 3,770.1 3,750.5 0.5
% of sales 27.9 37.6 35.8 31.3
Contractor Charges 378 1,234 (69.4) 2,921.3 4,236.5 (31.0)
% of sales 13.2 41.8 27.7 35.4
Employee Costs 381 378 0.8 1,345.2 1,292.2 4.1
% of sales 13.3 12.8 12.8 10.8
Other Expenditure 731 571 28.1 2,283.9 2,323.5 (1.7)
% of sales 25.5 19.3 21.7 19.4
Operating Profit (514.7) (63.0) 717.2 218.3 373.5 (41.5)
OPM (%) (29.0) (1.9) 2.1 3.1 (33.6)
Interest 72.8 75.1 (3.1) 306.3 220.8 38.8
Depreciation 68.0 50.8 34.0 227.0 177.1 28.2
Non Operating Income (1.4) 0.1 - 13.6 10.3 32.8
Nonrecurring items 322.4 2.2 0.0 322.4 15.4 1996.0
Profit Before Tax (334.5) (186.6) 79.2 21.0 1.3 1466.4
Tax (32.2) 66.7 (148.2) 137.3 222.8 (38.4)
PAT (302.3) (253.4) 19.3 (116.3) (221.5) (47.5)
Share of Profits/(Losses)
3.0 (8.2) - 9.5 (6.8) -
of Assoc
Share of Profits/(Losses)
(1.6) 5.9 - (1.7) 6.2 -
of MI
PAT after MI & Assoc. (300.9) (255.6) - (108.4) (222.1) -
PAT (%) (16.9) (7.8) - (1.1) (1.8) -
Adjusted PAT (558.8) (257.4) 117.1 (366.3) (234.4) 56.3
Adj. PAT (%) (31.5) (8.0) - (3.5) (2.0)
Reported EPS (Rs) (9.1) (7.7) - (3.6) (7.3) -
Source: Company, Angel Research
Order Book remains robust, Execution a concern
The company outstanding Order Book position stands at Rs27,770cr including
Pipeline (10.0%), Tankage (2.0%), Infrastructure (63.2%) and Process plants (24.8%).
In FY2010, the company secured orders worth Rs17,503cr. Of the new orders,
Infrastructure and Process Plants verticals are the fore-runners at 70% and 23%
respectively, followed by Pipelines (6%) and Tankage (1%). We believe that Top-line
performance hereon would depend primarily on execution on the Infrastructure and
Process Plants vertical fronts, as they together constitute a major 88% of the
company’s Outstanding Order Book. Hence, we believe that though the company’s
Order Book remains robust, Execution is the one of the vital factors to track.
Exhibit 2: Segmental and Geographical mix of Order Book (FY2010)
2.7
2.0
10.0 7.8
24.8
29.9
35.4
63.2 24.2
Pipelines Tankages South Asia SE Asia & Asia-Pac
Africa Middle East
Infrastructure Process plants, others
Europe & Rest of world
Source: Company, Angel Research
May 31, 2010 2
3. Punj Lloyd I 4QFY2010 Result Update
Outlook
For FY2010, Punj Lloyd booked Losses of Rs696cr due to the lackluster
performance by Simon Carves. Overall, the company posted Top-line
de-growth of 45.0% for 4QFY2010 and 12.0% for FY2010. As a result, we
have pruned our Top-line estimates for FY2011E and FY2012E by 21.0% and
15.5%, respectively. Moreover, management of Simon Carves has guided for
another quarter of possible Losses before things normalise. The auditors have
also qualified the financials of the company for taking credit for a claim of
Rs243cr and not accounting for liquidated damages of Rs65.5cr.
Consequently, we factored in project elated extra-ordinary expenses of
Rs175cr in FY2011E and Rs150cr in FY2012E factoring in concerns relating to
Simon Carves.
Exhibit 3: Revision in estimates (Rs cr)
Old Estimates New Estimates
FY2011E FY2012E FY2011E FY2012E
Net Sales 14,037 15,868 11,088 13,407
EBITDA 1,338 1,534 1,000 1,231
PAT 508 617 274 403
Source: Company, Angel Research
We would adopt a cautious outlook on the company’s performance going
ahead due to the bad FY2010 performance. Going ahead, Top-line
performance would primarily depend on execution in the Infrastructure and
Process Plants verticals, as combined they account for a major portion of the
company’s Outstanding Order Book at around 88%.
Valuation
On the bourses the stock performance has been impacted by the concerns
relating to the continued losses posted by Simon Carves. Thus, at current
levels, the stock is trading inexpensive at P/B of 1.1x and P/E of 9.9x FY12E
On the back of the company’s scale of operations, geo-segmental diversified
Order Book and relatively inexpensive valuations, we maintain a Buy on the
stock (at target P/E of 14x FY2012E) with a revised Target Price of Rs170
(Rs261).
May 31, 2010 3
4. Punj Lloyd I 4QFY2010 Result Update
Profit & Loss Statement (Consolidated) (Rs cr)
Y/E March FY2007 FY2008 FY2009 FY2010 FY2011E FY2012E
Net Sales 5,127 7,753 11,912 10,539 11,088 13,407
Other operating income - - - - - -
Total operating income 5,127 7,753 11,912 10,539 11,088 13,407
% chg 51.2 53.6 (11.5) 5.2 20.9
Total Expenditure 4,716 7,061 11,472 10,321 10,087 12,176
Net Raw Materials 1,637 2,828 3,751 3,770 3,127 3,794
Other Mfg costs 3,079 3,340 6,429 2,921 5,555 6,717
Personnel - 892 1,292 1,345 1,231 1,515
Other - - - 2,284 175 150
EBITDA 410 692 440 218 1,000 1,231
% chg 119.4 68.7 (36.4) (50.4) 358.3 23.0
(% of Net Sales) 8.0 8.9 3.7 2.1 9.0 9.2
Depreciation& Amortisation 106 147 177 227 234 254
EBIT 304 545 263 (9) 767 977
% chg 135.2 79.3 (51.7) (103.3) (8,912.0) 27.4
(% of Net Sales) 5.9 7.0 2.2 (0.1) 6.9 7.3
Interest & other Charges 119 181 352 306 409 440
Other Income 79 81 71 14 37 33
(% of PBT) 43 22 (80) (4) 10 6
Share in profit of Associates - - - - - -
Recurring PBT 186 365 (89) (315) 357 537
% chg 217.1 96.5 (124.3) 255.7 (213.4) 50.2
Extraordinary Expense/(Inc.) 0.3 (37.1) (18.8) (322.4) - -
PBT (reported) 265 483 1 21 395 569
Tax 69 123 226 137 121 167
(% of PBT) 26.1 25.6 16,925.9 653.8 30.6 29.3
PAT (reported) 196 359 (225) (116) 274 403
Add: Share of earnings of
- - - - - -
associate
Less: Minority interest (MI) 0 0 6 (2) - -
Prior period items - - - - - -
PAT after MI (reported) 197 358 (225) (108) 274 403
ADJ. PAT 197 328 (240) (366) 274 403
% chg 259.9 66.6 (173.2) 52.4 (174.7) 47.1
(% of Net Sales) 3.8 4.2 (2.0) (3.5) 2.5 3.0
Basic EPS (Rs) 37.7 10.8 (7.9) (11.1) 8.3 12.2
Fully Diluted EPS (Rs) 5.9 9.9 (7.3) (11.1) 8.3 12.2
% chg 249.1 66.6 (173.2) 52.4 (174.7) 47.1
May 31, 2010 4
5. Punj Lloyd I 4QFY2010 Result Update
Balance Sheet (Consolidated) (Rs cr)
Y/E March FY2007 FY2008 FY2009 FY2010E FY2011E FY2012E
SOURCES OF FUNDS
Equity Share Capital 52 61 61 66 66 66
Preference Capital - - - - - -
Reserves& Surplus 1,227 2,657 2,424 2,978 3,172 3,561
Shareholders Funds 1,279 2,743 2,485 3,044 3,238 3,627
Minority Interest 6 22 42 42 42 42
Total Loans 1,699 1,607 3,559 4,029 3,587 3,904
Deferred Tax Liability 68 111 174 174 174 174
Total Liabilities 3,052 4,484 6,260 7,289 7,042 7,747
APPLICATION OF FUNDS
Gross Block 1,867 2,083 2,653 3,138 3,438 3,738
Less: Acc. Depreciation 620 673 777 1,004 1,238 1,492
Net Block 1,247 1,411 1,875 2,133 2,200 2,245
Capital Work-in-Progress 86 212 297 194 193 193
Goodwill - - - - - -
Investments 170 546 661 312 312 312
Current Assets 4,225 5,582 8,295 9,433 9,413 11,090
Cash 1,003 690 812 1,696 1,138 896
Loans & Advances 446 662 1,053 980 1,053 1,274
Other 2,776 4,231 6,430 6,757 7,222 8,920
Current liabilities 2,708 3,287 4,895 4,809 5,102 6,118
Net Current Assets 1,517 2,295 3,400 4,624 4,312 4,971
Mis. Exp. not written off 0 0 0 0 0 0
Total Assets 3,052 4,484 6,260 7,289 7,042 7,747
Cash Flow Statement (Consolidated) (Rs cr)
Y/E March FY2007 FY2008 FY2009 FY2010E FY2011E FY2012E
Profit Before Tax 265 483 1 21 395 569
Depreciation 106 147 177 227 234 254
Change in Working Capital (354) 1,091 983 340 246 902
Less: Other income 79 81 71 14 37 33
Direct taxes paid 69 123 226 137 121 167
Cash Flow from Operations 576 (666) (1,101) (243) 225 (278)
(Inc.)/Dec. in Fixed Assets (908) (352) (653) (383) (299) (298)
(Inc.)/Dec. in Investments (128) (376) (115) 349 - -
(Inc.)/Dec. in loans & advances - - - - - -
Other income 79 81 71 14 37 33
Cash Flow from Investing (957) (646) (697) (20) (262) (265)
Issue of Equity 563 1,130 - 670 - -
Inc./(Dec.) in loans 981 (92) 1,952 469 (441) 317
Dividend Paid (Incl. Tax) 9 14 11 14 14 14
Others (263) (25) (20) 21 (65) (1)
Cash Flow from Financing 1,271 999 1,921 1,146 (521) 301
Inc./(Dec.) in Cash 891 (313) 122 883 (558) (242)
Opening Cash balances 112 1,003 690 812 1,696 1,138
Closing Cash balances 1,003 690 812 1,696 1,138 896
May 31, 2010 5
7. Punj Lloyd I 4QFY2010 Result Update
Research Team Tel: 022-4040 3800 E-mail: research@angeltrade.com Website: www.angeltrade.com
DISCLAIMER
This document is solely for the personal information of the recipient, and must not be singularly used as the basis of any investment decision. Nothing in this
document should be construed as investment or financial advice. Each recipient of this document should make such investigations as they deem necessary to
arrive at an independent evaluation of an investment in the securities of the companies referred to in this document (including the merits and risks involved),
and should consult their own advisors to determine the merits and risks of such an investment.
Angel Securities Limited, its affiliates, directors, its proprietary trading and investment businesses may, from time to time, make investment decisions that are
inconsistent with or contradictory to the recommendations expressed herein. The views contained in this document are those of the analyst, and the company
may or may not subscribe to all the views expressed within.
Reports based on technical and derivative analysis center on studying charts of a stock's price movement, outstanding positions and trading volume, as
opposed to focusing on a company's fundamentals and, as such, may not match with a report on a company's fundamentals.
The information in this document has been printed on the basis of publicly available information, internal data and other reliable sources believed to be true,
and are for general guidance only. Angel Securities Limited has not independently verified all the information contained within this document. Accordingly,
we cannot testify, nor make any representation or warranty, express or implied, to the accuracy, contents or data contained within this document. While Angel
Securities Limited endeavours to update on a reasonable basis the information discussed in this material, there may be regulatory, compliance, or other
reasons that prevent us from doing so.
This document is being supplied to you solely for your information, and its contents, information or data may not be reproduced, redistributed or passed on,
directly or indirectly.
Angel Securities Limited and its affiliates may seek to provide or have engaged in providing corporate finance, investment banking or other advisory services
in a merger or specific transaction to the companies referred to in this report, as on the date of this report or in the past.
Neither Angel Securities Limited nor its directors, employees and affiliates shall be liable for any loss or damage that may arise from or in connection with the
use of this information.
Note: Please refer to the important `Stock Holding Disclosure' report on the Angel website (Research Section).
Disclosure of Interest Statement Punj Lloyd
1. Analyst ownership of the stock No
2. Angel and its Group companies ownership of the stock Yes
3. Angel and its Group companies’ Directors ownership of the stock No
4. Broking relationship with company covered No
Note: We have not considered any Exposure below Rs 1 lakh for Angel and its Group companies.
Address: Acme Plaza, ‘A’ Wing, 3rd Floor, M.V. Road, Opp. Sangam Cinema, Andheri (E), Mumbai - 400 059.
Tel : (022) 3952 4568 / 4040 3800
Angel Broking Ltd: BSE Sebi Regn No : INB 010996539 / CDSL Regn No: IN - DP - CDSL - 234 - 2004 / PMS Regn Code: PM/INP000001546 Angel Securities Ltd:BSE: INB010994639/INF010994639 NSE:
INB230994635/INF230994635 Membership numbers: BSE 028/NSE:09946
Angel Capital & Debt Market Ltd: INB 231279838 / NSE FNO: INF 231279838 / NSE Member code -12798 Angel Commodities Broking (P) Ltd: MCX Member ID: 12685 / FMC Regn No: MCX / TCM /
CORP / 0037 NCDEX : Member ID 00220 / FMC Regn No: NCDEX / TCM / CORP / 0302
May 31, 2010 7