Basics/Physics of Echocardiography
•Télécharger en tant que PPTX, PDF•
19 j'aime•4,974 vues

Basics of Echocardiography

Recommandé
Contenu connexe
Tendances
Tendances (20)
Similaire à Basics/Physics of Echocardiography
Similaire à Basics/Physics of Echocardiography (20)
Plus de Dr. Muhammad AzAm Shah
Dernier
Dernier (20)
Basics/Physics of Echocardiography
- 2. Sound ▪ Mechanical vibration transmitted through an elastic medium ▪ Pressure waves when propagate through air at appropriate frequency produce sensation of hearing Vibration Propagation
- 3. As sound propagates through a medium the particles of the medium vibrate Air at equilibrium, in the absence of a sound wave Compressions and rarefactions that constitute a sound wave
- 4. ULTRASOUND ▪ Ultrasound is sound with a frequency over 20,000 Hz, which is the upper limit of human hearing. ▪ The basic principles and properties are same as that of audible sound ▪ Frequencies used for diagnostic ultrasound are between 2 to 20 MHz
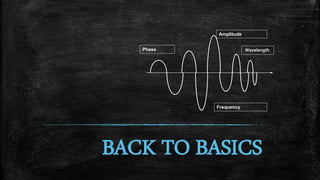
- 6. Sine wave: ▪ Amplitude - maximal compression of particles above the baseline ▪ Wavelength - distance between the two nearest points of equal pressure and density One Compression and rarefaction constitute one sound wave . It can be represented as “Sine wave”. wavelength = speed/frequency
- 7. Amplitude • Defines the Brightness of the image Irrespective of the Freq the Amp remains constant The Higher the Amp the brighter the image and the lower the more darker the images Returning Waves
- 8. FREQUENCY: ▪ Number of cycles per second ▪ Units are Hertz ▪ Ultrasound imaging frequency range 2-20Mhz
- 9. Wave Length and Frequency:
- 10. Velocity = Distance/Time ( 100 meters in 9.81 sec)
- 11. Velocity: ▪ Speed at which a sound wave travels through a medium(cm/sec) ▪ Average speed of ultrasound in body is 1540 m/sec Phase Frequency Amplitude Wavelength velocity = frequency x wavelength • Dependent on physical properties of the medium through which it travels • Directly proportional to stiffness of the material • Inversely proportional to density within a physiological limit
- 12. Rule Of Thumb: ▪ Stiffness and Speed ---- Same Direction ▪ Density and Speed ---- Opposite Direction ▪ Stiffness is related to change in shape – squishability ▪ Density is related to Weight
- 13. Sound velocity in different materials Material Velocity ( m/s) Air 330 Water 1497 Metal 3000 - 6000 Fat 1440 Blood 1570 Soft tissue 1540
- 14. Pulsed Ultrasound ▪ In diagnostic imaging short pulses of acoustic energy are used to create anatomic images. ▪ Continuous wave sound can not create images. CW is used for Doppler ▪ Two component of Pulsed Ultrasound: – The cycles (Transmit time) – Dead time (Receive time)
- 15. 5 Parameters Of Pulsed Sound ▪ Pulse Duration ▪ Spatial Pulse Length ▪ Pulse repetition Period ▪ PRF ▪ Duty Factor
- 16. Pulse Duration ▪ The time from the start of pulse to end of pulse ▪ Transmit time ▪ Can not be changed by sonographer ▪ In clinical imaging its 2-4 cycles
- 17. Spatial Pulse Length ▪ The distance from start to the end of one pulse. ▪ Can not be changed by sonographer ▪ Determines Axial Resolution Spatial pulse length Time Distance
- 18. Pulse Repetition Period ▪ Time from the start of one pulse to the start of next pulse ▪ Includes one pulse and one Listening time ▪ Sonographer can change PRP (listening time only and not pulse duration of period) Time Distance Spatial pulse length
- 19. Pulse Repetition Period • No change in pulse (only listening time) while changing depth PRP PRP
- 20. Pulse Repetition Frequency (PRF) ▪ Number of Pulses created by system in one second. ▪ Not related to Frequency ▪ Determined by depth – Shallow image -- High PRF – Deep Image – Low PRF
- 21. PRP and PRF (Inverse Relation) Depth PRP PRF PRP PRP PRF PRF
- 22. Frequency vs. Resolution ▪ The frequency also affects the QUALITY of the ultrasound image –The HIGHER the frequency, the BETTER the resolution –The LOWER the frequency, the LESS the resolution
- 23. Frequency, Penetration & Resolution Higher the frequency Lower the penetration and Higher the resolution Low the frequency higher the penetration and lower the resolution
- 24. The Trade Off ▪ The trade-off between tissue resolution and penetration ▪ A 12 MHz transducer has very good resolution, but cannot penetrate very deep into the body ▪ A 3 MHz transducer can penetrate deep into the body, but the resolution is not as good as the 12 MHz
- 26. How Is Ultrasound Imaging Done?
- 27. Pierre Curie (1859-1906), Nobel Prize in Physics, 1903 Jacques Curie (1856-1941) PIEZOELECTRIC EFFECT
- 29. Piezoelectric effect results in Compression & Rarefaction:
- 30. Damping Material is used to “ring down” the Pulse Length & Bandwidth which results in improved resolution
- 31. INTERACTIONS OF ULTRASOUND WITH TISSUE ▪ Reflection ▪ Transmission ▪ Attenuation ▪ Scattering
- 32. Reflection – Occurs at a boundary between 2 adjacent tissues or media – The amount of reflection depends on differences in acoustic impedance (z) between media – The ultrasound image is formed from reflected echoes Transducer Z = Density xVelocity
- 33. Angle of Incidence Reflection from a tissue interface at right angle. There is stronger reflection resulting in brighter echo. Reflection at an angle equal to the angle of incidence producing less bright echo.
- 34. Reflected Echoes ▪ Strong Reflections =White dots – Pericardium, calcified structures,diaphragm ▪ Weaker Reflections = Grey dots – Myocardium, valve tissue, vessel walls,liver ▪ No Reflections = Black dots – Intra-cardiac cavities,gall bladder
- 35. ▪ Not all the sound wave is reflected, some continues deeper into the body ▪ These waves will reflect from deeper tissue structures Transducer Transmission
- 36. ▪ The deeper the wave travels in the body, the weaker it becomes ▪ The amplitude of the wave decreases with increasing depth Attenuation Higher frequency , more attenuation Longer the distance (Depth), more the attenuation
- 37. Scattering ▪ Redirection of sound in several directions ▪ Caused by interaction with small reflector or rough surface ▪ Only portion of sound wave returns to transducer
- 38. ▪ The resistance that a material offers to the passage of sound wave ▪ Velocity of propagation “v” varies between different tissues ▪ Tissues also have differing densities “ρ” ▪ Acoustic impedance “Z = ρv” ▪ Soft tissue / bone and soft tissue / air interfaces have large “Acoustic Impedance mismatch” ▪ Difference between Air and Blood Acoustic Impedance
- 39. How Does An Ultrasound Machine Make An Image ? – Ultrasound transducer produces “pulses” of ultrasound waves – These waves travel within the body and interact with various tissues – The reflected waves return to the transducer and are processed by the ultrasound machine – An image which represents these reflections is formed on the monitor Pulse-Echo Method
- 40. Imaging By Ultrasound ▪ Ultrasound imaging is performed by emitting a pulse, which is partly reflected from a boundary between two tissue structures, and partially transmitted. The amount of energy being reflected from each point is given in the diagram as the Amplitude.
- 41. B- Brightness mode shows the energy as the brightness of the point M- Motion mode the reflector is moving so if the depth is shown in a time plot, the motion will be seen as a curve A B C
- 42. 2-Dimensional Imaging ▪ Provides more structural and functional information ▪ Rapid repetitive scanning along many different radii with in an area in the shape of a fan ▪ 2-D image is built up by firing a beam , waiting for the return echoes, maintaining the information and then firing a new line from a neighboring transducer along a neighboring line
- 44. A single ‘FRAME’ being formed from one full sweep of beams A ‘CINE LOOP’ from multiple FRAMES
- 45. Position of Reflected Echoes ▪ How does the system know the depth of the reflection? ▪ TIMING – The system calculates how long it takes for the echo to return to the transducer – The velocity in tissue is assumed constant at 1540m/sec Velocity = Distance xTime 2
- 46. How Is An Image Formed On The Monitor? ▪ The amplitude of each reflected wave is represented by a dot ▪ The position of the dot represents the depth from which the echo is received ▪ The brightness of the dot represents the strength of the returning echo ▪ These dots are combined to form a complete image
- 47. End Of Part 1
- 48. Part II
- 49. Goal of an Ultrasound System ▪ The ultimate goal of any ultrasound system is to make like tissues look alike and unlike tissues look different.
- 50. ▪ Axial Resolution ▪ Lateral Resolution ▪ Temporal Resolution ▪ Contrast resolution Types Of Resolution
- 51. ▪ Spatial Resolution – also called Detail Resolution – the combination ofAXIAL and LATERAL resolution – some customers may use this term Types of Resolution
- 52. Axial Resolution – specifies how close together two objects can be along the axis of the beam, yet still be detected as two separate objects – frequency (wavelength) affects axial resolution ▫ Determinants: ▫ Wavelength – smaller the better ▫ Pulse length – shorter the train of cycles greater the resolution
- 53. Lateral Resolution – the ability to resolve two adjacent objects that are perpendicular to the beam axis as separate objects – Beamwidth affects lateral resolution ▫ Determinants: ▫ Beam width – smaller the better ▫ Depth ▫ Gain
- 54. Lateral Resolution • • • • Only one here 2 structures seen here
- 56. ▪ The lateral resolution is approximately equals the beam diameter. ▪ Since the beam diameter varies with depth, the lateral resolution also varies with depth. ▪ It is best at near zone ( focal ) length.
- 57. ▪ The ability to accurately locate the position of moving structures at particular instants in time ▪ The temporal resolution is limited by the sweep speed of the beam. ▪ And the sweep speed is limited by the speed of sound, as the echo from the deepest part of the image has to return before the next pulse is sent out ad a different angle in the neighboring beam Temporal resolution:
- 58. As the depth of the sector determines the time before next pulse can be sent out, higher depth results in longer time for building each line, and thus longer time for building the sector from a given number of lines, i.e. lower frame rate. Thus reducing the desired depth of the sector results in shorter time between pulses, and thus shorter time for building each line, shorter time for building the same number of lines, i.e. higher frame rate.
- 59. • Use Depth and NOT Zoom • Adjust sector size • Adjust gain • Decreasing the line density Improving Temporal Resolution (Frame Rate)
- 60. • Use Depth and NOT Zoom In the image to the left, the depth has been halved, reducing the time for building each line to half, thus also halving the time for building the full sector, doubling the frame rate (Temporal Resolution)
- 61. Reducing the line density instead and maintaining sector width, results in lower number of lines, i.e. lateral resolution, and gives the same increase in frame rate. Reducing sector width, but maintaining the line density, gives unchanged lateral resolution but higher frame rate, at the cost of field of view. • Line density & Sector width (Temporal Resolution)
- 62. ▪ Contrast Resolution – the ability to resolve two adjacent objects of similar intensity/reflective properties as separate objects Types of Resolution
- 63. The Classic Trade off ..
- 64. How To Make Better Images
- 65. DEPTH: The deeper the field of the image, the slower the frame rate The smallest depth that permits display of the region of interest should be employed
- 66. Gain This function adjusts the displayed amplitude of all received signals
- 67. Signal-To-Noise Ratio ▪ Returning ultrasound waves are referred to as signal, while background artifact is referred to as noise. ▪ Increasing the gain increases the signal-to-noise ratio.
- 68. Time Gain Compensation • TGC will change the gain factor so that equally reflective structures will be displayed with the same brightness regardless of their depth. • TGC allows amplification of ultrasound beams from deeper depths because different amplitudes of ultrasound signals are produced when received from different depths. • MoreTGC is required for higher frequency transducers, which create more attenuation.
- 70. Focusing The Beam • Near Field • Far Field • Imaging quality is best within the near field. • The length of the near field is greater at higher transducer frequencies and wider transducer diameters.
- 71. FOCUS: Indicates the region of the image in which the ultrasound beam is narrowest Resolution is greatest in this region
- 72. Focusing The Beam ▪ Focusing the ultrasound beam does not affect the length of the near field ▪ It produces a narrower beam (and higher resolution) within the near field ▪ But makes the beam wider in the far field ▪ A phased-array transducer also offers electronic focusing, which allows the sonographer to control the depth at which the ultrasound beam is most tightly focused.
- 73. Harmonic Imaging • When an ultrasound wave passes through the body, the tissue generates "harmonic ultrasound waves" because the tissue resonates. • The resonance frequency is typically a multiple of the original frequency (transmitted frequency) • Fundamental components are filtered out. • Images produced with harmonic imaging have a higher resolution and are associated with fewer artifacts than conventional (fundamental) imaging
- 74. Harmonic Imaging
- 75. Thanks for your patience
- 76. ▪ Thus frame rate is a compromise between sector size (width and depth), resolution (line density).
- 77. ▪ High frequency transducers produce pulses with shorter wave length and higher longitudinal resolution.
- 78. Lateral resolution. ▪ The minimum distance that 2 side by side structures can be separated and still produce 2 distinct echoes. •• • • Only one here 2 structures seen here
- 80. More foci per image. ▪ More sound pulses per line. ▪ Superb lateral resolution at all depths. ▪ More time per image scan line. ▪ More time to create a frame. Lower frame rate.
- 81. Multiple focal zones. ▪ An ultrasound pulse has only a single focal zone. ▪ By using multiple sound beams with different focal depth to create a single image line the lateral resolution is optimal at all depths
- 82. Tissue Harmonics
- 83. Tissue Signature
- 85. Ultrasound Interactions with Tissue Interfaces Arrow representVectors whose length equal the strength & direction of the reflected signal A and B represent specular (mirror like) reflectors, the B return signal does not return to the transducer C and D have a rough surface that is typical of human tissue E are objects smaller than a wavelength & therefore scatter the energy
- 86. Interactions of Ultrasound Waves with Tissue The interactions will determine the types of images & artifacts that are generated
- 87. Reflection, Attenuation & Time Gain Conpensation Settings
- 88. Transducer Frequency & Wavelength affect Resolution & Penetration
- 92. Reflection: ▪ Occurs when some of the propagating acoustic energy is redirected and returns toward the transducer. ▪ Reflection off of a very smooth reflector such as a mirror are called specular Reflection and incidence.
- 93. ▪ if the boundary between 2 media has irregularities, then the wave is distributed in a number of different directions. ▪ It occurs when a sound wave strikes material whose size is approximately equal to or smaller than the wavelength of the cycles in the pulse. Scattering:
- 95. Incidence:
- 98. Reflection with normal incidence.
- 99. In clinical ultrasound imaging 99% or more of the incident energy is transmitted forward at a boundary between soft tissues.
- 100. Reflection with oblique incidence. ▪ With oblique incidence, we cannot predict whether transmission and/ or reflection will occur.
- 101. Refraction. ▪ Is a change in direction, or a bending away from a straight line path, of a wave traveling from one medium to another. ▪ Refraction occurs only when there are: 1. Different Propagation Speed. 2. Oblique Incidence between the sound wave and the boundary.
- 102. Snell’s Law.
- 103. Range equation. How does an imaging system determine the depth of a reflecting surface? Time-Of-Flight.
- 104. ▪ Time-Of-Flight: the go-return time Is the elapsed time between pulse production and echo reception by the transducer. ▪ Estimating distance from the go-return time is called echo ranging.
- 109. Machines There are 5 basic components of an ultrasound scanner that are required for generation, display and storage of an ultrasound image. 1. Pulse generator - applies high amplitude voltage to energize the crystals 2. Transducer - converts electrical energy to mechanical (ultrasound) energy and vice versa 3. Receiver - detects and amplifies weak signals 4. Display - displays ultrasound signals in a variety of modes 5. Memory - stores video display
- 110. ▪ Depicted as sine wave-peaks and troughs ▪ One cylce=one compression + one rarefaction ▪ Distance between 2 similar points represent wavelength ▪ 0.15 to 1.5 mm in soft tissue ▪ Frequency- number of wavelengths per unit time ▪ V=f X λ(v=velocity,f =frequency, λ is wavelength)
- 111. ▪ Velocity of sound=1540 m/sec in soft tissue ▪ Wavelength=1.54/f ▪ Amplitude Measure of strength of the sound wave Indicated by height of sine wave above and below baseline
- 114. ▪ Higher the frequency greater the resolution ▪ Higher frequency,lesser the penetration ▪ Loss of ultrasound as it propogates through a medium is called attenuation
- 115. PRICIPLES OF PEIZO ELECTRIC CRYSTALS The charges in a piezoelectric crystal are exactly balanced, even if they're not symmetrically arranged. The effects of the charges exactly cancel out, leaving no net charge on the crystal faces the electric dipole moments—vector lines separating opposite charges—exactly cancel one another out. If you squeeze the crystal , you force the charges out of balance.
- 116. ▪ Now the effects of the charges (their dipole moments) no longer cancel one another out and net positive and negative charges appear on opposite crystal faces. ▪ By squeezing the crystal, voltage is produced across its opposite faces- piezoelectricity ▪ The piezoelectric effect was discovered in 1880 by two French physicists, brothers Pierre and Paul-Jacques Curie, in crystals of quartz, tourmaline, and Rochelle salt (potassium sodium tartrate).They took the name from the Greek work piezein, which means "to press."
- 117. ▪ The phenomenon of generation of a voltage under mechanical stress is referred to as the direct piezoelectric effect ▪ mechanical strain produced in the crystal under electric stress is called the converse piezoelectric effect.
- 118. ▪ Ferro electrics,barium tianate,lead zirconate titanate are used as peizo electric crystals. ▪ Dampening material-shortens the ringing response Also absorbs backward and laterally transmitted acoustic energy ▪ Frequency emitted by transducer is directly proportional to propagation speed within crystal and inversely related to thickness
- 119. ▪ Important feature of ultrasound is ability to direct or focus the beam as it leaves the transducer ▪ Proximal cylindrical and distally divergent ▪ Proximal zone –Fresnel zone ▪ Divergent field is called Fraunhofer zone ▪ Imaging is optimal in near field ▪ Decreasing wavelength or increasing transducer size increase near field
- 121. Haemo”dynamics” ▪ Blood flow is a complex phenomenon ▪ Not a uniform liquid ▪ Flow pulsatile ▪ Vessel walls are elastic
- 122. Properties of Blood ▪ Density-mass of blood per unit volume ▪ Measure of resistance to accelaration ▪ Greater the density,greater the resistance to flow ▪ Viscosity:resistance to flow offered by fluid in motion ▪ 0.035 poise at 37 degree.
- 124. Factors determining flow ▪ Flow rate is determined by – Pressure gradient – Resistance ▪ Viscosity of blood ▪ Radius of lumen ▪ Length of vessel
- 125. Types of flow Laminar flow Shape of parabola Concentric layers,each parallel to vessel wall Velocity of each layer differs Maximal velocity is at centre of vessel Decreasing profile towards peripheries
- 129. Turbulent flow ▪ Obstruction produce increased velocities, flow vortices ▪ Whirlpools shed off in different directions producing variable velocities- chaos ▪ Predicted by Reynolds number ▪ Reynolds number depends on Re=( ρ x c x D)/v ρ-Density of blood D-Vessel diameter c-Velocity of flow V-viscosity
- 130. The Reynolds number is dimensionless If Re is less than 1200 the flow will be -laminar 1200-2000 flow is described as -transitional Greater than 2000 -turbulent