Tobacco-attributed mortality from a question on smoking on the South African Death Certificate

In 1997, the South African death notification form was revised to include questions on the smoking status of the deceased. This study used 481,640 notifications of deaths occurring between 1999 and 2007 to assess smoking-attributed mortality in South Africa. Methods: A case-control proportional mortality design was used to estimate smoking-associated relative risks and attributable fractions for a number of potentially smoking-related causes of death. Cases: deaths from underlying causes known from other studies to be causally associated with smoking. Controls: deaths from medical conditions expected to be largely unrelated to smoking. The attributable fractions were then used to calculate the annual average number of deaths attributable to smoking in South Africa.

Recommandé
Contenu connexe
Tendances
Tendances (18)
Similaire à Tobacco-attributed mortality from a question on smoking on the South African Death Certificate
Similaire à Tobacco-attributed mortality from a question on smoking on the South African Death Certificate (20)
Plus de Cancer Council NSW
Plus de Cancer Council NSW (20)
Dernier
Dernier (20)
Tobacco-attributed mortality from a question on smoking on the South African Death Certificate
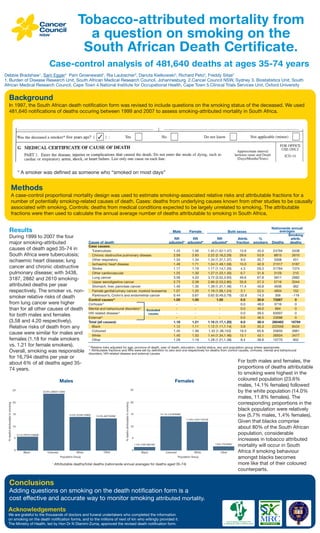
- 1. Tobacco-attributed mortality from a question on smoking on the South African Death Certificate. Acknowledgements We are grateful to the thousands of doctors and funeral undertakers who completed the information on smoking on the death notification forms, and to the millions of next of kin who willingly provided it. The Ministry of Health, led by Hon Dr N Dlamini-Zuma, approved the revised death notification form. Background In 1997, the South African death notification form was revised to include questions on the smoking status of the deceased. We used 481,640 notifications of deaths occuring between 1999 and 2007 to assess smoking-attributed mortality in South Africa. Methods A case-control proportional mortality design was used to estimate smoking-associated relative risks and attributable fractions for a number of potentially smoking-related causes of death. Cases: deaths from underlying causes known from other studies to be causally associated with smoking. Controls: deaths from medical conditions expected to be largely unrelated to smoking. The attributable fractions were then used to calculate the annual average number of deaths attributable to smoking in South Africa. Results During 1999 to 2007 the four major smoking-attributed causes of death aged 35-74 in South Africa were tuberculosis; ischaemic heart disease; lung cancer and chronic obstructive pulmonary disease; with 3438, 3187, 2882 and 2610 smoking- attributed deaths per year respectively. The smoker vs. non- smoker relative risks of death from lung cancer were higher than for all other causes of death for both males and females (3.58 and 4.20 respectively). Relative risks of death from any cause were similar for males and females (1.18 for male smokers vs. 1.21 for female smokers). Overall, smoking was responsible for 16,794 deaths per year or about 6% of all deaths aged 35- 74 years. For both males and females, the proportions of deaths attributable to smoking were highest in the coloured population (23.6% males, 14.1% females) followed by the white population (14.0% males, 11.8% females). The corresponding proportions in the black population were relatively low (5.7% males, 1.4% females). Given that blacks comprise about 80% of the South African population, considerable increases in tobacco attributed mortality will occur in South Africa if smoking behaviour amongst blacks becomes more like that of their coloured counterparts. Conclusions Adding questions on smoking on the death notification form is a cost effective and accurate way to monitor smoking attributed mortality. Debbie Bradshaw1 , Sam Egger2 Pam Groenewald1 , Ria Laubscher3 , Danuta Kielkowski4 , Richard Peto5 , Freddy Sitas2 1. Burden of Disease Research Unit, South African Medical Research Council, Johannesburg 2.Cancer Council NSW, Sydney 3. Biostatistics Unit, South African Medical Research Council, Cape Town 4.National Institute for Occupational Health, Cape Town 5.Clinical Trials Services Unit, Oxford University * A smoker was defined as someone who “smoked on most days” Case-control analysis of 481,640 deaths at ages 35-74 years ^ Attributable deaths/total deaths (nationwide annual averages for deaths aged 35-74) 5.7% (7073/123828)^ 23.6% (2663/11284)^ 14.0% (2246/16085)^ 13.3% (827/6208)^ 0510152025 %deathsattributabletosmoking Black Coloured White Other Population group Black Coloured White Other %deathsattributabletosmoking 5 20 15 10 25 0 Population Group 23.6% (2663/11284)^ 14.0% (2246/16085)^ 13.3% (827/6208)^ 5.7% (7073/123828)^ 1.4% (1361/98730)^ 14.1% (1318/9366)^ 11.8% (1231/10419)^ 1.6% (75/4562)^ 0510152025 %deathsattributabletosmoking Black Coloured White Other Population group Black Coloured White Other %deathsattributabletosmoking 5 20 15 10 25 0 Population Group 14.1% (1318/9366)^ 11.8% (1231/10419)^ 1.6% (75/4562)^ 1.4% (1361/98730)^ Cause of death Male RR adjusted* Female RR adjusted* RR adjusted* Attrib. fraction % smokers Deaths Smoking attrib. deaths Case causes: Tuberculosis 1.43 1.56 1.45 (1.42-1.47) 13.9 45.0 24794 3438 Chronic obstructive pulmonary disease 2.09 2.83 2.22 (2.16,2.29) 29.6 53.9 8815 2610 Other respiratory 1.34 1.34 1.34 (1.31,1.37) 9.0 35.7 5008 451 Ischaemic heart disease 1.49 1.71 1.54 (1.49,1.59) 15.0 42.9 21317 3187 Stroke 1.17 1.19 1.17 (1.14,1.20) 4.3 29.3 31784 1374 Other cardiovascular 1.25 1.30 1.27 (1.23,1.30) 6.7 31.9 3129 210 Lung cancer 3.58 4.20 3.72 (3.52,3.93) 49.6 67.8 5811 2882 Upper aerodigestive cancer 2.73 2.38 2.66 (2.53,2.80) 35.8 57.3 5716 2044 Stomach, liver, pancreas cancer 1.40 1.35 1.39 (1.31,1.46) 11.4 40.8 4936 562 Female genital/urinary cancer, myeloid leukaemia 1.07 1.20 1.16 (1.09,1.24) 3.1 22.5 4834 152 Parkinson’s, Crohn’s and endometrial cancer 0.44 0.67 0.62 (0.49,0.79) -32.6 14.3 356 -116 Control causes^ 1.00 1.00 1.00 0.0 30.6 73267 0 Cirrhosis^ - - - 0.0 48.0 3716 0 Mental and behavioural disorders^ - - - 0.0 49.0 894 0 HIV related disease^ - - - 0.0 39.5 63007 0 External^ - - - 0.0 46.5 23098 0 Total (all causes): 1.18 1.21 1.18 (1.17,1.20) 6.0 38.4 280482 16794 Black 1.12 1.11 1.12 (1.11,1.14) 3.8 35.3 222558 8434 Coloured 1.45 1.36 1.42 (1.38,153) 19.3 65.6 20650 3981 White 1.40 1.53 1.44 (1.34,1.46) 13.1 43.1 26504 3477 Other 1.29 1.19 1.28 (1.21,1.38) 8.4 38.8 10770 902 * Relative risks adjusted for age, province of death, year of death, education, marital status, sex and population group where appropriate ^ Attributable fractions and RRs were set by definition to zero and one respectively for deaths from control causes, cirrhosis, mental and behavioural disorders, HIV-related disease and external causes. Both sexes Males Females Nationwide annual averages Excluded causes