Orientation Effects of Stress Concentrators on the Material Deformation Behav...
keating_PRINT
1. Structural joints were extracted from two historic railroad bridges.
The joints are made of eyebars, pins, and bodies connecting to the
rest of the bridge. Eyebars and pins were extracted from joints and
wear measurements were taken on both the eyebar heads at the
hole where the joint pin connection is located and on the pins
themselves. The purpose was to quantify the average wear at the
two locations in preparation for fatigue testing to obtain the
Remaining Useful Life (RUL) of the individual eyebars.
In summary, the eyebar heads showed larger wear values relative to their
original diameters whereas the pins showed smaller wear values, with large
variability in both measurements.
Inspection of the pins showed that the eyebars located towards the middle of
the joint, at locations 6 and 7 shown above, were very mobile in their ability to
rotate about the pin axis. This mobility led to greater wear values at those
locations, which is evident from visual inspection. Additionally, the grooved
locations on the pins coincide with the locations of the joint plates and were
caused by the thin plate area grinding out grooves in the pins over time.
Peter B. Keating, Ph.D., P.E and Carlos Brown, Research Assistant
Center for Railway Research, Texas A&M Transportation Institute
FATIGUE AND SERVICE ANALYSIS
OF RAILROAD EYEBAR MEMBERS
RESULTS
This representative sample of wear values allows us to infer about the
greater population of wear in old railroad bridge joints. A knowledge
of the mechanisms of wear along with empirical data helps us to
understand possible failure modes associated with time dependent
degradation and the effects of wear on fatigue life. Once the fatigue
testing of eyebars is complete, a better understanding of the effect of
wear on RUL of steels eyebars will be obtained.
IMPACT ON RAILWAY COMMUNITY
BACKGROUND
APPROACH: Hole wear measurements for the eyebars were taken by
measuring the gap between a 6 in diameter disc and the wall of the eyebar
hole as shown below.
Wear measurements for the pins were taken by measuring the
circumference of the pin at locations along its length and
calculating the wear, w as
PROBLEM STATEMENT AND APPROACH
Eyebar Eyebar Head
EyebarHead
6inchDisc
Gap
w = 6 – c
π
where c = circumference.The wear value was calculated by
subtracting the diameter c/pi from a 6 in nominal diameter.
WearfromPlate
DeepGrooves
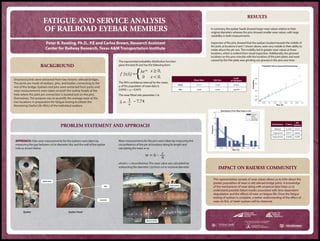
Distribution P Value
AD
Statistic
0.5137
0.6623
0.1944
0.0777
0.5828 0.4387
Weibull
Lognormal
Exponential
The exponential probability distribution function
gives the best fit and has the following form
f (x;λ) =
λe-λx
0 x < 0.
x ≥ 0,
λ = 1
�
~ 7.74
The 95% confidence interval for the mean,
µ of the population of wear data is:
0.0910 < µ < 0.1673
The wear fitted rate parameter λ is:
Mean Wear
Head
Pin
Std. Dev.
Coeff.
of Variation
0.121 0.106 87.6%
0.020 0.045 226.8%
Distribution Fit for Wear Data (n=42)
Frequency
Wear (in)
Probability Plot for Exponential Distribution
Probability
Wear (in)