1. Traffic congestion in U.S. cities has grown rapidly in recent years, and
numerous solutions are needed to address the problem. New research is
described for producing basic improvements in the practice of traffic
signal timing design, which is one of the many available weapons for
fighting congestion and delay. Models in the literature for predicting
traffic-actuated phase times are oversimplified. In some cases, they do not
recognize the signal settings associated with today’s controllers, which
affect phase times. In other cases, models from the literature do not rec-
ognize operational effects (for example, progression, queue blockage, per-
mitted left turn, critical movement, early return to green, and stochastic
effects) that affect phase times or that are applicable only to isolated sig-
nals instead of coordinated signals. Consequently, the recommended
average phase times are not practical, and the resulting performance esti-
mates and timing plan designs are unlikely to materialize in the field. The
overall goal of this research is to describe and demonstrate an improved
methodology for predicting actuated phase times. An improved method-
ology is needed to improve the overall timing plan design process. Exper-
imental results indicate an improvement in the accuracy of actuated
phase time calculation based on the improved methodology.
Research suggests that traffic congestion in U.S. cities has grown
rapidly in recent years and that “a full array of solutions and measures
are essential in addressing the mobility problem” (1). Although no
single device or strategy can be expected to solve the problem of traf-
fic congestion by itself, signal timing analysis and optimization has
been found to be a cost-effective strategy (2, 3). Various signal system
analysis models are now available for practitioners and engineers.
PROBLEM STATEMENT
Stochastic simulation models offer a realistic interpretation of traf-
fic flow and performance, but their function is limited to evaluating
the performance of a specified operational alternative, and they
require much more input data than does a simpler deterministic
model. Deterministic models, which are more efficient in terms of
their input data requirements and program running times, can
attempt to find the best set of operating parameters for a specified
performance objective. However, they often lack certain detailed
treatment of traffic flow characteristics found within the stochastic
simulation models. The simplifying assumptions required to support
a more efficient analysis have, in many cases, compromised the
quality of the final product. As a result, the performance estimates
from deterministic analyses, in addition to the timing plans being
implemented in many traffic control systems today, still have sig-
nificant room for improvement in terms of their accuracy and their
correlation with real-world field conditions.
One of the most promising areas for improvement is modeling
traffic-actuated control, in which instantaneous information from traf-
fic detectors is incorporated into the control tactics for fine-tuning
intersection performance. Existing deterministic models apply the
simplifying assumption of nonfluctuating, average phase times, in
which the operation at each intersection is characterized by a series
of fixed-duration intervals. When applicable, the optimization process
determines the optimal duration and position of each interval under
the assumption that phase times do not fluctuate between cycles.
Some adjustments are made in an attempt to represent the effects of
fluctuating phase times, but the results so far have not been entirely
satisfactory.
OBJECTIVES
The objectives of this paper are to (a) identify specific shortcomings
of the existing models, (b) describe a set of proposed modeling
improvements, and (c) test the relative performance of different
strategies for predicting actuated phase times within deterministic
traffic analysis models.
BACKGROUND
TRANSYT Deterministic Traffic Analysis Model
The Traffic Network Study Tool (TRANSYT) (4) was developed by
the Transport Research Laboratory in the United Kingdom. For
decades, it has been used in various parts of the world for traffic con-
trol system timing design and evaluation. TRANSYT, referenced
throughout this paper, is a typical example of a deterministic
model that stands to benefit from improved prediction of traffic-
actuated phase times. TRANSYT-7F (5), developed by the Univer-
sity of Florida Transportation Research Center as a derivative work,
is also referenced here.
Target Degree of Saturation Strategy
There are several ways to model actuated control, including the pre-
diction of vehicle delay and the design of control parameters such
as detector layout and the maximum green setting. This paper
focuses on one aspect of actuated control modeling: predicting aver-
age phase times. Actuated phase time calculation models from the
literature have generally followed two strategies: the target degree
of saturation strategy, and the queue service time–green extension
time strategy.
Prediction of Traffic-Actuated
Phase Times on Arterial Streets
David Hale and Kenneth G. Courage
D. Hale, Weil Hall, Room 518a, and K. G. Courage, Weil Hall, Room 513e, Trans-
portation Research Center, University of Florida, Gainesville, FL 32611-2083.
84 s Transportation Research Record 1811
Paper No. 02-2388
2. The target degree of saturation strategy (5–9) specifies that actu-
ated phases facilitate efficient signal operation when operating at
predictable degrees of saturation, often slightly below capacity. The
primary goal of an actuated phase is to terminate the right-of-way as
soon as the initial queue of vehicles has been served. Ideally, the
degree of saturation would be 100%, and the right-of-way would be
terminated immediately after the queue was served.
In the field, however, drivers in a standing queue are sometimes
not paying attention, and conservative drivers sometimes prefer a
large gap between themselves and their lead vehicle. Because of
this, detectors sometimes sense a gap between vehicles before the
queue has been served, which causes premature phase termination
and excessive delay times. In practice, there should be at least a
2- or 3-s gap requirement to avoid premature phase termination.
Because of this required 2- or 3-s gap, the degree of saturation tends
to be somewhat lower than 100% on actuated phases. Some models
from the literature (6–8) have typically recommended a fixed degree
of saturation such as 85%. Another model (9) has used more detailed
calculations to estimate the degree of saturation on actuated phases.
Queue Service Time–Green
Extension Time Strategy
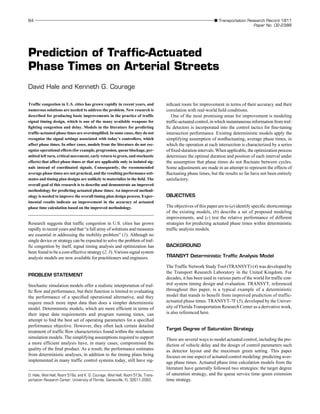
The queue service time–green extension time strategy (7, 10) speci-
fies that the length of an actuated phase can be estimated by summing
the queue service time (gs), the green extension time (ge), and the inter-
green (yellow plus all-red) time. The queue service time represents
the amount of time necessary to serve the initial standing queue.
Deterministic models are able to apply the queue accumulation poly-
gon concept to estimate queue service times. Figure 1 presents a poly-
gon in the shape of a triangle, implying that the rate of arrivals on red
and departures on green are both uniform. The shape of the polygon
is useful in determining queue service time and other measures. The
shape of the polygon can become complex in response to field condi-
tions causing nonuniform arrivals or departures, allowing queue
service time to be computed accurately under various conditions.
Equations 1 and 2 (7) provide an example of how queue service
time can be computed as an algebraic interpretation of the queue
accumulation polygon.
where
qr, qg = red arrival rate and green arrival rate, respectively [vehicles
(veh)/s];
r = effective red time (s);
s = saturation flow rate (veh/s); and
fq = queue calibration factor.
Although the queue accumulation polygon is a strong indicator of
queue service time, it is not as useful in determining the green exten-
sion time. Figure 1 indicates that the green extension time takes
place beyond the polygon boundaries. The green extension time rep-
resents the amount of time necessary for a detector to locate the nec-
essary gap (typically 2 or 3 s) in the traffic stream after the queue
service time. Equations 3, 4, and 5, developed by Akcelik (11), indi-
fq = −
1 08 0 1 2
2
. . ( )
actual green
maximum green
g f
q r
s q
s q
r
g
=
−( )
( )1
Hale and Courage Paper No. 02-2388 85
cate how green extension time can be computed as a function of
several actuated control parameters.
where
e0 = unit extension time setting,
t0 = time during which the detector is occupied by a passing
vehicle,
q = total arrival flow (veh/s) for all lane groups that actuate the
phase under consideration,
Lv = vehicle length, assumed to be 5.5 m,
Ld = detector length (m),
v = vehicle approach speed (km/h),
∆ = minimum arrival (intrabunch) headway (s),
ϕ = proportion of free (unbunched) vehicles, and
λ = a parameter calculated as follows:
Once the queue service times and green extension times have been
calculated, the phase times are calculated by adding on the yellow and
all-red times, which are values known to the analyst and do not require
modeling or calculation. Once the phase times have been calculated,
additional recalculations become necessary, in adherence to numerous
constraints (maximum green, minimum green, background cycle
length) and because actuated phase times are affected by other
actuated phase times within the same signal or network. When a
background cycle length is in effect, the nonactuated, major street
through-movement phase typically receives all the remaining green
time within the cycle after the actuated phase times are computed.
MOTIVATION
The initial objective of this paper is to identify shortcomings of the
existing models. Regarding the target degree of saturation strategy,
recommended phase times are potentially impractical because of
the inherent difficulty in controlling degrees of saturation that are
likely to occur in the field. Although actuated degrees of saturation
are desired to be somewhat lower than 100%, the actual degrees of
λ
ϕ
=
−
q
q1
5
∆
( )
t
L L
v
d v
0 4=
+( )
( )
g
e
q
e
e t
= −
+ −( )λ
ϕ λ
0 0
1
3
∆
( )
Red Green
No.ofvehiclesinthequeue
Time (seconds)
Queue Service Time
Green Ext. Time
FIGURE 1 Sample queue accumulation polygon.
3. saturation can vary widely and can even exceed 100% in certain
cases. Moreover, these degrees of saturation are a function of sev-
eral control parameters (minimum green, maximum green, gap set-
ting, detector layout) as well as complex and unpredictable traffic
flow behavior, including progression, queue spillback, permitted
movement, and stochastic effects. Because the degrees of satura-
tion are difficult to control, the model-recommended phase times
are sometimes impossible to achieve in the field.
Regarding the queue service time–green extension time strategy,
available models from the literature are oversimplified in a few ways.
The queue service time and green extension time formulas are primar-
ily designed to analyze isolated signals and are not detailed enough
to realistically model coordinated signals and network-wide traf-
fic flow patterns. When isolated signals are being analyzed, the exist-
ing methodologies do not provide the proper treatment for stochastic
effects, which may compromise the accuracy of the results.
SPECIFIC SHORTCOMINGS AND ASSOCIATED
PROPOSED IMPROVEMENTS
The queue service time–green extension time modeling strategy was
chosen as the underlying structure for an effective deterministic
model. Upcoming discussions will demonstrate that actuated phase
times are calculated with greater accuracy when it becomes possi-
ble to analyze the queue service times and green extension times in
greater detail.
The following discussion identifies six specific shortcomings
and, to address the second overall objective of this paper, proposes
candidate improvements for each.
Candidate Improvement 1: Retrieval of
Queue Service Times from Queue Profile
The first improvement is related primarily to coordinated signals.
Traffic flow patterns at coordinated signals are subject to progres-
sion, queue blockage, and permitted movement effects. Each of these
effects potentially changes queue service times at a coordinated sig-
nal, including the uncoordinated approaches. Queue service time for-
mulas are unable to realistically model network-wide progression,
queue blockage, and permitted movement effects.
Deterministic models such as TRANSYT continuously monitor
queue lengths throughout the network. These queue lengths are
appropriately sensitive to any complications simulated by the pro-
gram, including progression, queue blockage, and permitted move-
ment effects. Therefore, obtaining unadjusted queue service times
from a program-generated queue profile is an ideal mechanism for
recognizing network-wide traffic flow conditions.
Other deterministic models such as the Highway Capacity Man-
ual signalized intersection procedures (7) should be able to adjust
queue service times in response to permitted movement effects but
are limited in analyzing progression effects and unable to analyze
queue blockage effects. For models such as this, obtaining queue
service times from a queue profile may not be practical.
Candidate Improvement 2: Adjustment of
Queue Service Times for Stochastic Effects
The second candidate improvement is one of three that are applica-
ble to isolated signals as well as coordinated signals. Three of six
86 Paper No. 02-2388 Transportation Research Record 1811
candidate improvements (including this one) are applicable to both
isolated and coordinated signals.
Equation 1 contains the variable fq denoting the queue calibra-
tion factor. This factor is unrelated to the queue accumulation
polygon and is included in the formula “to account for randomness
in arrivals in determining the average queue service time” (7).
Randomness has a significant impact on phase times when there
are competing movements or lanes within the phase. Here, the effects
of competing movements or lanes are referred to as stochastic
effects.
In the literature, actuated phase times are designed to handle the
critical movement with the highest flow ratio (v/s) or volume
divided by saturation flow rate. However, noncritical movements or
lanes are sometimes responsible for extending the phase. For exam-
ple, a noncritical movement could be responsible for terminating the
phase length on 3 of 10 cycles. Because of this, average phase times
are higher in the field than they are in a model that ignores the non-
critical movements. An exception occurs when noncritical move-
ments or lanes have an extremely low flow ratio, so that they have
little chance of extending the phase.
Upcoming experimental results indicate that an adjustment to the
original model-calculated queue service time allows for improved
accuracy. The results also indicate that such an adjustment, to com-
pensate for stochastic effects, is necessary only when competing
movements or lanes exist in the same phase. For example, no queue
service time adjustments are necessary for an actuated phase com-
pletely governed by a single lane, such as a protected left-turn phase
having a green arrow. Because of this, a selective application of the
queue calibration factor is indicated, as opposed to automatically
applying the factor, as the Highway Capacity Manual queue service
time formula does.
Candidate Improvement 3: Green Extension
Times That Reflect Flow Profile
In theory, this candidate improvement is primarily applicable to
coordinated signals. Upcoming experimental results indicate an
improvement in modeling isolated signals as well. It was stated ear-
lier that traffic flow patterns at coordinated signals are subject to pro-
gression, queue blockage, and permitted movement effects, although
permitted movements affect isolated signals as well. These effects
also potentially change the green extension time on every phase of a
coordinated signal, including the uncoordinated approaches.
Uncoordinated approaches, although not directly affected by pro-
gression, may be indirectly affected because of changes in the major
street phase times. Green extension time formulas are unable to real-
istically model network-wide progression, queue blockage, and
permitted movement effects.
Deterministic models such as TRANSYT are able to monitor flow
profiles throughout the network. These flow profiles are sensitive to
any complications simulated by the program, such as progression,
queue blockage, and permitted movement effects. Unlike queue ser-
vice times, unadjusted green extension times cannot be extracted
directly from the results of macroscopic simulation. However, accu-
racy of the predicted green extension times can improve significantly,
based on flow profile-supplied information.
Figure 2 presents a sample calculation for computing green exten-
sion time based on the flow profile. The top row of values beginning
with “85” represents the Poisson probability of zero vehicle arrivals
during that step of the cycle. A probability of 85% is derived from a
4. flow rate of 600 veh/h (expected at that point in the cycle) as indicated
by Equation 6:
The second row of values beginning with “56” represents the
unadjusted probability of phase termination. A probability of 56%
is derived by multiplying the preceding probabilities (0.85 × 0.82
× 0.80). In this example, the previous three probabilities are multi-
plied because a gap setting (also called a unit extension) of 3 s is in
effect, and it is necessary to have three consecutive seconds with
zero arrivals before terminating the phase.
The third row of values, also beginning with “56,” represents the
adjusted probability of phase termination. This is best understood
by considering the values while reading from left to right. The over-
all probability of phase termination is 56% after 3 s, which indicates
a 44% chance of extending the phase. Although the unadjusted
probability of phase termination is also 56% after 6 s, this must be
factored down by 44% to obtain the actual probability of phase ter-
mination, in this case 0.56 × 0.44 to obtain 0.25. The overall phase
termination probabilities are computed in this manner until the max-
imum green time, or force-off point, is reached, at which time the
probability of phase termination is computed as 100% minus the
sum of all previous probabilities.
This green extension time model, which is based on applied prob-
ability analysis of the flow profile, computes results that reflect the
level of progression. It also appears to compute realistic results even
when there is no progression, and the flow profile is completely flat.
Deterministic models for isolated signals, such as the Highway
Capacity Manual signalized intersection procedures, could still apply
this model, even though they are limited in their ability to simulate
the flow profile.
Candidate Improvement 4: Green Extension
Time Adjustment for Stochastic Effects
This candidate improvement is applicable to both isolated and coor-
dinated signals. It was stated earlier that stochastic effects potentially
have a significant impact on average phase times when there are com-
peting movements or lanes moving during the phase. Although mod-
els in the literature typically scrutinize critical movements, noncritical
movements or lanes are sometimes responsible for extending the
phase, which may increase the average green extension time.
P e0 0 85 6600 3600
( ) = ≈−
. ( )
Hale and Courage Paper No. 02-2388 87
Upcoming experimental results indicate that an adjustment to the
original model-calculated green extension time allows for improved
accuracy.
As discussed earlier, the adjustment to compensate for stochastic
effects is necessary only when competing movements or lanes exist
during the same phase. Under these conditions, there is a higher prob-
ability of extending the green, based on the competing traffic vol-
umes. Simply adding the competing traffic volumes and computing
green extension probabilities based on the total traffic volume is not
an ideal treatment. For example, a 200-veh/h movement together
with a 240-veh/h movement in the same phase extends the green dif-
ferently than a single movement having 440 veh/h. Instead of simple
addition, it is appropriate to use the additive law of probability (12)
indicated by Equation 7:
Calculation of the adjusted volume, given a 200-veh/h move-
ment moving together with a 240-veh/h movement, is indicated by
Equation 8:
Ideally, this calculation is repeated throughout the cycle, to
reflect a changing flow profile, if the signal is coordinated. Then
the adjusted volumes can be used to compute the overall green
extension times.
Candidate Improvement 5:
Critical Movement Search
This candidate improvement is also applicable to both isolated and
coordinated signals. Under simple conditions the critical movement
is determined by calculating the flow ratio (volume divided by satu-
ration flow rate) for each movement. The movement with the highest
flow ratio is considered critical, and most methodologies focus their
attention on modeling this movement. In the case of overlapping actu-
ated phases, the critical movement is the one that would require the
longest phase time, which means phase times for each individual
movement must be calculated according to the full-blown model
(i.e., computation of queue service time and green extension time).
In determining the unadjusted queue service time, it is necessary
to determine which movement is responsible for having the queue
that extends further into the cycle than any other movement’s queue.
Once this critical queue service time has been obtained, an adjust-
ment for stochastic effects may be applied as described earlier. In
determining the unadjusted green extension time, the previously
computed queue service time indicates where in the cycle the flow
profile can begin to be examined.
Candidate Improvement 6: Dynamic Green
Time Reallocation Within Cycle
This final candidate improvement is applicable only to coordinated
signals with a background cycle length. Deterministic actuated
control models from the literature specify that, once the actuated
phase times have been determined, any unused green time within
Adjusted volume =
vph3600
200
3600
240
3600
200
3600
240
3600
427 8×
+
− ×
= ( )
P A B P A P B P A B∪( ) = ( ) + ( ) − ∩( ) ( )7
85 82 80 80 82 85 87 89 92 95 97 97
56 56 71 89
25 13 5 156
P(0 arrivals)
P(gap-out)
P(gap-out)
overall
hourly
flow rate
force-off
FIGURE 2 Sample calculation of green extension time:
ge = (0.56)(3)+(0.25)(6)+(0.13)(9)+(0.05)(12)+(0.01)(13)=5.1 s.
5. the cycle is assigned to the major street nonactuated phase. In the
field, actuated phases with higher degrees of saturation have been
observed to absorb unused green time (from the preceding actuated
phases) for themselves, so the unused green time does not reach
the major street nonactuated phase. Moreover, modern controller
software can further control the allocation of unused green.
Because of the potential for this type of behavior, it is necessary
to calculate the actuated phase times sequentially, beginning with
the “first” actuated phase that immediately follows the major street
nonactuated phase. When calculations are done in this order, it is
possible to correctly reassign the unused green time.
EXPERIMENTAL DESIGN
The third and final overall objective of this paper is to test the rela-
tive performance of different modeling strategies, both new and old.
To test the proposed improvements for predicting actuated phase
times, it is necessary at the outset to choose a specific deterministic
model for improvement as well as a stochastic simulation model for
evaluating the improvements. These two choices will establish the
scope of the experimental design.
Validation Involving CORSIM as a
Surrogate for Field Data
Ideally, testing and validating the experimental results, which in-
volves improved prediction of traffic-actuated phase times, would be
accomplished by collecting and analyzing field data; however, an ade-
quate empirical validation would require resources several orders
of magnitude beyond those available to this project. This limitation
dictates the need for simulation as a surrogate for field data collection.
The choice of a simulation model is not difficult in this case. The
corridor simulation (CORSIM) (13) model has been developed and
enhanced continually over the past 30 years by the FHWA. It was
designed specifically for the purpose intended by this project (i.e., a
surrogate for field data) and is used extensively for that purpose.
CORSIM is especially strong in the treatment of an actuated
control. It models this type of control explicitly with a software
module based on the real-time control logic contained within the
actual field hardware (13). In addition, previous research indicates
that actuated phase times simulated by CORSIM closely replicate
those observed directly in the field (10). It is noted that CORSIM
is unable to simulate certain esoteric actuated control strategies
88 Paper No. 02-2388 Transportation Research Record 1811
and is unable to simulate the unusual or unexpected behavior of
certain drivers. Nevertheless, CORSIM is used for testing and val-
idation of the phase time calculation enhancements described in
this paper.
Implementation of Recommended Improvements
Within TRANSYT-7F
The TRANSYT program introduced earlier is a logical choice for
the deterministic model. The specific version of the TRANSYT
model used in this study is TRANSYT-7F, release 9.1. The recog-
nition of TRANSYT-7F among practitioners, combined with the
institutional support of the University of Florida, makes it a natural
choice for the purposes of this project. In addition, the ability of
TRANSYT-7F to provide network-wide information on the flow pro-
file and queue profile allows for better testing of the recommended
improvements described earlier.
Candidate Models
The first model (referred to as Model 1) to be tested is the original tar-
get degree of saturation model as implemented within TRANSYT-7F.
Model 2 possesses five of the six proposed improvements but imple-
ments Akcelik’s green extension time formula. Model 3 contains all
six proposed improvements described earlier in this paper. Results
from these three deterministic models will be compared with results
from the CORSIM stochastic simulation model.
By choosing the candidate models this way, it is not possible to
gauge the effectiveness of each of the six proposed candidate improve-
ments. Instead, the most highly refined model having all six new ele-
ments is to be compared with the original target degree of saturation
strategy, and Akcelik’s green extension time formula is directly com-
pared with the proposed strategy, which computes green extension
times to reflect the flow profile.
Testing Conditions
Table 1 presents the testing conditions that were designed to stress
specific aspects of candidate models. The initial experiments (1a,
1b, and 1c) involve a simple two-phase timing plan, vehicle arrivals
on two approaches (northbound and eastbound) only, and through
movements only. Experiment 1d involves the same conditions
4
-a- -b- -c- -d- -a- -b- -a- -b-
Single Intersection * * * *
Arterial Street * * * * *
Background Cycle Length * * * * * * * *
MultilaneLane Groups * * * * * *
Competing Links * * * * * *
Progression * * * *
Permitted Left-Turns * *
Optimization *
Experiment Number
Experiment Characteristics
1 2 3
TABLE 1 Experimental Conditions
6. as Experiments 1a, 1b, and 1c, except that, to examine competing
movement effects, vehicle arrivals occur on four approaches. A
postprocessor was used in the initial experiments to compute aver-
age phase times in CORSIM based on 2 h of simulation, which
allows for precise determination of CORSIM’s average phase
time. A range of gap settings (2 to 5 s) and traffic volumes (300 to
700 veh/h) are used to ascertain behavior under conditions that are
both stable and unstable, congested and uncongested.
Experiments 2, 3, and 4 introduce additional complications to
obtain further insight. CORSIM and TRANSYT-7F data sets for
these experiments were obtained from a University of Florida proj-
ect for developing traffic engineering benchmark data (14). The
arterial street conditions involve 1,000-ft signal spacing and differ-
ent operating characteristics at each individual intersection, includ-
ing traffic volume, degree of saturation, lane channelization, phase
sequence, and left-turn treatment. Numerous intersections with com-
peting lanes and multilane groups allow for additional testing of
stochastic effects beyond Experiment 1.
Whereas the CORSIM average phase times from Experiment 1 are
based on 2 h of simulation, average phase times from Experiments 2
and 3 are based on 30 min of observed simulation (animation).
Experiment 2 involves multiple offset designs to evaluate various
progression effects. Experiment 3 introduces permitted left turns as
an additional complication.
Hale and Courage Paper No. 02-2388 89
EXPERIMENTAL RESULTS
Experiment 1: Single Intersection
Table 2 presents the results of Experiments 1a, 1b, 1c, and 1d. The
values indicate average actuated phase times with the exception of
Experiment 1b results, where values indicate the actuated cycle
lengths. Some of the actuated cycle lengths appear to be unrealisti-
cally low. In general, model testing does not require the type of high
minimum green times and cycle lengths typically implemented in
the field to satisfy safety requirements, although such constraints are
present in Experiments 2 and 3.
The three candidate models are judged according to their corre-
lation with CORSIM. Because it is difficult to evaluate the correla-
tion by inspection, the average error for each model is listed at the
bottom of the table. Calculation of the error value is illustrated by
Equation 9:
First, the results from Table 2 indicate that Model 2 and Model 3,
which are based on the queue service time–green extension time
strategy, achieve much more consistent correlation with CORSIM
than does Model 1, which is based on the target degree of satura-
Error = model phase time CORSIM phase time−( )2
9( )
Model* C 1 2 3 C 2 3 C 1 2 3 C 1 2 3
300vph
Gap
2 19.6 18.0 20.3 19.0 17.4 20.5 17.1 20.4 18.0 20.6 19.5 22.4 18.0 21.5 20.2
3 20.7 18.0 21.5 20.4 20.5 24.1 21.2 22.2 18.0 22.5 21.6 24.4 18.0 23.3 22.4
4 21.9 18.0 22.6 21.8 23.1 28.0 25.6 24.7 18.0 24.2 24.3 25.9 18.0 25.2 24.8
5 23.4 18.0 24.1 23.4 27.7 32.1 29.9 26.2 18.0 26.3 27.2 29.1 18.0 27.4 27.6
500vph
Gap
2 27.9 28.0 28.6 27.6 25.8 29.7 24.1 29.8 28.0 29.8 28.8 30.3 28.0 31.0 29.4
3 29.4 28.0 30.1 29.2 30.2 35.6 31.7 32.7 28.0 31.6 31.7 33.5 28.0 33.9 32.8
4 31.1 28.0 31.6 31.3 38.1 42.1 41.0 37.3 28.0 34.7 36.5 35.5 28.0 36.7 36.8
5 33.0 28.0 33.3 33.3 44.5 50.0 49.8 41.9 28.0 38.4 40.5 40.5 28.0 41.5 41.2
700vph
Gap
2 36.7 39.0 37.5 36.3 49.8 57.3 47.2 38.9 39.0 39.7 38.0 39.5 39.0 41.3 39.5
3 37.5 39.0 38.7 38.3 59.2 70.9 64.9 44.2 39.0 41.2 42.3 45.1 39.0 44.9 43.2
4 39.4 39.0 40.6 40.4 79.2 87.0 87.2 49.9 39.0 45.5 47.5 48.7 39.0 52.3 47.9
5 42.5 39.0 43.0 43.0 92.7 107.6 111.0 56.9 39.0 51.7 52.4 53.6 39.0 65.6 51.7
Error 9.2 0.6 0.2 52.7 41.0 75.6 6.4 3.1 69.9 14.1 2.0
*Models:
C: CORSIM stochastic simulation model
1: Original TRANSYT-7F target degree of saturation model
2: Model with 5 of 6 candidate improvements, plus Akcelik's green extension model
3: Model with all 6 proposed improvements, including the flow profile-based green extension model
-a- -b- -c- -d-
Semi-Actuated Fully-Actuated Semi-Act Multilane Semi-Act Competing Link
TABLE 2 Experiment 1 Results
7. tion strategy. This result was fully expected, because the target
degree of saturation strategy does not currently recognize numerous
factors that affect actuated phase times.
Second, results indicate that Model 3, which contains all six rec-
ommended modeling improvements from this paper, achieves mod-
erately better correlation than does Model 2, which contains five of
six recommended improvements plus Akcelik’s green extension
time formula. This result was unexpected, because Model 2 was
designed to handle isolated intersections.
Third, correlation becomes poor for fully actuated signals with
high volumes. This is not as troublesome as it appears. Fully actuated
cycle lengths are naturally unstable under high volumes and high gap
settings. Not only is this a difficult situation to model with precision,
but also cycle lengths in the field would be likely to fluctuate wildly,
based on the exact pattern of vehicle arrivals.
Finally, results for Model 1 are not listed within Experiment 1b for
fully actuated control. This is because the model requires a fixed cycle
length to compute the target degree of saturation. Ability to examine
fully actuated controllers (having no fixed cycle length) is another
advantage of the queue service time–green extension time strategy.
Experiments 2 and 3: Arterial Street Evaluation
Table 3 values indicate the results of Experiments 2 and 3 as well as
combined results from all three experiments. Values indicate the
coefficient of determination (R2), where values closest to 1.0 indi-
cate the best correlation. Correlation of Model 3 with CORSIM,
based on all three experiments, is also presented in Figure 3.
Similar to the results from Experiment 1, Table 3 results indicate
that Model 2 and Model 3 demonstrate much better correlation with
CORSIM than does Model 1. Although Model 3 consistently has
slightly better correlation than Model 2, the biggest difference is
observed on internal movements in Experiment 2. This is expected
because Model 3 is designed to reflect progression effects and the
flow profile. Overall correlation is mediocre on internal movements,
possibly because of insufficient variety of the internal movement
phase times (10 to 15 s) and internal movement lengths (1,000 ft).
Overall correlation is also mediocre in the first part of Experi-
ment 3, possibly because of differences in the permitted left-turn
movement models of TRANSYT-7F and CORSIM. Correlation
improves in the second part of Experiment 3 when the CORSIM-
permitted left-turn model is calibrated to become consistent with
TRANSYT-7F; that is, zero left-turn jumpers per cycle and two left-
turn sneakers per cycle. Experiment 3 provides evidence that, even
though traffic served during the permitted phase affects the actuated
phase times, Model 2 and Model 3 are able to reflect this with their
queue service times, but Model 1 is not able to reflect this. The same
could be said about queue blockage effects, which are elegantly
handled by the proposed model because of its queue profile analysis.
90 Paper No. 02-2388 Transportation Research Record 1811
Experiment 4: Arterial Street Optimization
In this experiment, optimization of offsets is performed within
TRANSYT-7F after actuated phase times are determined. After opti-
mization, the recommended offsets are coded into the corresponding
CORSIM data file. In both CORSIM and TRANSYT-7F, offsets for
this experiment are referenced to the “yield points,” or the ending
points of the coordinated, major street through-movement phases.
Theoretically, if the actuated phase times are realistic, this should
improve the optimization process and achieve better results within
CORSIM. If the model-predicted actuated phase times are unrealis-
tically low, the amount of green time available to the major street
would be unrealistically high. The optimization process may rec-
ommend offsets to achieve a wide progression band that has little
chance of materializing in the field. It also follows that measures of
effectiveness reported by the optimization model are likely to be
overly optimistic if the amount of green time available to the major
street is unrealistically high.
Table 4 indicates that offsets resulting from Model 3 are indeed
more effective, according to CORSIM, than those resulting from
Model 1. Correct calculation of actuated phase times is not an opti-
mization technique per se but facilitates optimization by providing the
optimization model (and the analyst) with more realistic information.
CONCLUSIONS AND RECOMMENDATIONS
The existing models are constrained by specific shortcomings. The
proposed model uses the queue service time–green extension time
framework from the literature but incorporates six candidate improve-
Experiments
#1, #2, and #3
Model Internal External Original Calibrated Overall
M3 0.8205 0.9671 0.9190 0.9362 0.9828
M2 0.7593 0.9623 0.9044 0.9292 0.9755
M1 0.6418 0.8099 0.6538 0.6473 0.8187
Experiment #2 Experiment #3
Coefficient of Determination (R
2
) Values
R2
= 0.9828
0
10
20
30
40
0 10 20 30 40
Model 3 Phase Time
CORSIMPhaseTime(sec)
TABLE 3 Experiments 2 and 3 Results
FIGURE 3 Traffic-actuated phase time comparison:
CORSIM versus Model 3 (115 observations; combined
results from Experiments 1, 2, and 3).
8. ments that allow for better prediction of traffic-actuated phase times
by deterministic traffic analysis models. For a model that estimates
actuated phase times to be realistic, it must reflect the flow profile,
queue profile, and stochastic effects of multiple lanes and competing
movements. The model used to predict individual phase times must
be applied to all actuated movements to confirm which one produces
the critical actuated phase time. After computation of the individual
phase times, reallocation of unused green time must be done in a
dynamic manner reflecting the true operation of the controller.
Some of these improvements are applicable to coordinated sig-
nals only, but other improvements are applicable to isolated signals
as well. Although tested only on single intersections and arterial
streets, the proposed model is naturally extensible to a network of
signals. Improved actuated phase time prediction is expected to
improve the effectiveness of evaluation-only models such as the
Highway Capacity Manual signalized intersection procedures and
optimization models such as TRANSYT-7F.
Additional research on the overall signal timing design process is
recommended. These findings imply a somewhat inefficient two-
step process in which actuated phase times are first optimized with
the target degree of saturation model and then validated with the
proposed model. Additional research should confirm that the two-
step process facilitates improved signal timing. It would also be
helpful to research the possibility of a more efficient one-step
model, combining the strengths of the target degree of saturation
model and the proposed model from this paper.
Hale and Courage Paper No. 02-2388 91
Further examination of stochastic effects is also recommended for
future research. The queue calibration factor ( fq) formula does not
explicitly consider competing movement volumes, so this formula
could be further developed. Other possible areas of related research
include the effect of detector setback, phase skipping, multicycle
simulation, and offset optimization on actuated phase times.
REFERENCES
1. Lomax, T., and D. Schrank. Traffic Jams: Not Just Big-City Problem.
Texas Transportation Researcher, Vol. 34, No. 3, 1998, pp. 1, 6–7.
2. Deakin, E. A., A. D. May, and A. Skabardonis. Energy Savings from
Signal Timing Optimization: Evaluation of California’s Statewide Pro-
gram. Compendium of Technical Papers, Institute of Transportation
Engineers, San Francisco, Calif., 1984.
3. Wallace, C. E., K. G. Courage, and D. P. Reaves. National Signal
Timing Optimization Project: Final Evaluation Report. FHWA, U.S.
Department of Transportation, 1981.
4. Robertson, D. I. TRANSYT: Traffic Network Study Tool. Fourth Interna-
tional Symposium on the Theory of Traffic Flow, Karlsruhe, Germany,
1968.
5. Wallace, C. E., K. G. Courage, M. A. Hadi, and A. C. Gan. TRANSYT-7F
User’s Guide, Vol. 4. FHWA, U.S. Department of Transportation,
March 1998.
6. Skabardonis, A., and A. Weinstein. TRANSYT-7FC, TRANSYT Model
for Actuated Signals. Institute for Transportation Studies, University of
California, Berkeley, April 1988.
7. Special Report 209: Highway Capacity Manual. TRB, National
Research Council, Washington, D.C., 2000.
8. Courage, K. G. Signal Operations Analysis Package Version 84
User’s Manual. Transportation Research Center, University of Florida,
Gainesville, 1985.
9. Akcelik, R., and M. Besley. SIDRA 5 User Guide. ARRB Transport
Research, Vermont South, Victoria, Australia, Jan. 1999.
10. Courage, K. G., D. B. Fambro, R. Akcelik, P.-S. Lin, M. Anwar, and
F. Viloria. NCHRP Web Document 10: Capacity Analysis of Traffic-
Actuated Intersections. NCHRP Project 3-48. TRB, National Research
Council, Washington, D.C., 1996.
11. Akcelik, R. Estimation of Green Times and Cycle Time for Vehicle-
Actuated Signals. Presented at 73rd Annual Meeting of the Transporta-
tion Research Board, Washington, D.C., 1994.
12. Montgomery, D. C., and G. C. Runger. Applied Statistics and Proba-
bility for Engineers, 2nd ed. John Wiley and Sons, New York, 1999.
13. CORSIM User’s Manual Version 1.04. ITT Systems and Sciences
Corporation, Colorado Springs, Colo., March 1998.
14. Henry, M. A. The Generation of an Arterial Benchmark Data Set and
Its Application to the Effect of Phase Sequence on Arterial Progression.
M.S. thesis. University of Florida, Gainesville, 1999.
Publication of this paper sponsored by Committee on Traffic Signal Systems.
Offset design generated by:
Old New Old New
Node T7F T7F T7F T7F
6 0 0 Control Delay 25.6 23.0
7 15 40 Total Delay 29.7 26.9
8 29 57 Stop Delay 22.0 19.6
9 41 63 Vehicle Trips 8116 8167
10 53 65
11 27 50
12 27 81
13 57 25
14 18 86
15 64 34
CORSIM results based on timing from:
TABLE 4 Optimization Comparison Under Old and
New Methodologies
![The target degree of saturation strategy (5–9) specifies that actu-
ated phases facilitate efficient signal operation when operating at
predictable degrees of saturation, often slightly below capacity. The
primary goal of an actuated phase is to terminate the right-of-way as
soon as the initial queue of vehicles has been served. Ideally, the
degree of saturation would be 100%, and the right-of-way would be
terminated immediately after the queue was served.
In the field, however, drivers in a standing queue are sometimes
not paying attention, and conservative drivers sometimes prefer a
large gap between themselves and their lead vehicle. Because of
this, detectors sometimes sense a gap between vehicles before the
queue has been served, which causes premature phase termination
and excessive delay times. In practice, there should be at least a
2- or 3-s gap requirement to avoid premature phase termination.
Because of this required 2- or 3-s gap, the degree of saturation tends
to be somewhat lower than 100% on actuated phases. Some models
from the literature (6–8) have typically recommended a fixed degree
of saturation such as 85%. Another model (9) has used more detailed
calculations to estimate the degree of saturation on actuated phases.
Queue Service Time–Green
Extension Time Strategy
The queue service time–green extension time strategy (7, 10) speci-
fies that the length of an actuated phase can be estimated by summing
the queue service time (gs), the green extension time (ge), and the inter-
green (yellow plus all-red) time. The queue service time represents
the amount of time necessary to serve the initial standing queue.
Deterministic models are able to apply the queue accumulation poly-
gon concept to estimate queue service times. Figure 1 presents a poly-
gon in the shape of a triangle, implying that the rate of arrivals on red
and departures on green are both uniform. The shape of the polygon
is useful in determining queue service time and other measures. The
shape of the polygon can become complex in response to field condi-
tions causing nonuniform arrivals or departures, allowing queue
service time to be computed accurately under various conditions.
Equations 1 and 2 (7) provide an example of how queue service
time can be computed as an algebraic interpretation of the queue
accumulation polygon.
where
qr, qg = red arrival rate and green arrival rate, respectively [vehicles
(veh)/s];
r = effective red time (s);
s = saturation flow rate (veh/s); and
fq = queue calibration factor.
Although the queue accumulation polygon is a strong indicator of
queue service time, it is not as useful in determining the green exten-
sion time. Figure 1 indicates that the green extension time takes
place beyond the polygon boundaries. The green extension time rep-
resents the amount of time necessary for a detector to locate the nec-
essary gap (typically 2 or 3 s) in the traffic stream after the queue
service time. Equations 3, 4, and 5, developed by Akcelik (11), indi-
fq = −
1 08 0 1 2
2
. . ( )
actual green
maximum green
g f
q r
s q
s q
r
g
=
−( )
( )1
Hale and Courage Paper No. 02-2388 85
cate how green extension time can be computed as a function of
several actuated control parameters.
where
e0 = unit extension time setting,
t0 = time during which the detector is occupied by a passing
vehicle,
q = total arrival flow (veh/s) for all lane groups that actuate the
phase under consideration,
Lv = vehicle length, assumed to be 5.5 m,
Ld = detector length (m),
v = vehicle approach speed (km/h),
∆ = minimum arrival (intrabunch) headway (s),
ϕ = proportion of free (unbunched) vehicles, and
λ = a parameter calculated as follows:
Once the queue service times and green extension times have been
calculated, the phase times are calculated by adding on the yellow and
all-red times, which are values known to the analyst and do not require
modeling or calculation. Once the phase times have been calculated,
additional recalculations become necessary, in adherence to numerous
constraints (maximum green, minimum green, background cycle
length) and because actuated phase times are affected by other
actuated phase times within the same signal or network. When a
background cycle length is in effect, the nonactuated, major street
through-movement phase typically receives all the remaining green
time within the cycle after the actuated phase times are computed.
MOTIVATION
The initial objective of this paper is to identify shortcomings of the
existing models. Regarding the target degree of saturation strategy,
recommended phase times are potentially impractical because of
the inherent difficulty in controlling degrees of saturation that are
likely to occur in the field. Although actuated degrees of saturation
are desired to be somewhat lower than 100%, the actual degrees of
λ
ϕ
=
−
q
q1
5
∆
( )
t
L L
v
d v
0 4=
+( )
( )
g
e
q
e
e t
= −
+ −( )λ
ϕ λ
0 0
1
3
∆
( )
Red Green
No.ofvehiclesinthequeue
Time (seconds)
Queue Service Time
Green Ext. Time
FIGURE 1 Sample queue accumulation polygon.](data:image/gif;base64,R0lGODlhAQABAIAAAAAAAP///yH5BAEAAAAALAAAAAABAAEAAAIBRAA7)