PERI–URBAN HOUSING IN OYO STATE: CASE STUDY OF APETE IBADAN
Rural urban migration and urban informal sector in india
1. z
RESEARCH ARTICLE RURAL-URBAN MIGRATION AND URBAN INFORMAL SECTOR IN INDIA:
AN INTER-STATE ANALYSIS
*1Debasis Chakraborty and *2Dr. Pravat Kumar Kuri
1Department of Economics Durgapur Government College
2Department of Economics Burdwan University
ARTICLE INFO ABSTRACT
Migration is a process that gets intensified with the process of economic development. Among the various
migration streams like rural-urban, rural-rural, urban-rural and urban-urban, population mobility from rural to
urban areas is a common and ever-increasing phenomenon in India. Interestingly, this rural-urban migration is
observed to have significant implications to the development of urban informal sector. Less skilled migrated
labour are, in fact, less equipped for the urban formal jobs due to their lack of knowledge and experience and
hence they end up forming ‘urban informal sector’. Thus there is an intense linkage between rural-urban migration
and the expansion of urban informal sector. In fact there exists a two-way causation: migration helps in booming
of urban informal sector, while the development of informal sector attracts further. Using mainly census and
National Sample Survey data sources, this paper attempts to examine the nature and pattern of internal migration
and its determinants across the states of India. Among various factors explaining the extent of internal migration in
India, rural unemployment, rural indebtedness, opportunity cost of migration, rural industrialization, extent of
urban informal sector etc. have been identified as key variables. Attempts have also been made to examine the
inter-relationship between the extent of rural-urban migration and the expansion of urban informal sector in India.
Copyright, IJCR, 2013, Academic Journals. All rights reserved.
INTRODUCTION
Migration is an inevitable process associated with economic
development. Globally this process of population distribution does
have a profound effect on both the areas from which the migrants
come and the areas in which they finally settled. Depending on the
origin and destination place of a migrant the migration is divided in
four major streams namely, rural-rural, rural-urban, urban-rural and
urban-urban migration1. Each of these streams has their own set of
push-pull factors which compel a migrant to take the decision to
move. Here we are concerned with rural-urban migration stream. In
the migration literatures, several socio-economic, cultural and
political factors have been identified to explain the causes and
determinants of migration. One of the major determinants of rural-urban
migration flow is the ‘difference in expected income between
urban and rural’ as has been pointed out by Harris and Todaro (1970).
But studies thereafter have revealed the fact that expected income gap
hypothesis explains only a portion of migration stream. There are
quite a few evidences where migration flow is low enough instead of
the existence of this expected income gap. In these cases quality of
standard of living comes into play to be a major determinant (Harvey,
1968). Studies have shown that people choose to stay at their
respective native places rather than moving to a place away from their
friends and relatives. In these cases family ties play a pivotal role in
explaining the extent of migration rather than expected income gap
(Conway and Brown, 1980; Cherunilam, 1987). Among the other
determinants that are found to have considerable impact on rural-
*Corresponding author: debesischakraborty2@gmail.com,
pravatkumarkuri@rediffmail.com
__________________ ____________ _______ 1. Rural-Rural Migration: Migration stream whose place of origin and
place of destination are both rural. Rural-Urban Migration: Migration stream
whose place of origin is rural but place of destination is urban. Urban-Rural
Migration: Migration stream whose place of origin is urban but place of
destination is rural. Urban-Urban Migration: Migration stream whose place of
origin and place of destination are both urban.
urban population mobility are urbanization (Goldstein and Mayer,
1965; Chakraborty et al. 2011), basic amenities in the destination
towns (Harvey, 1968), ethnic factors (Ahmed, 1992), cost of
migration (Sjaastad, 1962), easy accessibility of job (Fields, 1975),
state of agricultural performance (Shafi, 1998), lesser employment in
rural sector (Rao, 2005, Chakraborty et al. 2008), literacy rate
(Nagraj, 2000), urban poverty, rural poverty (Afsar, 2003), family
decision (Mincer, 1978), etc. Explaining migration as a third
demographic process, Haq (2007) in his well-researched book entitled
“Sociology of Population in India” examined the general trends of
migration and the distribution of different streams of migration in
various states of India along with its social context, causes and
consequences. In present era of urban development informal sector
plays a vital role. There have been various attempts to define informal
sector in a meaningful way. But the most accepted definition of
informal sector is that has been presented by ILO in UNDP Report on
Kenya2. Overtime it has been found that there is a profound
interdependence between rural-urban migration and urban informal
labour market (Shafi, 1998; Mukherjee, 2001, Gope and Bagchi,
2008). The massive influx of rural people into the urban areas has
changed the job structure of the destination places. Rural peoples are
mainly attracted to migrate by economic incentives as well as by
other attractions of an urban life. But in reality very few of the
fortunate migrants are able to manage to secure jobs in urban
industries. Some of the others wait to get a job in the formal sector
and thus form a ‘reserve army of labour’ which in case of India is ‘the
number of open urban unemployment (Chaudhuri and Mukhopadhay,
2010)’. The rest get absorbed only in the urban informal sector. Again
low wage, low security, high labour intensity in the informal jobs has
reduced living standard of the migrants who are involved into those
_______________________________________
2. “a sector to which entry by new enterprises is comparatively easy;
enterprises in this sector rely on indigenous resources and are family owned;
they operate on a small scale, in unregulated and competitive markets and use
labour intensive and adaptive technology; their workers have skills acquired
outside the formal schooling system” (ILO, 1972).
ISSN: 0975-833X
Available online at http://www.journalcra.com
International Journal of Current Research
Vol. 5, Issue, 04, pp.950-956, April, 2013
INTERNATIONAL JOURNAL
OF CURRENT RESEARCH
Article History:
Received 21st January, 2012
Received in revised form
25th February, 2013
Accepted 24th March, 2013
Published online 13th April, 2013
Key words:
Employment,
Rural-Urban Migration,
Informal Sector,
Organised Sector,
Unorganised Sector.
2. 951 International Journal of Current Research, Vol. 5, Issue, 4, pp.950-956, April, 2013
jobs. So, simply there is a shift of poverty from rural to urban. Thus
destitute people, migrating from their rural places end up into a job
market which is vulnerable in many aspects. Under this backdrop,
the present study intervenes into the nature and pattern of internal
migration in India over the period 1961-2001. It also analyses the
trend of informal sector jobs in India. It has also tried to find that very
interdependence between rural-urban migration and urban informal
sector. Finally it has tried to find the major determinants of migration
across the states of India. In fact, internal migration is of two types:
inter-state and intra-state migration3. Highlighting the nature and
pattern of both inter-state as well as intra-state migration this paper
attempts to identify the causes and determinants of inter-state
migration in India. For convenience, the paper is divided into five
sections. In the first section we have represented the data sources used
and the methodology adopted. The second section deals with the
analysis of nature and pattern of internal migration of India. Third
section takes into account the trends and pattern of informal sector in
India. Fourth section deals with the inter-linkage between rural to
urban migration and urban informal sector. The results of the
regression analysis have been discussed in the fifth section specially
to explore the causes and determinants of rural-urban migration. The
conclusion appears in the last section.
Data Sources and Methodology
The empirical investigation of the study is mainly based on secondary
data. Data on migration have been compiled mostly from census
information published by government of India from 1961 to 2001.
The study has also used migration information published by the
National Sample Survey Organization (NSSO). Apart from this,
several official statistics4 published time to time by government of
India, have been consulted. The determinants of rural-urban migration
in India have been classified as: rural determinants (like rural man-land
ratio, opportunity cost of migration, extent of rural
industrialization, rural unemployment rate, and extent of rural
indebtedness), urban determinants (opportunity cost of migration,
urban-rural expected income gap, job availability in the rural informal
sector, job availability in the urban informal sector). Accordingly,
multiple regression models have been used separately to provide
explanation of rural-urban migration. The specific econometric
framework has been drawn to provide – explanation of rural- urban
migration based on rural determinants, explanation of rural-urban
migration based on urban determinants.
Pattern of Internal Migration in India
Historically population mobility is a very common phenomenon in
India. The incidence of internal migration is found to be directly
related to the process of economic development and it seems to have
a causal relation with the degree of integration with the global
economy. Census of India reveals that in 2001 total number of
persons that has internally migrated across the states of India is
almost double of that of 1971. Presently almost 30 per cent of Indian
population is away from their place of birth. In 1991 it was 27.4 per
cent excluding Jammu and Kashmir. Again across the states it has
been seen that relatively less developed states have higher proportion
of rural-urban migration compare to relatively developed states.
In Table-1 we have presented the change of different streams of
migration in total migration of India. Out of total migration streams of
India, in percentage term, rural-rural migration is found to observe a
declining trend over the period covering 1961-2001. But still it
dominates the Indian migration scenario. During the decade 1961-71,
rural-rural migration stream is accounted for 62.66 per cent of the
total internal migration. Interestingly, the extent of rural-urban
migration is ever increasing since 1961-71 both in absolute as well as
in percentage terms. The rural-urban migration is the second most
important stream of population mobility in India after rural-rural type.
______________________________________
3. Inter-state Migration: When people migrate within the territory of a state
and not outside. Intra-state Migration: When people migrate outside the
boundary of the state, alternatively, when migration occurs between two or
more states.
Among the remaining two streams, urban-rural migration is found to
occupy the lowest position with 6.58 per cent of total migration
streams during 1991-2001, while urban-urban migration explains
15.16 per cent of total migration streams in India. Now to intervene
into the share of each stream within the states of India we have
tabulated the census data on percentage of different streams of
lifetime intra-state migration for the census year 2001 in Table- 2. It
is clear from Table-2 that after so many years of independence, rural-rural
migration stream is still the dominant stream of migration
followed by rural-urban migration. One of the striking features of
internal migration in India is that backward states (e.g Rajasthan,
Orissa, Uttar Pradesh, Bihar) are found to have experienced with
higher degree of rural-rural mobility compared to the relatively
advanced states. This may be due to the reason that these states do not
have sound urban base to accommodate the displaced peoples. As a
result, instead of moving towards the urban centers, people moves
easily to the rural areas of these states where the scenario is much of
their native villages.
Trends and Pattern of Informal Sector in India
In India, “the organized sector could not keep pace with the growing
workforce, and the employment elasticity of output produced in the
organized sector is declining continuously over time from 0.56 in
1972-73 to 0.38 during Ninth Plan” (Mukherjee, 2009). As a result, it
is found that 90 percent of the workforce is presently found to be
engaged with the informal sector. In case of India “……the terms
‘informal sector’ and ‘unorganised sector’ are taken to be
synonymous” (NSS report no. 459: Informal Sector in India, 1999-
2000 – Salient Features). Unorganised sector mainly consists of self-employment
and small business. From Table-3 we can see that in
1999-2000 bulk of the employment has been in this unorganised
sector except ‘Electricity, Gas and Water’ industry. 6 out of 8
industries has unorganized employment more than 60 percent of total
employment. Percentagewise first three industries that are having
share of unorganised sector more than 90 percent are Agriculture,
Hunting, Forestry and Fishing, Trade, Hotels, Restaurants and
Construction industries.
Trend of employment in both organized as well as in the unorganised
has been shown in Table-4. It depicts that in India, over the years,
most of the labourforce has been involved in the employment of
unorganised sector. Among these industries most of the share of
labourforce in unorganised sector has been in Agriculture, Hunting,
Forestry and Fishing industry. Among all other industries
unorganised labour force in Manufacturing, Trade, Hotels,
Restaurants and Transport, Storage and Communication industries
has increased continuously. Table-5 shows the industry-wise
Compound Annual Growth Rate (CAGR) in India from 1983 to 1999-
00. It can be seen that prior to liberalization most of the employment
has grown in the ‘Electricity, Gas and Water’ industry. But over time
it has declined to become negative in 1999-2000 period. In the post
liberalization period, 1993-94, the growth has been scattered,
involving all the industries. In 1999-2000 period almost 3 industries
namely, Mining and Querrying, Electricity, Gas and Water and
Services have a negative growth rate. During this phase, it is
Construction, Trade, Hotels, Restaurants, Transport, and Storage and
Communication industries that are growing at a faster rate than the
other industries. In the (Table-6) we have shown the
______________________________________
4. Manpower Profile India Yearbook 2004; Employment and Unemployment
Situation in India, 1999-2000, NSS 55th Round, Report No. 458 (55/10/2);
1993-94, NSS 50th Round, Report No. 409; Wages Annual Report 2005–2006
published by Labour Bureau, Government of India; National Human
Development Report 2001; Provisional Population Totals, Census of India,
1961-2001; Informal sector in India 1999-2000, NSS 55th Round, Report No.
459 (55/2.0/2); Household Indebtedness in India, All India Debt and
Investment Survey, NSS 59th Round, Report No. 501, (59/18.2/2);
Compendium of Environment Statistics, India, 2003; Statistical Abstract
(India-2004).
3. 952 International Journal of Current Research, Vol. 5, Issue, 4, pp.950-956, April, 2013
Table 1. Percentage Change of Different Types of Migration in India
Stream
1961-1971 1971-1981 1981-1991 1991-2001
No.* % No. % No. % No. %
Rural to Rural 42.49 62.66 46.26 57.23 46.25 57.33 53.3 56.52
Rural to Urban 10.98 15.19 15.73 19.46 16.77 20.78 20.5 21.74
Urban to Rural 5.33 7.86 6.45 7.98 6.08 7.54 6.2 6.58
Urban to Urban 9.01 13.29 12.39 15.33 11.58 14.35 14.3 15.16
Total 67.81 100 70.83 100 80.68 100 94.3 100
Source: Migration Tables, Government of India. *in million
Table 2. Lifetime Intra-state Migration in India (Percentage)
States
1991 2001
R-R U-R R-U U-U R-R U-R R-U U-U
Andhra Pradesh 79.74 6.53 1.78 11.95 66.08 6.19 16.53 11.2
Assam 89.42 1.92 0.58 8.08 46.48 1.58 46.48 5.46
Bihar 86.83 2.87 0.44 9.86 87.29 1.95 7.9 2.86
Gujarat 65.51 7.15 1.70 25.64 58.23 4.4 22.91 14.46
Haryana 77.84 3.58 1.01 17.57 67.91 3.6 18.42 10.07
Karnataka 67.97 4.82 2.19 25.02 61.7 5.84 18.22 14.24
Kerala 69.23 4.16 4.54 22.07 64.44 11.14 17.19 7.23
Madhya Pradesh 77.13 4.39 1.33 17.15 70.71 3.94 15.28 10.07
Maharashtra 61.66 6.00 2.23 30.11 55.07 6.34 21.72 16.87
Orissa 86.55 3.16 0.72 9.57 78.13 2.83 13.88 5.16
Punjab 70.92 4.50 1.67 22.91 43.14 2.84 43.14 10.88
Rajasthan 76.71 3.36 1.26 18.67 76.64 3.96 12.1 7.3
Tamil Nadu 86.80 6.12 3.16 3.92 42.01 8.39 23.2 26.4
Uttar Pradesh 79.81 2.31 0.70 17.18 78.96 2.94 10.7 7.4
West Bengal 73.98 2.67 0.93 22.42 70.28 4.77 12.72 12.23
India 74.38 3.92 1.41 20.29 68.69 4.73 15.53 11.05
Source: Migration Tables, 1991, 2001, Government of India.
Table 3. Employment in Organised and Unorganised Sectors in India (1999-2000)
Industry Total
No.* %
O U O U
Agriculture, Hunting, Forestry and Fishing 190.4 1.39 189.01 0.73 99.27
Mining and Querrying 2.26 1.02 1.24 45.1 54.87
Manufacturing 40.79 6.75 34.04 16.6 83.45
Electricity, Gas and Water 1.15 1 0.15 87 13.04
Construction 14.95 1.18 13.77 7.89 92.11
Trade, Hotels, Restaurants 37.54 0.48 37.06 1.28 98.72
Transport, Storage and Communication 13.65 3.15 10.5 23.1 76.92
Services 35.46 13.1 22.32 37.1 62.94
Source: Gope and Bagchi (2008). O= Organised, U=Unorganised, * in million
Table 4. Trend Employment in Organised and Unorganised Sectors in India
Industry
1983 (million) 1987-88(million) 1993-94(million) 1999-00(million)
O* U** All O U All O U All O U All
Agriculture, Hunting, Forestry and Fishing 1.3 203.8 205.1 1.4 209.9 211.3 1.4 238.3 239.7 1.4 238.6 240
Mining and Querrying 1 0.8 1.8 1 1.3 2.3 1.1 1.6 2.7 1 1.3 2.3
Manufacturing 6.3 25.7 32 6.3 29.9 36.2 6.4 33.4 39.8 6.5 37.2 43.7
Electricity, Gas and Water 0.8 0.1 0.8 0.8 0.3 1.2 1 0.4 1.4 1 0.3 1.3
Construction 1.2 5.5 6.7 1.2 11 12.2 1.2 11 12.2 1.1 16.4 17.5
Trade, Hotels, Restaurants 0.4 18.5 18.9 0.4 22.8 23.2 0.5 28 28.5 0.5 40.1 40.6
Transport, Storage and Communication 2.9 4.5 7.4 3 5.7 8.7 3.1 7.4 10.6 3.1 11.4 14.5
Services 10 15.1 25.2 11 19.2 30.4 13 27.2 39.9 13 24.7 37.8
Total 24.1 274 297.9 25 300.1 325.5 27.3 347.3 374.8 28 370 397.7
Source: Gope and Bagchi (2008). *O= Organised, **U=Unorganised
Table 5. Compound Annual Growth Rate of Employment in Unorganised Sector in India
Industry 1983 to 1987-88 1987-88 to 1993-94 1993-94 to 1999-00
Agriculture, Hunting, Forestry and Fishing 0.59 2.14 0.02
Mining and Querrying 10.2 3.52 -3.4
Manufacturing 3.07 1.86 1.81
Electricity, Gas and Water 24.57 4.91 -4.68
Construction 14.87 0 6.88
Trade, Hotels, Restaurants 4.27 3.48 6.17
Transport, Storage and Communication 4.84 4.45 7.47
Services 4.92 5.98 -1.59
Total 1.84 2.46 1.06
Source: Calculated from Table-4.
4. 953 International Journal of Current Research, Vol. 5, Issue, 4, pp.950-956, April, 2013
Table 6. Employment Status in Urban Informal Sector
trend of employment in urban informal sector in india. Here informal
sector employment has been taken as a combination of number of
self-employed and casual labour per thousand distribution of persons
by broad current weekly activity status. It shows that all the states,
except Maharashtra, has largest share of urban employment in
informal sector. Overall India has a stable rate of urban informal
sector employment (around 60 percent) from 2000-2001 to 2005-
2006.
Linkage between Rural to Urban Migration and Urban Informal
Sector
The flow of rural-urban migration is observed to have a linkage with
the expansion of urban informal sector. Various aspects of this
linkage have been discussed in detail in this section. Table-7 shows
that the all India rural to urban migration has increased over the years
along with the employment in informal sector. The bulk of the
employment has been in the informal sector. Here we can see that
with the increasing trend of rural to urban migration in some of the
economically backward states, the employment in informal sector
also has increased. This reaffirms the statement that there is a broad
association between rural to urban migration and growth of urban
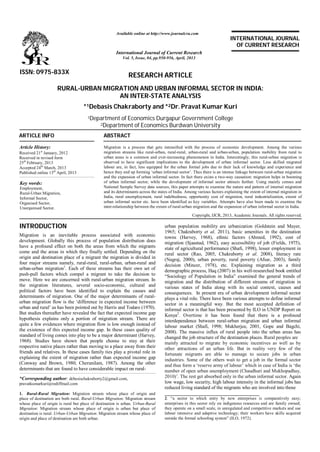
informal sector jobs. The following figure clearly establishes the
positive association between the rural-urban migration and the
expansion of informal sector. Figure-1 shows that the decadal
increment in rural-urban migration and the expansion of urban
informal sector provides an interesting picture in 1991 and 2001. The
relationship between rural-urban migration and the development of
urban informal sector is depicted in the following scattered diagram
(Fig.- 2 and 3).
Source: Census and NSSO Reports.
Fig 1. Decadal Increment (Percentage) of Rural-Urban Migration and
Employment in Informal Sector
Here total urban in-migration constitutes of rural-urban migration and
urban-urban migration. Here each figure has been classified into four
zones. These zones are such that first zone constitutes of those states
which have experienced with higher inter-state urban in-migration but
lower incidence of urban informal jobs. The second zone constitutes
of those states which have experienced with higher inter-state urban
in-migration and higher incidence of urban informal jobs. The third
zone is such that states which belong to this zone have experienced
with lower inter-state urban in-migration and lower incidence of
urban informal jobs. The fourth zone constitutes of those states which
have experienced with lower inter-state urban in-migration but higher
incidence of urban informal jobs. The result shows that in 1991,
seven out of fifteen states are found to occupy the place in third zone.
States
Percentage
1999-2000 2000-01 2002 2003 2004 2004-05 2005-06
Andhra Pradesh 56.5 59.49 59.25 62.43 57.71 63.35 59.78
Assam 50.46 61.65 53.89 68.71 59.88 54.15 62.54
Bihar 59.78 76.26 75.49 70.7 74.32 76.59 78.93
Gujarat 59.41 60.19 59.38 54.55 60.54 54.46 60.83
Haryana 55.85 57.53 61.51 60.07 57.28 57.02 57.46
Karnataka 52.6 69.81 64.4 58.45 63.43 60.85 56.83
Kerala 64.95 68.88 72.47 67.21 63.64 69.91 67.24
Madhya Pradesh 57.52 64.88 65.73 60.33 67.81 63.8 58.73
Maharashtra 42.27 47.93 50.42 46.18 49.03 53.09 48.1
Orissa 55.81 57.1 59.55 62.92 59.87 62.88 60.12
Punjab 54.57 56.67 58.33 54.39 54.57 55.33 56.94
Rajasthan 56.02 63.39 71.72 66.56 63.69 66.47 62.14
Tamil Nadu 45.43 57.62 57.58 51.05 53.44 55.49 51.51
Uttar Pradesh 61.67 67.44 65.47 70.69 71.62 70.17 64.38
West Bengal 53.56 62.57 62.21 67.54 61.73 62.37 60.43
India 53.72 59.33 59.88 58.13 59.12 59.71 57.23
Source: Various NSSO Reports.
Table 7. Rural to Urban Migration and Urban Informal Sector
States
1991 (%) 2001 (%) 1993-94 (%) 1999-2000 (%)
Inter-State Intra-State Inter-State Intra-State Urban Informal Sector Urban Informal Sector
Andhra Pradesh 21.8 6.53 18.91 16.53 54.79 56.5
Assam 27.2 1.92 34.87 46.48 47.62 50.46
Bihar 27.6 2.87 8.74 7.9 56.97 59.78
Gujarat 41.7 7.15 53.05 22.91 50.06 59.41
Haryana 22.97 3.58 28.63 18.42 52.77 55.85
Karnataka 22.2 4.82 25.9 18.22 52.12 52.6
Kerala 12.59 4.16 17.62 17.19 67.33 64.95
Madhya Pradesh 31.6 4.39 28.1 15.28 49.95 57.52
Maharashtra 49.65 6 52.76 21.72 42.16 42.27
Orissa 26.58 3.16 29.81 13.88 43.91 55.81
Punjab 25.13 4.5 37.27 43.14 56.28 54.57
Rajasthan 18.68 3.36 19.16 12.1 53.56 56.02
Tamil Nadu 24.64 6.12 27.07 23.2 54.98 45.43
Uttar Pradesh 17.01 2.31 18.32 10.7 62.1 61.67
West Bengal 50.2 2.67 50.28 12.72 45.51 53.56
India 34.33 3.92 39.33 15.53 51.94 53.72
Source: Census Table of India, 1981, 1991, 2001 and Gope & Bagchi (2008).
5. 954 International Journal of Current Research, Vol. 5, Issue, 4, pp.950-956, April, 2013
This implies that states having lower degree of urban informal jobs
have attracted lower people into their urban areas. This is quite
obvious because urban employment situation has been one of the
driving forces of urban in-migration. Again one of the inherent
characteristics is that these states are economically backward as well.
Thus from this we can draw the conclusion that informal job creation
has a direct role with the economic development of the state. In 2001
there is a shift of paradigm. Here we can see that seven out of fifteen
states are now in second zone where we have high inter-state urban in
migration due to high urban informal job creation. Again, it can be
seen that, these states are relatively economically better off states.
Thus we can conclude that in the post liberalization era due to an
upsurge of urban informal sector, there has been an influx of migrant
peoples into urban areas across the states of India.
100.00
80.00
60.00
40.00
I II
Karnatak
Tamil Na
Fig. 2. Relationship between Inter-state Total Urban In-migration and
Urban Informal Sector (1991)
80.00
60.00
40.00
I II
Gujarat
Punjab
Fig. 3. Relationship between Inter-state Total Urban In-migration and
Urban Informal Sector (2001)
Causes and Determinates of Migration in India
Indian census started collecting data on ‘reasons for migration’ from
1981 census based on place of last residence. “A person is considered
as migrant by place of last residence, if the place in which he is
enumerated during the census is other than his place of immediate
last residence” (Census of India, 2001). Reasons for migration in
India have been classified in following headings i.e.,
work/employment, business, education, family moved, marriage,
moved after birth, moved with households, natural calamities, and
other. The proportional importance of different factors influencing the
migration decision over the years can be seen from Table-8. Table-8
explains the trend of migration depending on various reson of
migration in India. The reasons of migration under first two
categories can be grouped under economic reasons. From the census
we can say that, over the period of 1991-2001 migration induced by
work/employment has increased significantly, while, migration
relating to education and other declined marginally. Migration
induced by marriage or social bondage is found to be dominant in
Indian migration pattern. In 2001, 43.9 per cent of total migration is
induced by marriage. It is to be noted in this context that among
marriage induced migration, the percentage of female migration is
much higher (64.9 per cent) than the male counterpart (2.1 per cent).
‘Moved with households’ occupies the second place as a reason for
migration having almost 21 per cent contribution to total internal
migration. It is evident from the table that except marriage and
movement with households, people mostly have migrated due to
economic reasons. Economic reasons explain almost 16 per cent of
total internal migration. Interestingly, male migrants are found to
have migrated mainly for availing new opportunities of
work/employment in their place of destinations. Migration for better
economic opportunities is found to be much more frequent among the
male than the female. During 1991-2001, under the category of
work/employment, male migrants have increased from 30.4 per cent
to 37.6 per cent; where as female migrants have increased from
merely 3 per cent to 3.2 per cent. But percentage of people revealing
‘business’ as the reason for migration has decreased considerably
irrespective of gender.
Determinants of Migration ─ A Regression Analysis
An attempt has been made to identify the determinants of rural-urban
migration using regression results. The determinants of rural-urban
migration have been analyzed empirically under three perspectives:
determinants based on rural socio-economic variables, urban socio-economic
variables and determinants based on both rural and urban
sectors’ socio-economic variables taken together. The identification
of variables, regression specifications and the hypotheses relating to
the determinants of internal migration is shown in Table – 9. The
results of regression analysis have been presented in Table – 10. The
table reveals that in the case of rural sector all the variables have
come up with the expected sign. A positive relationship between
migration rate and rural man-land ratio (X1) implies that as per capita
land holding (which is reciprocal of X1) increases migration from
rural to urban declines. It is because each person now has more share
of productive land so that their intensity to migration declines. The
result shows that there is an inverse relationship between opportunity
cost of migration5 (X2) and migration rate . This implies that as the
former increases the later decreases and vice-versa. Similarly, extent
of rural industrialization (X3) is found to exert a negative impact on
the rural-urban migration. With obvious reason, rural unemployment
rate (X4) is found to be positively related with the intensity of rural-urban
migration. Rural unemployed will certainly intend to migrate to
the urban areas rather than remain idle in their native rural place
having no work and thus having no earning. This movement becomes
more intensive for them who do not posses any bequest property from
their ancestors. But it is evident from the result that the magnitude of
the effect is very small. Similar is the case for extent of rural
indebtedness (X5). Rural indebtedness is the outcome of greater
dependence on informal sources of rural credit. The informal lenders
charge excessively high interest and that result into heavy debt burden
for the rural poor. This compels them to migrate to the urban areas.
Unlike Harris-Todaro model the expected urban-rural income gap
(X6) have failed to explain the rural-urban migration in India. On the
other hand the job availability in urban informal sector (X8) is found
40.00 45.00 50.00 55.00 60.00 65.00 70.00
URBAN INFORMAL SECTOR
20.00
INTER-STATE TOTAL URBAN INMIGRATION
Andhra P
Assam
Bihar
Gujarat
Haryana
Kerala
Madhya P
Maharash
Orissa
Punjab
Rajastha
Uttar Pr
West Ben
III IV
40.00 45.00 50.00 55.00 60.00 65.00
URBAN INFORMAL SECTOR
20.00
INTER-STATE TOTAL URBAN INMIGRATION
Andhra P
Assam
Bihar
Haryana
Karnatak
Kerala
Madhya P
Maharash
Orissa
Rajastha
Tamil Na
Uttar Pr
West Ben
III IV
6. 955 International Journal of Current Research, Vol. 5, Issue, 4, pp.950-956, April, 2013
Table 8. Reasons for Migration and Their Trend of Share, 1991 – 2001
to exert a positive impact on the rural-urban migration stream. The
expansion of urban informal sector acts as a pull factor for rural-urban
migration, the greater the scope for job in urban informal
sector, higher the extent of rural-urban migration. On the other hand,
the expansion of rural informal sector (X7) is seemed to have an
insignificant impact on the rural-urban migration.
Conclusion
The extent of rural-urban migration has increased significantly in
India during the period of economic liberalization. On economic
front, better employment opportunities in the urban centers attracted a
sizeable proportion of workers from the rural to the urban areas and
5. “There are no data to my knowledge on the expenses incurred by migrants
in the course of moving” (Sajaastad, 1962). So data on cost of migration is
very tough to collect. Here cost of migration has been approximated as that
amount of money income that a migrating person has to forgo due to his
migration from rural to urban. Here this money income has been taken as the
prevailing rural minimum wage rate.
thus induced rural-urban migration. The extent of net migration of
the developed states is found to be much higher than that of the
backward states. As regards the intra-state migration, backward states
have experienced with higher population mobility both in terms of
rural-rural as well as rural-urban migration streams. In terms of the
socio-economic determinants of internal migration in India, some of
them are found to act as push factors, while others act as the pull
factors. The sub-division and fragmentation of the rural agricultural
land induces the process of rural-urban migration in India. The higher
the extent of sub-division and fragmentation of agricultural land (i.e.
lower man-land ratio) lower will be the agricultural productivity and
thus higher will be the extent of rural-urban migration. Rural
industrialization is found to play a significant role to determine the
extent of rural-urban migration in India. Higher the degree of rural
industrialization, higher will be employment opportunities in rural
areas and thus lower will be the extent of rural-urban migration. On
the other hand, rural unemployment acts as a push factor in the
Reasons for Migration
Persons Male Female
Total % Total % Total %
1991 2001 1991 2001 1991 2001 1991 2001 1991 2001 1991 2001
Work/Employment 9.94 14.4 12.1 14.7 8.29 12.3 30.4 37.6 1.65 2.06 3 3.2
Business 2.25 1.13 2.7 1.2 1.81 0.95 6.6 2.9 0.44 0.18 0.8 0.3
Education 3.45 2.9 4.2 3 2.44 2.03 9 6.2 1.01 0.87 1.8 1.3
Family moved 18.5 - 22.5 - 8.27 - 30.4 - 10.2 - 18.6 -
Marriage 36.9 42.9 44.9 43.9 0.78 0.67 2.6 2.1 36.1 42.3 65.9 64.9
Moved after birth - 6.57 - 6.7 - 3.42 - 10.5 - 3.14 - 4.8
Moved with households - 20.5 - 20.9 - 8.21 - 25.1 - 12.3 - 18.8
Natural calamities 0.42 - 0.5 - 0.25 - 0.9 - 0.18 - 0.3 -
Other 10.7 9.45 13.1 9.7 5.48 5.13 20.1 15.7 5.26 4.33 9.6 6.6
Source: Migration Tables 1991, 2001, Government of India.
Table 9. Migration Determinants
Dependent Variable: Percentage migration from rural to urban (Mru)
Sectors Independent Variables Exp. Sign.
Rural Sector Pr / Lar = X1 = Rural man-land ratio, where land signifies the agricultural land presented in sq.km. (+)
Cm = X2 = Opportunity cost of migration. (–)
Eri = X3 = No. of rural enterprises both Own Account Enterprises (OAEs) and Establishments. (–)
Ur = X4 = Rural unemployment rate. (+)
Cr = X5 = Extent of rural indebtedness. (+)
Urban Sector Cm= X2 = Opportunity cost of migration. (–)
Cr= X5 = Extent of rural indebtedness. (+)
Ny=X6 = Urban-rural expected income gap. (+)
JS=X7 = Job availability in the rural informal sector. (–)
Ui = X8 = Job availability in urban informal sector (+)
Table 10. Determinants of Migration: OLS Regression
Independent Variables Rural Sector Urban Sector
Intercept 70.527* 43.135
(-6.016) (-1.367)
X1 2329772.399 -
(-1.377)
X2 -0.391** -0.216
(-2.426) (-1.413)
X3 – 0.001 -
(-0.384)
X4 0.015 -
(-0.124)
X5 0.997 1.244**
(-1.38) (-2.183)
X6 - – 0.020
(-0.215)
X7 - 0.034
(-0.071)
X8 - 0.913**
(-2.384)
R2 0.489 0.316
Adj. R2 0.205 0.129
F – Statistics 1.722 1.693
Note: The statistics significant at 1%, 5% and 10% levels are indicated by *, **, *** respectively. In the parenthesis we have t-statistics.
7. 956 International Journal of Current Research, Vol. 5, Issue, 4, pp.950-956, April, 2013
process of rural-urban migration. In many cases, it has been found
that because of the non-availability of job in the rural sector, people
are compelled to migrate from rural to urban sector. Among the other
determinants of rural-urban migration, rural indebtedness is found to
play an important role as push factor. The higher the extent of rural
indebtedness the greater is the degree of rural-urban migration. The
extent of rural-urban migration is directly associated with the
spreading of urban informal sector. The greater scopes for informal
activities at the urban centers induce people to migrate from rural to
urban areas. In fact, urban informal sector acts as a major pull factor
for rural-urban migration in India. However it is to be noted that the
growing extent of migration, in many cases, is found to be
inconsistent with the infrastructure availability in the urban centers to
accommodate the migrated people. This leads to a crisis of urban
amenities and thus results in the degradation of urban environment.
To reduce this mismatch, the process of economic development needs
to be integrated strictly with the urban planning for attaining a
sustainable urban future.
REFERENCES
Afsar, Rita (2003): “Internal migration and the Development Nexus;
The Case of Bangladesh”. This paper is one of twelve prepared
and presented at the “Regional Conference on Migration,
Development and Pro-poor Policy Choices in Asia”. The
Conference was jointly organized by the Refugee and
Migratory Movements Research Unit, Bangladesh, and the
Department for International Development, UK, and took place
on 22-24 June, Dhaka, Bangladesh.
Ahmed, Nuzhat (1992): “Choice of location and mobility behaviour
of migrant households in a third world city”. Urban Studies;
29(7), pp. 1147-1157.
Census of India: “Series – 1, India, General Population Tables, Part
– II – A (i), Provisional Population Totals, Paper – 2, Rural-
Urban Distribution”, 1991, 2001.
Census of India: “Migration in India”. 1961 - 2001. D – Series.
Chakraborty, Debasis and Dr. Pravat Kumar Kuri (2008): “Internal
Migration in India: Causes and Determinants”. IASSI
Querterly, Vol. 26, Issue 4, pp. 47-63.
Chakraborty, Debasis and Dr. Pravat Kumar Kuri (2011):
“Urbanization and Migration in India: Nature and
Determinants”. Lambert Academic Publishing, March 2011.
Chaudhuri, Sarbajit and Ujjaini Mukhopadhyay (2010): “Revisiting
the Informal Sector: A General Equiblibrium Approach”.
Springer Publications.
Cherunilam, Francis (1987): “Migration-causes, correlates,
consequences, trends and policies”. Himalaya Publishing
House.
Compendium of Environment Statistics, India; 2003.
Conway, D. and Brown, J. (1980): “Intra urban relocation and
structure; low income migrants in Latin America and the
Caribbean”. Latin American Research Review; 15, pp. 95-125.
Fields, G.S. (1975): “Rural-urban migration, urban unemployment
and underemployment, and job search activity in LDCs”.
Journal of Development Economics, 2, June, pp. 165-187.
Goldstein, Sidney and Mayer, Kurt B. (1965): “Impact of migration
on the socio-economic structure of cities and suburbs”.
Sociology and Social Research; 50(1), October, pp. 5-23.
Gope, Nirupam and K.K. Bagchi (2008): “Socio-Economic Impacts
of Informal Sector Economy”. Abhijeet Publications.
Haq, Ehsanul (2007): “Sociology of Population in India”, New
Delhi: Macmilan India Ltd.
Harris, J.R. and M.P. Todaro (1970): "Migration, Unemployment and
Development: A Two-Sector Analysis" American Economic
Review, 60, pp. 126-142.
Harvey, Milton (1968): “Implications of migrations to free town; a
study of the relationship between migrants, housing and
occupation”. Civilizations; 18(2), pp. 247-269.
ILO (1972): “Employment, incomes and equality: A strategy for
increasing productive employment in Kenya”, (Geneva, 1972).
Labour Bureau, Govt. of India: “Wages; Annual Report, 2005-2006”.
Manpower Profile India Yearbook 2004.
Mincer, Jacob (1978): “Family Migration Decisions” The Journal of
Political Economy, Vol. 86, No. 5, pp. 749-773.
Mukherjee, Dipa (2009): “Informal Sector in Indian Economy: The
Way Ahead”. Rawat Publications.
Mukherjee, Shekhar (2001): “Low quality migration in India the
phenomena of distressed migration and acute urban decay”.
24th IUSSP Conference, Salvador, Brazil, August.
Nagraj, K. (2000): “The socio-economic basis for rural-urban
continuum; A case study of Dakshina Kannada district in
Karnataka”. Sited in Amitabh Kundu ed. “Inequality, Mobility
and Urbanisation”. Manak Publication Pvt. Ltd.
National Human Development Report, 2001.
National Sample Survey Organisation (NSSO): “Employment and
Unemployment Situation in India, 1999-2000, Part – I and Part
– II”. Report No. 458 (55/10/2), 55th Round (July 1999-June
2000).
--------------------: “Migration in India, 1999-2000”. Report No. 470
(55/10/8), 55th Round (July 1999-June 2000).
--------------------: “Informal Sector in India, 1999-2000”. Report No.
459 (55/2.0/2), 55th Round (July 1999-June 2000).
--------------------: “Household Indebtedness in India as on
30.06.2002, All India Debt and Investment Survey”. Report No.
501 (59/18.2/2), 59th Round (January – December 2003).
Rao, Vasudeva D. (2005): “Decadal changes in magnitude and
direction of migration”. Social Action, 55, July-September, pp.
271-286.
Shafi, Sayed S. (1998): “Rural-urban interface; aspects and
prospects”. Nagarlok; 30(2). April-June, pp. 1-25.
Sjaastad, Larry A. (1962): “The cost and returns of human
migration”. The Journal of Political Economy; Vol. 70. 5(2),
pp. 80-93.
Statistical Abstract, India; 2004.
*******