SlideShare une entreprise Scribd logo
1  sur  12
Télécharger pour lire hors ligne
Food Miles: Background
                                               and Marketing
    A Publication of ATTRA - National Sustainable Agriculture Information Service • 1-800-346-9140 • www.attra.ncat.org

By Holly Hill                                  The term ‘food miles’ refers to the distance food travels from the location where it is grown to the
NCAT Research                                  location where it is consumed, or in other words, the distance food travels from farm to plate. Recent
Specialist                                     studies have shown that this distance has been steadily increasing over the last fifty years. Studies
© 2008 NCAT                                    estimate that processed food in the United States travels over 1,300 miles, and fresh produce travels
                                               over 1,500 miles, before being consumed. This publication addresses how food miles are calculated,
                                               investigates how food miles affect producers and consumers, and evaluates methods for curbing the
                                               energy intensiveness of our food transportation system.

Contents
Introduction ..................... 1
Background ...................... 1
The Energy Embedded
In Our Food ...................... 2
Calculating Food
Miles .................................... 3
Food Miles and
Energy ................................ 5
What Producers Should
Know ................................... 6
Consumer
Considerations ................ 8
Food Miles Tools ........... 10
Conclusion ...................... 10
References ...................... 11


                                               Eggs loaded for trucking to market near Chesterfield, SC. Photo by Dave Warren. Courtesy of USDA.


Funding for the development
                                               Introduction                                            transportation, addresses how food miles
of this publication was provided
by the USDA Risk Management                                                                            affect both producers and consumers and
Agency.                                        The food mile is a fairly new concept refer-            suggests possibilities for creating a more
                                               ring to the distance food travels from the              sustainable food system.
                                               location where it is produced to the loca-
ATTRA—National Sustainable
                                               tion where it will eventually be consumed.              Background
Agriculture Information Ser-                   Food miles have become one method for
vice is managed by the National
Center for Appropriate Technol-                evaluating the sustainability of the global             Trends
ogy (NCAT) and is funded under                 food system in terms of energy use. This                The United States food system has changed
a grant from the United States
Department of Agriculture’s                    concept has received an increasing amount               substantially over the last fi fty years due
Rural Business- Cooperative
Service. Visit the NCAT Web site
                                               of attention over the last decade as climate            to a large variety of circumstances includ-
(www.ncat.org/agri.                            change patterns have become ever more                   ing the globalization and centralization of
html) for more informa-
tion on our sustainable
                                               apparent. This publication investigates                 the food industry and the concentration of
agriculture projects.                          the amount of energy invested in food                   the food supply onto fewer, larger suppliers.
A report released in 1998 by the USDA                   system analysts, has its price. The farther
                             found that 80% of the meat industry is con-             food travels and the longer it takes en
                             trolled by only four fi rms.(1) In his essay             route to the consumer, the more freshness
                             entitled “Food Democracy,” Brian Halweil                declines and the more nutrients are lost.
                             states that half of the food items in a typical         Many fruits and vegetables are engineered
                             supermarket are produced by no more than                for a long shelf life, sacrificing taste and
                             10 multinational food and beverage com-                 nutrition for preservation.
                             panies.(2) The majority of food consumed
                             today passes through a complex, indirect                As large multinational companies gain con-
                             network of a few large, centralized produc-             trol over the food industry, small local farm-
                             ers, processors, transporters and distribu-             ers suffer. Since 1979, 300,000 farmers
                             tors before reaching the consumer.                      have gone out of business and those remain-
                                                                                     ing are receiving 13% less for every con-
                             An additional change in the food system is              sumer dollar for farm goods.(1) Large dis-
                             the increasing trend of these multinational             tributors are able to drive prices down on
                             firms sourcing food from outside of regional,
                                                                                     imported goods, forcing many small farms
                             state and even national boundaries in order
                                                                                     to either export their crop as a raw com-
                             to provide consistent products at low prices.
                                                                                     modity or replace regional crops with some-
                             Figure 1 illustrates the steady increase in
                                                                                     thing more profitable. For example, in 1870
                             world agricultural trade between 1961 and
                             2000.(3)                                                100% of the apples consumed in Iowa were
                                                                                     produced in Iowa. By 1999, Iowa farmers
                                                                                     grew only 15% of the apples consumed
Fig. 1: Volume of World Agricultural Trade, 1961-2000. Source: Brian Halweil. Home   in the state.(4) This phenomenon limits
Grown: The Case for Local Food in a Global Market. 2002.                             the potential for local self-sufficiency and
                                                                                     increases dependency on outside sources.
                                                                                     Changes in the food system have resulted in
                                                                                     a broad range of social and economic impli-
                                                                                     cations, but the present food system also
                                                                                     has an environmental cost. The farther food
                                                                                     travels, the more fossil fuels are required
                                                                                     for transport. The burning of fossil fuels
                                                                                     leads to the emission of greenhouse gases,
                                                                                     which contribute to global warming. The fol-
                                                                                     lowing sections will investigate the extent to
                                                                                     which food miles contribute to high energy
                                                                                     consumption levels and CO2 emissions.

                                                                                     The Energy Embedded in
                                                                                     Our Food
                                                                      The Carbon Footprint of the
                             The development of global food transport Food System
                             systems has resulted in higher consumer                 While studies vary, a typical estimate is
                             expectations. Consumers now have the abil-              that the food industry accounts for 10% of
                             ity to choose from a wide variety of food               all fossil fuel use in the United States.(5)
                             items, regardless of the season or their loca-          Of all the energy consumed by the food sys-
                             tion, all at a low price.                               tem, only about 20% goes towards produc-
                             The ability to enjoy consistent produce and             tion; the remaining 80% is associated with
                             exotic ingredients at all times of the year             processing, transport, home refrigeration
                             is a luxury that, according to many food                and preparation.
Page 2         ATTRA                                                                      Food Miles: Background and Marketing
Recent research at the University of Chicago     Fig. 2: Transportation accounts for 14% of energy use within the food system. Source:
has investigated the energy consumption          Heller and Keoleian. Life Cycle-Based Sustainability Indicators for Assessment of the U.S.
of the food system and compared it to the        Food System. 2000.
energy consumption associated with per-
sonal transportation in the United States.
Personal transportation is often recog-
nized as a major contributor to greenhouse
gas emissions, as evident in the movement
towards higher efficiency vehicles. This
study found, however, that the average
American uses between 170 and 680 mil-
lion BTUs of energy in personal transpor-
tation annually and roughly 400 million
BTUs in food consumption.(6) The food
industry accounts for a considerable portion
of energy consumption in the United States
and merits closer evaluation.                    2,000 miles to reach the Chicago market.
                                                 The average distance traveled amounted
According to one study, food transportation
                                                 to 1,518 miles.(9) Figure 3 (next page)
accounts for 14% of energy use within the
                                                 shows the distance that select produce items
food system. Figure 2 demonstrates the
                                                 traveled before reaching their destination at
energy use required for each step of the food
                                                 the Chicago Terminal Market.
industry process.(7) Food miles, although                                                                       Related ATTRA
a fraction of the U.S. energy consumption        Another study conducted in the Waterloo                        Publications
as a whole, remain a considerable source of      Region of Southwestern Ontario investigated
carbon emissions, especially when consider-      the food miles associated with 58 commonly                    Bringing Local Food
ing that the United States is the single larg-   eaten, imported foods. The study found                        to Local Institutions:
est emitter of greenhouse gases in the world,    that each food item traveled an average of                    A Resource Guide for
accounting for 23% of the global total at        4,497 kilometers or 2,811 miles, producing                    Farm-to-School and
nearly 1,600 million metric tons annually.       51,709 tons of greenhouse gas emissions                       Farm-to-Institution
                                                                                                               Programs
The U.S. food system alone uses as much          annually.(10)
energy as France’s total annual energy                                                                         Community-Supported
                                                 These calculated distances don’t include the                  Agriculture
consumption.(8)                                  distance consumers travel to shop for food
                                                 or the distance that waste food travels to be                 Direct Marketing
Calculating Food Miles                           disposed of. It is apparent that food is trav-
                                                                                                               Farmers’ Markets
                                                 eling long distances, but the extent to which
How Far Does Food Travel?                        food miles have an effect on the environ-                     Local Food Directories
The Leopold Center for Sustainable Agri-         ment is more complex. The following sec-
culture has been the leading researcher of       tions will cover the formulas used to calcu-
food miles in the United States and has con-     late food miles and investigate the energy
ducted several studies comparing the dis-        involved in the transportation of food.
tance food travels if it is sourced locally
rather than conventionally. A 1998 study         How Are Food Miles Calculated?
examined the distance that 30 conventional       A series of formulas for calculating food
fresh produce items traveled to reach the        miles has been developed and has become
Chicago Terminal Market.                         widely accepted. Calculating the distance a
The Leopold Center found that only two           food item has traveled varies in complexity
food items, pumpkins and mushrooms,              depending on whether the item is made up
traveled less than 500 miles. Six food items     of a single ingredient or multiple ingredi-
including grapes, lettuce, spinach, broccoli,    ents and the mode of transportation used to
cauliflower and green peas traveled over          carry the item.

www.attra.ncat.org                                                                                             ATTRA             Page 3
Average distance by truck to Chicago Terminal Market*
                                                                                                      # of States     % Total    formula takes into account both distance
                                                                                                      supplying         from
                (Continental U.S. only)                                                                 this item     Mexico     and the associated greenhouse gas emis-
                                                                                                                                 sions for different modes of transportation.
 Grapes                                                                                  2,143 miles            1           7    This formula was developed by the non-
                                                                                                                                 profit organization LifeCycles, in 2004.
 Broccoli                                                                                2,095 miles            3           3
                                                                                                                                 For detailed information about food miles
 Asparagus                                                                     1,671 miles                      5          37    formulas and calculating food miles,
                                                                                                                                 see the Leopold Center’s publication,
 Apples                                                                1,555 miles                              8           0    Calculating food miles for a multiple ingredient
 Sweet                                                                                                                           food product <www.leopold.iastate.edu/
 Corn                                           813 miles                                                       16          7    pubs/staff/files/foodmiles_030305.pdf>
 Squash                                        781 miles                      Each truck represents             12         43
                                                                              about 500 miles of
                                                                              distance traveled
                                                                                                                                 Mode of Transportation
 Pumpkins                   233 miles                                                                           5           0    As suggested by the Weighted Average
 * Information for this chart is based on the weighted aver-
 age source distance, a single distance figure that combines
                                                                 production origin to Chicago were estimated by using a city
                                                                 located in the center of each state as the production origin,
                                                                                                                                 Emissions Ratio formula, the mode by
 information on distances from production source to consump-
 tion or purchase endpoint. For these calculations, USDA Agri-
                                                                 and then calculating a one-way road distance to Chicago using
                                                                 the Internet site Mapquest (mapquest.com). Estimations do
                                                                                                                                 which food is transported is an important
 cultural Marketing Service arrival data for 1998 were used to
 identify production origin (state or country). Distances from
                                                                 not include distance from the Chicago Terminal Market to
                                                                 point of retail sale.
                                                                                                                                 factor when considering the environmental
                                                                                                                                 impact of food miles. A food item travel-
Fig.3: Distance Produce Traveled to Reach Chicago Market.                                                                        ing a short distance may produce more CO2
Source: Leopold Center for Sustainable Agriculture
                                                                                                                                 than an item with high food miles, depend-
                                                                                                                                 ing on how it is transported.
                                             The Weighted Average Source Distance
                                             (WASD) formula was developed by Annika                                              Figure 4 (below) contains the estimated val-
                                             Carlsson-Kanyama in 1997 and takes into                                             ues of energy consumption and greenhouse
                                             account the amount of food transported in                                           gas emissions for four different transportation
                                             weight and the distance that it travels from                                        modes measured in the UK.(11) Air trans-
                                             the place of production to the place of sale.                                       portation is, by far, the most energy intensive
                                             Fruits and vegetables and other items consist-                                      means of transporting food and other goods.
                                             ing of only one ingredient would utilize the
                                                                                                                                 A study released in the UK in 2005 found
                                             WASD formula for calculating food miles.


A
                                                                                                                                 that air transport is the fastest growing
        ir transpor-
                                             The Weighted Total Source Distance                                                  mode of food distribution and although
        tation is,                           (WTSD) formula was developed by the                                                 air transport accounts for only 1% of food
        by far, the                          Leopold Center for Sustainable Agriculture                                          transport in the UK, it results in 11% of
most energy inten-                           and accounts for multiple-ingredient foods                                          the country’s CO2 emissions. The UK report
sive means of trans-                         by calculating the weight and distance                                              also estimated that the social and economic
porting food and                             traveled for each ingredi-
                                             ent. Foods like f lavored
other goods.                                                               Fig.4: Energy use and emissions for different modes of freight transport.
                                             yogurt, bread, and other      Source: Transport for a Sustainable Future: The Case for Europe.(11)
                                             processed foods would
                                             employ the WTSD formula                           Rail          Water          Road          Air
                                                                           Primary energy
                                             for calculating food miles.   consumption              677           423          2,890          15,839
                                                                                                        KJ/Tonne-km
                                             While both WASD and                                        Specific total emissions
                                             WTSD convey an estimate                                    g/Tonne-km
                                             of the distance food trav-                                 Carbon dioxide               41.0        30.0        207        1,260
                                             els between the producer
                                             and consumer, neither for-                                 Hydrocarbons                 0.06        0.04        0.3         2.0

                                             mula addresses greenhouse                                  Volatile Organic
                                                                                                                                     0.08        0.1         1.1         3.0
                                                                                                        Compounds
                                             gas emissions associated
                                             with this distance traveled.                               Nitrogen oxide               0.2         0.4         3.6         5.5

                                             The Weighted Average                                       Carbon monoxide              0.05        0.12        2.4         1.4
                                             Emissions Ratio (WAER)
Page 4                 ATTRA                                                                                                          Food Miles: Background and Marketing
costs of food transport including accidents,                  Food system            Fuel      $ value of fuel   CO2 emissions   Distance
noise and congestion amount to over 9                          and type of
                                                                 truck
                                                                                 Consumption
                                                                                  (gal/year)
                                                                                               (current 2001
                                                                                                  prices*)        (lbs./year)
                                                                                                                                 traveled
                                                                                                                                  (miles)
billion British pounds every year or 18                      Conventional
billion American dollars.(12)                                semitrailer
                                                                                    368,102       $581,601         8,392,727     2,245,423

                                                             Iowa regional
                                                                                    22,005        $35,208           501,714      134,230
                                                             semitrailer
Food Miles and Energy                                        Iowa regional
                                                                                    43,564        $69,702           993,243      370,289
                                                             midsize truck
Is Local Food Less Energy Intensive?                         Iowa local -CSA
Proponents of reducing food miles often                      farmers market
                                                             small truck (gas)
                                                                                    49,359        $78,974           967,436      848,981

suggest that buying local food will reduce                   Iowa local insti-
the amount of energy involved in the trans-                  tutional small         88,265        $141,224         1,729,994     1,518,155
                                                             truck (gas)
portation process, as food sourced locally
travels shorter distances. The Leopold Cen-              Fig.6: Estimated fuel consumption, CO2 emissions and distance traveled for conven-
                                                         tional, Iowa-based regional, and Iowa-based local food systems for produce.
ter for Sustainable Agriculture has con-                 Source: Leopold Center for Sustainable Agriculture.
ducted several studies that compare the dis-
tance traveled by conventional versus local
foods. Figure 5 (below), compiled by the                     from the conventional system used 4 to 17
Leopold Center, compares food miles for                      times more fuel than the locally sourced
local versus conventional produce traveling                  food and emitted 5 to 17 times more CO2.(4)
to Iowa. In all cases, the locally grown food                The Leopold Center used this information
travels a significantly shorter distance than                 to estimate the distance, fuel consumption
the conventionally sourced food.                             and CO2 emissions that could potentially be
                                                             saved by replacing 10% of the Iowa’s current
Another study conducted by the Leopold food system with regional or locally sourced
Center in 2001 investigated the distance food. This information is displayed in
that food traveled to institutional markets Figure 6 (above). It is interesting to note
such as hospitals and restaurants in Iowa that when the transportation method was
using three different food sources: conven- taken into account, the local food system
tional, Iowa-based regional and Iowa-based required more energy and emitted more CO2
local. The study found that food sourced than the regional system. This is because the
                                                                            trucks supplying food locally
Fig. 5: Food miles for local versus conventional produce.                   had a smaller capacity, there-
Source: Leopold Center for Sustainable Agriculture.
                                                                            fore requiring more trips and
 Produce Type              Locally grown     Conventional Source Estimation logging more miles.
                         WASD (miles)   WASD (miles)
 Apples                       61                   1,726                         It has been shown that local
 Beans                        65                   1,313                         food systems do reduce food
 Broccoli                     20                   1,846                         miles, which in turn tend to
 Cabbage                      50                       719                       reduce energy consumption,
 Carrots                      27                   1,838                         but there are exceptions.
 Corn, Sweet                  20                   1,426                         Local transportation systems
 Garlic                       31                   1,811                         may not always be as efficient
 Lettuce                      43                   1,823                         as regional systems, depend-
 Onions                       35                   1,759                         ing on the mode of transport
 Peppers                      44                   1,589                         and load capacity.
 Potatoes                     75                   1,155
 Pumpkins                     41                       311
                                                                                 Does Reducing
 Spinach                      36                   1,815
 Squash                       52                   1,277
                                                                                 Food Miles Reduce
 Strawberries                 56                   1,830                         Energy Use?
 Tomatoes                     60                   1,569                         A Japanese group, Daichi-
 WASD -for all produce        56                   1,494                         o -Mam or u Kai ( T he
 Sum of all WASDs             716                  25,301                        Association to Preserve
www.attra.ncat.org                                                                                                     ATTRA        Page 5
uses less energy than housing and feeding
                                                                                     animals.(14)
                                                                                     The UK Department for Environment, Food
                                                                                     and Rural Affairs (DEFRA) released a
                                                                                     report in 2005, which determined that food
                                                                                     miles alone are not a valid indicator of the
                                                                                     sustainability of the food system. In some
                                                                                     cases, reducing food miles may reduce
                                                                                     energy use, but there may be other social,
                                                                                     environmental or economic trade-offs. The
                                                                                     consequences of food transport are complex
                                                                                     and require a group of indicators to deter-
                                                                                     mine the global impact of food miles.(13)

                                                                                     Life Cycle Assessment
Cranberries loaded on truck for shipment. Photo by Earl J. Otis. Courtesy of USDA.
                                                                                     There is increasing significance in consid-
                                                                                     ering all stages of energy consumption in
                             the Earth) conducted a study that found                 the food system. Many organizations have
                             that a typical Japanese family could                    investigated the idea of life-cycle-based
                             reduce their CO2emissions by 300 kilo-                  analysis to determine the sustainability of
                             grams annually by eating locally.(13) The               the food system.
                             Canadian Waterloo Region study men-
                             tioned above estimated that sourcing                    Life cycle assessment (LCA) is a method
                             the 58 food items in the study locally and              used to analyze the consumption and envi-
                             regionally rather than globally could reduce            ronmental burdens associated with a prod-
                             greenhouse gas emissions by 49,485 tons                 uct. LCA takes into account energy input
                             annually. This is the equivalent of removing            and output involved in all stages of the life
                             16,191 vehicles from the road.(11)                      cycle including production, processing,
                                                                                     packaging, transport and retirement. Life
                             The food miles issue becomes even more                  cycle evaluation accounts for a matrix of
                             complex when considering factors besides                sustainability indicators beyond greenhouse
                             distance traveled and mode of transpor-                 gas emissions, including resource deple-
                             tation. The energy required to grow some                tion, air and water pollution, human health
                             foods in unsuitable climates may override               impacts and waste generation. This method
                             the energy of transporting food from loca-              provides a more holistic approach to assess-
                             tions where the food is more easily grown.              ing the impact our food choices have on the
                             For example, a Swedish study found that                 environment.(7)
                             tomatoes traveling from Spain to Sweden
                             were less energy intensive than tomatoes                Life cycle assessments of various conven-
                             raised in Sweden, because of the process by             tional food products have found that the
                             which they were grown. The Spanish toma-                current food production and consumption
                             toes were raised in the open ground, while              patterns are unsustainable.(15) Adopt-
                             the Scandinavian climate required tomatoes              ing a “life cycle thinking” approach to
                             to be raised in heated greenhouses utilizing            food consumption would be a productive
                             more fossil fuels.(4)                                   method for increasing the sustainability of
                                                                                     the food system.
                             A New Zealand report found that export-
                             ing some foods to the UK consumes less
                             energy than producing the same food in                  What Producers Should Know
                             the UK because the agricultural system in               In general, the idea of reducing food miles
                             New Zealand tends to use less fertilizer and            is good news for producers. Reducing
                             raises year round grass fed livestock, which            energy costs equates to saving money and
Page 6         ATTRA                                                                      Food Miles: Background and Marketing
consumers who are reducing food miles help     how to join or start a farmers’ market suc-
to create local markets. There are many        cessfully, see the ATTRA publication, Farm-
ways of reducing the energy intensiveness      ers’ Markets: Marketing and Business Guide.
of your operation. Reducing fuel consump-
                                               Community supported agriculture (CSA)
tion, maintaining equipment and assess-
                                               offers another option for marketing to a
ing field practices can have great impacts
                                               local or regional clientele. CSAs typically
that will both reduce your energy use and
                                               have members that are “share-holders” in
save you money. The ATTRA Farm Energy
                                               the farm, paying for the anticipated costs
Web pages contain a host of information
                                               of the farm operation. The ATTRA pub-
about managing energy-related costs on
                                               lication Community Supported Agriculture
the farm. You will find links to farm energy
                                               contains information about production con-
calculators, renewable energy informa-
                                               siderations and using the Internet as a means
tion and links to food miles resources.
                                               of information dissemination to members.
For more information visit the Web site at
www.attra.ncat.org/energy.                     The number of farmers’ markets and CSAs
                                               has grown substantially over the last decade
                                               indicating both the potential of success for


                                                                                                L
Marketing
                                               the farmer and the growing demands of                    ife cycle
For producers, reducing food miles means
                                               consumers for fresh, local food.                         assessment
selling products to a more local or regional
market. While, this may be an intimidating                                                              (LCA) is a
prospect for farmers who have no experience
                                               Farm-to-Institution Programs
                                                                                                method used to ana-
with alternative markets, the opportunities    Selling food directly to schools, hospitals,     lyze the consumption
are significant and diverse, including farm-    prisons and other institutions is becoming
                                                                                                and environmental
ers’ markets, CSAs and farm-to-institution     an increasingly popular option. Selling food
                                               to institutions creates a reliable market for    burdens associated
programs, all of which are looking for local
producers. The following sections briefly       the farmer and provides great health and         with a product.
examine some of the markets and methods        economic benefits to the consumer. Farm-to-
available for a producer looking to reduce     institution programs also reduce food miles.
the energy involved in transporting food.      The University of Montana’s Farm to College
                                               program estimated that replacing a year’s
Direct Marketing                               supply of conventionally sourced hamburgers
                                               and French fries with local ingredients saved
Direct marketing allows farmers to com-
                                               43,000 gallons of fuel and the associated
pete with wholesale market channels and
                                               greenhouse gasses from being emitted.(16)
mass supermarket systems, thereby creat-
                                               For more information about setting up a farm-
ing a local food network and reducing the
                                               to-institution program in your area, see the
distance that food travels. Direct marketing
                                               ATTRA publication Bringing Local Foods to
networks could include farmers’ markets,
                                               Local Institutions: A Resource Guide for Farm-
wholesale food terminals and community-
                                               to-School and Farm-to-Institution Programs.
supported agriculture. The ATTRA publi-
cation Direct Marketing offers information
about alternative marketing systems, with
                                               Ecolabels
an emphasis on value-added crops.              Ecolabels offer one method for educating
                                               consumers about locally grown, sustainably
Farmers’ Markets and CSAs                      raised foods, and have proven effective in
                                               product marketing. An ecolabel is a seal or
Selling produce at farmers’ markets is one
                                               a logo indicating that a product has met a
alternative marketing strategy available for
                                               certain set of environmental and/or social
producers. By removing brokers from the
                                               standards or attributes.
distribution chain, farmers are able to reap
a greater profit. Farmers’ markets also ben-    The Leopold Center for Sustainable Agricul-
efit community interaction and economic         ture has researched the impact that labeling
development. For more information about        food with ecolabels containing information
www.attra.ncat.org                                                                              ATTRA        Page 7
such as food miles and CO2 emissions has        Consumer Considerations
                              on consumers. The study aimed to deter-
                              mine consumer opinion of locally produced       Consumer Demand
                              food and food miles. Surveys found that         Producers may question the extent to
                              consumers were more responsive to labels        which consumers are using food miles as
                              that focused on the food product’s fresh-       a basis for their food choices. In general
                              ness and quality rather than environmen-        food choices are no doubt based on price,
                              tal impact or CO2 emissions. Consumers          taste and appearance and a large section of
                              perceive that locally grown food is fresher;    the public knows and cares little about cli-
                              therefore ecolabels that contain information    mate change, especially with regard to food
                              such as “locally grown by family farmers”       choices.(19)
                              may be effective in influencing consumer
                              food choices. The study also found that         There has been increasing demand for food
                              consumers are willing to pay more for food      produced in accordance with ethical and
                              that has low environmental impacts.(17)         environmental standards, however, such as
                              Figure 7 is an example of a food label          organic and fair trade. Food mile concerns
                              containing food miles information.              may grow as well. Increasing food security
                                                                              and the domestic supply chain may be other
                                                                              arguments for reducing food miles.

                                                                              Why Consumers Should Care
                                                                              About Food Miles
                                                                              For consumers, convenience and cost are
                                                                              often driving factors when purchasing food.
                                                                              The choices consumers make, however, can
                                                                              have a great deal of influence on the direc-
                                                                              tion our food system is headed. Reducing
                                                                              the energy intensiveness of our food has
                                                                              several economic, social and environmental
                                                                              benefits. Consumers who are reducing their
                                                                              food mile footprint:
                                                                                  •   Enjoy fresher, healthier food
                                                                                  •   Support local farmers
                                                                                  •   Keep their money in the community
                                                                                  •   Know where their food comes from
Fig. 7: Food miles ecolabel example.
Source: Leopold Center for Sustainable Agriculture                                •   Reduce their carbon footprint

                                                                              Diet and Energy
                              The Western Montana Sustainable Grow-           Buying local and regional food is just one of
                              ers Union is a group of 12 Missoula-area        many dietary choices with important envi-
                              organic farms that has developed the            ronmental consequences. The FAO esti-
                              “Homegrown” label, which informs con-           mates that livestock are responsible for 18%
                              sumers that the food item they are purchas-     of global greenhouse gas emissions.(20) A
                              ing was grown within 150 miles. Producers       study at the University of Chicago compared
                              in the group pledge “to grow naturally, pro-    the energy consumption associated with
                              tect air and water, maintain fair labor prac-   animal-based diets versus plant-based diets
                              tices and, most importantly, to sell and buy    and found that consuming a typical Ameri-
                              in their communities.” Groups such as this      can diet of both animals and plants results
                              are jumping up across the country and hav-      in 1,485 kg more CO2 than a diet based on
                              ing an impact on their markets.(18)             plant sources only.
Page 8         ATTRA                                                               Food Miles: Background and Marketing
This study concludes that “For a person                    natural gas and other fossil fuels, through a
consuming a red meat diet at 35% of calo-                  highly energy-intensive process, eliminating
ries from animal sources, the added GHG                    synthetic fertilizer and pesticides can signifi-
burden above that of a plant eater equals                  cantly reduce the amount of energy required
the difference between driving a Camry and                 for production. However, increased demand
an SUV. These results clearly demonstrate                  for organics has resulted in retailers sourcing
the primary effect of one’s dietary choices                organically grown food from around the globe,
on one’s planetary footprint, an effect com-               creating increased emissions in the trans-
parable in magnitude to the car one chooses                portation process. Some locally grown non-
to drive.”(6)                                              organic foods may be less energy intensive
                                                           than organic foods traveling long distances.
Local vs. Organic                                          When evaluating our food options, the deci-
There has been a great amount of public                    sions are complex, especially if you want to
interest over the last few years in organic                make sustainable choices. Local, organic,
food systems. This is an indication of con-                fair-trade and other forms of sustainably pro-
sumers’ increasing awareness of where their                duced food all play a role in creating sustain-
food is coming from. Organic food is grown                 able food consumption patterns. The follow-
without synthetic fertilizers or pesticides.               ing table provides some guidelines for making
Since these chemicals are usually made from                ethical food decisions.


                                      Reducing Food Miles: What Individuals Can Do
       •   Learn what foods are in season in your area and try to build your diet around them.
       •   Shop at a local farmers’ market. People living in areas without a farmers’ market might try to start one
           themselves, linking up with interested neighbors and friends and contacting nearby farmers and agricultural
           officials for help. People can do the same with CSA subscription schemes.
       •   Eat minimally processed, packaged and marketed food. Generally speaking, the less processing and packaging
           you see, the less energy went into production and marketing, the less global warming pollution was created.
       •   Ask the manager or chef of your favorite restaurant how much of the food on the menu is locally grown, and
           then encourage him or her to source food locally. Urge that the share be increased. People can do the same at
           their local supermarket or school cafeteria.
       •   Consolidate trips when grocery shopping. Consider carpooling, public transportation, or a bike trailer for
           hauling groceries to reduce your personal contribution to food miles.
       •   Take a trip to a local farm to learn what it produces.
       •   Limit the amount of meat you consume and when you do buy meat, look for organic or free-range meat
           produced on sustainable farms.
       •   Produce a local food directory that lists all the local food sources in your area, including CSA arrangements,
           farmers’ markets, food co–ops, restaurants emphasizing seasonal cuisine and local produce, and farmers
           willing to sell direct to consumers year-round.
       •   Buy extra quantities of your favorite fruit or vegetable when it is in season and experiment with drying,
           canning, jamming, or otherwise preserving it for a later date.
       •   Plant a garden and grow as much of your own food as possible.
       •   Speak to your local politician about forming a local food policy council to help guide decisions that affect the
           local foodshed.


Table 1. What individuals can do to reduce food miles. Adapted from Brian Halweil’s Home Grown: the Case for Local Food in a Global Market. 2002.

www.attra.ncat.org                                                                                                     ATTRA            Page 9
Food Miles Tools                                      fruits and vegetables rather than produce
                                                                        from conventional sources outside the state.
                  Life Cycles Food Calculator                           www.leopold.iastate.edu/research/calculator/
                  The Life Cycles food calculator deter-                home.htm
                  mines the distance and amount of green-
                  house gases saved if a certain food product           Conclusion
                  is bought locally as opposed to imported.
                  www.gworks.ca/lcsite/food_directory/?q=food           Food miles are a growing cause of con-
                  miles/inventory/add                                   cern due to the greenhouse gas emis-
                                                                        sions released through the transportation
                  Food Carbon Footprint Calculator                      of our food—and rightly so, as food miles
                  A tool for residents within the UK to                 consume a considerable amount of energy.
                  calculate their food carbon footprint to              However, we must consider the many com-
                  better understand the extent to which food            plexities of the food system besides just
                  decisions impact global warming.                      the distance our food is traveling. Other
                  www.foodcarbon.co.uk                                  important issues include the mode of trans-
                                                                        portation, the production method, and pack-
                  LCA Food Database                                     aging considerations, as well as our own
                  A tool for acquiring an aggregated description        personal dietary choices. Each consumer
                  of emissions, waste and the resource use from         food decision provides an opportunity to
                  soil to kitchen per unit of different food items.     make a difference (large or small) in the
                  www.lcafood.dk                                        way energy is used and greenhouse gases
                                                                        are emitted. At the same time, growing con-
                  Iowa Produce Market Potential Calculator              sumer interest in local and regional foods
                  This calculator was designed to help users            is creating new marketing opportunities
                  determine expanding markets in Iowa if                and new possibilities for partnerships with
                  consumers ate more locally grown fresh                agricultural producers.


                  Truck on highway near Petersburg, West Virginia. Photo by Ken Hammond. Courtesy of USDA.


Page 10   ATTRA                                                               Food Miles: Background and Marketing
References                                                    10) Xureb, Marc. 2005. Food Miles: Environmen-
                                                                     tal Implication of Food Imports to Waterloo
                                                                     Region. www.leopold.iastate.edu/research/
1) United States Department of Agriculture. 1998. A                  marketing_ files/foodmiles_Canada_1105.pdf
        Time to Act: A Report on the USDA National            11) Whitlegg, J. 1993. Transport for a Sustainable Future:
        Commission on Small Farms. www.csrees.usda.                  The Case for Europe. Bellhaven Press, London.
        gov/nea/ag_systems/pdfs/time_to_act_1998.pdf
                                                              12) Smith, A. et al. 2005. The Validity of Food Miles
2) Halweil, Brian. 2006. Food Democracy: Nourishing                  as an Indicator of Sustainable Development.
       a Fundamental Freedom. Heifer International                   Oxon, United Kingdom: Department of Envi-
       World Ark. Jan/Feb 2006: 6-13.                                ronment, Food, and Rural Affairs.
       www.heifer.org/atf/cf/%7BE384D2DB-                            http://statistics.defra.gov.uk/esg/reports/
       8638-47F3-A6DB-68BE45A16EDC%7D/                               foodmiles/execsumm.pdf
       ’06%20JAN.FEB%20WORLD%20ARK.PDF
                                                              13) Kyodo News. March 2, 2005. Biztrend:
3) Halweil, Brian. 2002. Home Grown: The Case for                    Consumption of Local Food Helps Cut CO2
       Local Food in a Global Market.                                Emissions. www.farmtotable.org/index.php?cmd
       www.worldwatch.org/system/files/EWP163.pdf                     =F2TNews&method=view&id=262
4) Pirog, Rich, et al. 2001. Food Fuel, and Freeways:         14) Saunders, Caroline, et al. 2006. Food Miles Com-
        An Iowa Perspective on How Far Food Travels,                 parative Energy/Emissions Performance of
        Fuel Usage, and Greenhouse Gas Emissions.                    New Zealand’s Agriculture Industry.
        Leopold Center for Sustainable Agriculture.                  www.beehive.govt.nz/Documents/Files/Food%20
        www.leopold.iastate.edu/pubs/staff/ppp/food_mil.pdf          Miles%20Executive%20Summary.doc

5) Horrigan, Leo, et al. 2002. How Sustainable Agri-          15) Carlsson-Kanyama, Annika. 1998. Climate
                                                                     change and dietary choices – how can emis-
       culture can Address the Environment and
                                                                     sions of greenhouse gases from food consump-
       Human Health Harms of Industrial Agricul-
                                                                     tion be reduced? http://seminar.mannlib.cornell.
       ture. Environmental Health Perspectives. May                  edu/topics/food_security/resources/FS01.pdf
       2002: 445-456. www.ehponline.org/members/
       2002/110p445-456horrigan/EHP110p445PDF.PDF             16) Hassanein, Neva, et al. 2007. Tracing the Chain:
                                                                     An in Depth Look at the University of Mon-
6) Eshel, Gidon and Pamela Martin. 2005. Diet,                       tana’s Farm to College Program.
       Energy and Global Warming. University of                      www.growmontana.ncat.org/docs/tracing_the_
       Chicago, Department of Geophysical Sciences.                  chain_e_summary_new.pdf
       http://geosci.uchicago.edu/~gidon/papers/nutri/
       nutri3.pdf                                             17) Pirog, Rich, et al. 2003. Ecolabel Value
                                                                      Assessment: Consumer and Food Business
7) Heller, Martin C., and Gregory A. Keoleian. Life                   Perceptions of Local Foods. www.leopold.
        Cycle-Based Sustainability Indicators for                     iastate.edu/pubs/staff/ecolabels/ecolabels.pdf
        Assessment of the U.S. Food System. Ann
                                                              18) Sooter, Tad. 2006. Western Montana Growers
        Arbor, MI: Center for Sustainable Systems,                   Go Beyond Organics and Get Local.
        University of Michigan, 2000: 42. Report No.                 www.newwest.net/index.php/main/article/
        CSS00-04. www.public.iastate.edu/~brummer/                   bringing_organics_home/
        papers/FoodSystemSustainability.pdf
                                                              19) Garnett, T. 2003. Wise moves. Exploring the rela-
8) Murray, Danielle. 2005. Oil and Food: A Ris-                      tionship between food, road transport and
       ing Security Challenge. www.earthpolicy.org/                  CO2. Transport2000. www.thepep.org/
       Updates/2005/Update48.htm                                     ClearingHouse/docfiles/wise_moves.pdf
9) Pirog, Rich. 2002. How Far Do Your Fruit                   20) Steinfield, Henning et al. 2006. Livestock’s Long
        and Vegetables Travel? Leopold Center for                     Shadow: Environmental issues and options.
        Sustainable Agriculture. www.leopold.iastate.                 www.virtualcentre.org/en/library/key_pub/
        edu/pubs/staff/ppp/food_chart0402.pdf                         longshad/A0701E00.pdf
www.attra.ncat.org                                                                                 ATTRA        Page 11
Food Miles: Background and Marketing
                  By Holly Hill
                  NCAT Research Specialist
                  © 2008 NCAT
                  This publication is available on the Web at:
                  www.attra.ncat.org/attra-pub/foodmiles.html
                  or
                  www.attra.ncat.org/attra-pub/PDF/foodmiles.pdf
                  IP312
                  Slot 311
                  Version 010708


Page 12   ATTRA

Contenu connexe

Tendances

Valuing Our Food: Minimizing Waste and Optimizing Resources - The Scope of th...
Valuing Our Food: Minimizing Waste and Optimizing Resources - The Scope of th...Valuing Our Food: Minimizing Waste and Optimizing Resources - The Scope of th...
Valuing Our Food: Minimizing Waste and Optimizing Resources - The Scope of th...Steven M. Finn
 
Waste Not, Warm Not: Poverty, Hunger, and Climate Change in a Circular Food S...
Waste Not, Warm Not: Poverty, Hunger, and Climate Change in a Circular Food S...Waste Not, Warm Not: Poverty, Hunger, and Climate Change in a Circular Food S...
Waste Not, Warm Not: Poverty, Hunger, and Climate Change in a Circular Food S...IFPRI-PIM
 
Side event WFN_ Arjen Hoekstra, WFN, 14th January UN Water Conference Zaragoz...
Side event WFN_ Arjen Hoekstra, WFN, 14th January UN Water Conference Zaragoz...Side event WFN_ Arjen Hoekstra, WFN, 14th January UN Water Conference Zaragoz...
Side event WFN_ Arjen Hoekstra, WFN, 14th January UN Water Conference Zaragoz...water-decade
 
Reducing Food Loss and Waste: Creating a Sustainable Food Future, Installment 2
Reducing Food Loss and Waste: Creating a Sustainable Food Future, Installment 2Reducing Food Loss and Waste: Creating a Sustainable Food Future, Installment 2
Reducing Food Loss and Waste: Creating a Sustainable Food Future, Installment 2World Resources Institute (WRI)
 
Farm to fork ppt
Farm to fork ppt Farm to fork ppt
Farm to fork ppt sagarvyas96
 
Doug Baker's Presentation from the 2014 Minnesota AgriGrowth Council Annual M...
Doug Baker's Presentation from the 2014 Minnesota AgriGrowth Council Annual M...Doug Baker's Presentation from the 2014 Minnesota AgriGrowth Council Annual M...
Doug Baker's Presentation from the 2014 Minnesota AgriGrowth Council Annual M...Minnesota AgriGrowth Council
 
Perfect Food: The Silicon Valley Food Movement
Perfect Food: The Silicon Valley Food MovementPerfect Food: The Silicon Valley Food Movement
Perfect Food: The Silicon Valley Food MovementTrung Ho
 
Meeting the rising demand for Animal Source Foods: Implications for land use ...
Meeting the rising demand for Animal Source Foods: Implications for land use ...Meeting the rising demand for Animal Source Foods: Implications for land use ...
Meeting the rising demand for Animal Source Foods: Implications for land use ...ILRI
 
The protein challenge_2040_summary_report
The protein challenge_2040_summary_reportThe protein challenge_2040_summary_report
The protein challenge_2040_summary_reportNew Food Innovation Ltd
 
Eat Well Guide : A more sustainable Diet : Carbon Trust UK
Eat Well Guide : A more sustainable Diet : Carbon Trust UKEat Well Guide : A more sustainable Diet : Carbon Trust UK
Eat Well Guide : A more sustainable Diet : Carbon Trust UKNew Food Innovation Ltd
 
Valuing our food and water resources steven m. finn - june 2014
Valuing our food and water resources    steven m. finn - june 2014Valuing our food and water resources    steven m. finn - june 2014
Valuing our food and water resources steven m. finn - june 2014Steven M. Finn
 
Global Food Waste: A Primer
Global Food Waste: A PrimerGlobal Food Waste: A Primer
Global Food Waste: A Primerijtsrd
 
Achieving Replacement Level Fertility: Creating a Sustainable Food Future, In...
Achieving Replacement Level Fertility: Creating a Sustainable Food Future, In...Achieving Replacement Level Fertility: Creating a Sustainable Food Future, In...
Achieving Replacement Level Fertility: Creating a Sustainable Food Future, In...World Resources Institute (WRI)
 

Tendances (20)

Valuing Our Food: Minimizing Waste and Optimizing Resources - The Scope of th...
Valuing Our Food: Minimizing Waste and Optimizing Resources - The Scope of th...Valuing Our Food: Minimizing Waste and Optimizing Resources - The Scope of th...
Valuing Our Food: Minimizing Waste and Optimizing Resources - The Scope of th...
 
Food wastage.ppt
Food wastage.pptFood wastage.ppt
Food wastage.ppt
 
Waste Not, Warm Not: Poverty, Hunger, and Climate Change in a Circular Food S...
Waste Not, Warm Not: Poverty, Hunger, and Climate Change in a Circular Food S...Waste Not, Warm Not: Poverty, Hunger, and Climate Change in a Circular Food S...
Waste Not, Warm Not: Poverty, Hunger, and Climate Change in a Circular Food S...
 
Serving food for change
Serving food for changeServing food for change
Serving food for change
 
Side event WFN_ Arjen Hoekstra, WFN, 14th January UN Water Conference Zaragoz...
Side event WFN_ Arjen Hoekstra, WFN, 14th January UN Water Conference Zaragoz...Side event WFN_ Arjen Hoekstra, WFN, 14th January UN Water Conference Zaragoz...
Side event WFN_ Arjen Hoekstra, WFN, 14th January UN Water Conference Zaragoz...
 
Reducing Food Loss and Waste: Creating a Sustainable Food Future, Installment 2
Reducing Food Loss and Waste: Creating a Sustainable Food Future, Installment 2Reducing Food Loss and Waste: Creating a Sustainable Food Future, Installment 2
Reducing Food Loss and Waste: Creating a Sustainable Food Future, Installment 2
 
Farm to fork ppt
Farm to fork ppt Farm to fork ppt
Farm to fork ppt
 
Doug Baker's Presentation from the 2014 Minnesota AgriGrowth Council Annual M...
Doug Baker's Presentation from the 2014 Minnesota AgriGrowth Council Annual M...Doug Baker's Presentation from the 2014 Minnesota AgriGrowth Council Annual M...
Doug Baker's Presentation from the 2014 Minnesota AgriGrowth Council Annual M...
 
Food Waste Research Paper
Food Waste Research PaperFood Waste Research Paper
Food Waste Research Paper
 
Perfect Food: The Silicon Valley Food Movement
Perfect Food: The Silicon Valley Food MovementPerfect Food: The Silicon Valley Food Movement
Perfect Food: The Silicon Valley Food Movement
 
Meeting the rising demand for Animal Source Foods: Implications for land use ...
Meeting the rising demand for Animal Source Foods: Implications for land use ...Meeting the rising demand for Animal Source Foods: Implications for land use ...
Meeting the rising demand for Animal Source Foods: Implications for land use ...
 
Creating a Sustainable Food Future: Interim Findings
Creating a Sustainable Food Future: Interim FindingsCreating a Sustainable Food Future: Interim Findings
Creating a Sustainable Food Future: Interim Findings
 
The protein challenge_2040_summary_report
The protein challenge_2040_summary_reportThe protein challenge_2040_summary_report
The protein challenge_2040_summary_report
 
Tossed out food waste in america
Tossed out food waste in americaTossed out food waste in america
Tossed out food waste in america
 
Eat Well Guide : A more sustainable Diet : Carbon Trust UK
Eat Well Guide : A more sustainable Diet : Carbon Trust UKEat Well Guide : A more sustainable Diet : Carbon Trust UK
Eat Well Guide : A more sustainable Diet : Carbon Trust UK
 
Valuing our food and water resources steven m. finn - june 2014
Valuing our food and water resources    steven m. finn - june 2014Valuing our food and water resources    steven m. finn - june 2014
Valuing our food and water resources steven m. finn - june 2014
 
Bioenergy or Hydropower: Implication for Water and Food
Bioenergy or Hydropower: Implication for Water and FoodBioenergy or Hydropower: Implication for Water and Food
Bioenergy or Hydropower: Implication for Water and Food
 
Global Food Waste: A Primer
Global Food Waste: A PrimerGlobal Food Waste: A Primer
Global Food Waste: A Primer
 
Achieving Replacement Level Fertility: Creating a Sustainable Food Future, In...
Achieving Replacement Level Fertility: Creating a Sustainable Food Future, In...Achieving Replacement Level Fertility: Creating a Sustainable Food Future, In...
Achieving Replacement Level Fertility: Creating a Sustainable Food Future, In...
 
How to Feed the World Without Destroying It
How to Feed the World Without Destroying ItHow to Feed the World Without Destroying It
How to Feed the World Without Destroying It
 

Similaire à Food Miles: Background and Marketing

Food Miles: Background and Marketing
Food Miles: Background and MarketingFood Miles: Background and Marketing
Food Miles: Background and MarketingGardening
 
Global Food Sustainability - Australia and the Road Ahead
Global Food Sustainability - Australia and the Road AheadGlobal Food Sustainability - Australia and the Road Ahead
Global Food Sustainability - Australia and the Road AheadWaite Research Institute
 
Sustainable Agriculture: An Introduction
Sustainable Agriculture: An IntroductionSustainable Agriculture: An Introduction
Sustainable Agriculture: An IntroductionElisaMendelsohn
 
CIAT Strategy 2014–2020 A Synthesis
CIAT Strategy 2014–2020 A SynthesisCIAT Strategy 2014–2020 A Synthesis
CIAT Strategy 2014–2020 A SynthesisCIAT
 
5.2 Food Production And Consuption System In Europe
5.2 Food Production And Consuption System In Europe5.2 Food Production And Consuption System In Europe
5.2 Food Production And Consuption System In EuropeLeNS_slide
 
5.2 Food production and consumption system in Europe
  5.2 Food production and consumption system in Europe  5.2 Food production and consumption system in Europe
5.2 Food production and consumption system in EuropeUtttam Kumar
 
Science-fiction or science-fact? Research for sustainable livestock agri-food...
Science-fiction or science-fact? Research for sustainable livestock agri-food...Science-fiction or science-fact? Research for sustainable livestock agri-food...
Science-fiction or science-fact? Research for sustainable livestock agri-food...ILRI
 
What is sustainable agriculture
What is sustainable agricultureWhat is sustainable agriculture
What is sustainable agricultureHoward Barmil
 
Agriculture sustainability and food security is our insurance policy for futu...
Agriculture sustainability and food security is our insurance policy for futu...Agriculture sustainability and food security is our insurance policy for futu...
Agriculture sustainability and food security is our insurance policy for futu...Howard Barmil
 
RUNNING Head IMPACTS ON FOOD SYSTEMS. .docx
RUNNING Head IMPACTS ON FOOD SYSTEMS.                            .docxRUNNING Head IMPACTS ON FOOD SYSTEMS.                            .docx
RUNNING Head IMPACTS ON FOOD SYSTEMS. .docxwlynn1
 
Sustainable agriculture and its effectiveness - Capstone research project
Sustainable agriculture and its effectiveness - Capstone research project Sustainable agriculture and its effectiveness - Capstone research project
Sustainable agriculture and its effectiveness - Capstone research project MatthewBelanger10
 
Paper in TAA (Tropical Agriculture Assoc) Journal, AG4 Dev36 spring 2019
Paper in TAA (Tropical Agriculture Assoc) Journal, AG4 Dev36 spring 2019Paper in TAA (Tropical Agriculture Assoc) Journal, AG4 Dev36 spring 2019
Paper in TAA (Tropical Agriculture Assoc) Journal, AG4 Dev36 spring 2019Pawanexh Kohli
 
Organic Solutions to Global Warming and Food Security
Organic Solutions to Global Warming and Food SecurityOrganic Solutions to Global Warming and Food Security
Organic Solutions to Global Warming and Food SecurityZ3P
 

Similaire à Food Miles: Background and Marketing (20)

Food Miles: Background and Marketing
Food Miles: Background and MarketingFood Miles: Background and Marketing
Food Miles: Background and Marketing
 
Global Food Sustainability - Australia and the Road Ahead
Global Food Sustainability - Australia and the Road AheadGlobal Food Sustainability - Australia and the Road Ahead
Global Food Sustainability - Australia and the Road Ahead
 
Climate smart agriculture
Climate smart agricultureClimate smart agriculture
Climate smart agriculture
 
MAN 2005 - Lec 7
MAN 2005 - Lec 7MAN 2005 - Lec 7
MAN 2005 - Lec 7
 
Sustainable Agriculture: An Introduction
Sustainable Agriculture: An IntroductionSustainable Agriculture: An Introduction
Sustainable Agriculture: An Introduction
 
CIAT Strategy 2014–2020 A Synthesis
CIAT Strategy 2014–2020 A SynthesisCIAT Strategy 2014–2020 A Synthesis
CIAT Strategy 2014–2020 A Synthesis
 
5.2 Food Production And Consuption System In Europe
5.2 Food Production And Consuption System In Europe5.2 Food Production And Consuption System In Europe
5.2 Food Production And Consuption System In Europe
 
5.2 Food production and consumption system in Europe
  5.2 Food production and consumption system in Europe  5.2 Food production and consumption system in Europe
5.2 Food production and consumption system in Europe
 
Food Without Destruction
Food Without DestructionFood Without Destruction
Food Without Destruction
 
Waste and Spoilage in the Food Chain
Waste and Spoilage in the Food ChainWaste and Spoilage in the Food Chain
Waste and Spoilage in the Food Chain
 
Farmer
FarmerFarmer
Farmer
 
Science-fiction or science-fact? Research for sustainable livestock agri-food...
Science-fiction or science-fact? Research for sustainable livestock agri-food...Science-fiction or science-fact? Research for sustainable livestock agri-food...
Science-fiction or science-fact? Research for sustainable livestock agri-food...
 
What is sustainable agriculture
What is sustainable agricultureWhat is sustainable agriculture
What is sustainable agriculture
 
Agriculture sustainability and food security is our insurance policy for futu...
Agriculture sustainability and food security is our insurance policy for futu...Agriculture sustainability and food security is our insurance policy for futu...
Agriculture sustainability and food security is our insurance policy for futu...
 
Small
SmallSmall
Small
 
Small
SmallSmall
Small
 
RUNNING Head IMPACTS ON FOOD SYSTEMS. .docx
RUNNING Head IMPACTS ON FOOD SYSTEMS.                            .docxRUNNING Head IMPACTS ON FOOD SYSTEMS.                            .docx
RUNNING Head IMPACTS ON FOOD SYSTEMS. .docx
 
Sustainable agriculture and its effectiveness - Capstone research project
Sustainable agriculture and its effectiveness - Capstone research project Sustainable agriculture and its effectiveness - Capstone research project
Sustainable agriculture and its effectiveness - Capstone research project
 
Paper in TAA (Tropical Agriculture Assoc) Journal, AG4 Dev36 spring 2019
Paper in TAA (Tropical Agriculture Assoc) Journal, AG4 Dev36 spring 2019Paper in TAA (Tropical Agriculture Assoc) Journal, AG4 Dev36 spring 2019
Paper in TAA (Tropical Agriculture Assoc) Journal, AG4 Dev36 spring 2019
 
Organic Solutions to Global Warming and Food Security
Organic Solutions to Global Warming and Food SecurityOrganic Solutions to Global Warming and Food Security
Organic Solutions to Global Warming and Food Security
 

Plus de ElisaMendelsohn

Beef Farm Sustainability Checksheet
Beef Farm Sustainability ChecksheetBeef Farm Sustainability Checksheet
Beef Farm Sustainability ChecksheetElisaMendelsohn
 
Garden Therapy: Links to Articles, Books, Profession Groups, DVD
Garden Therapy: Links to Articles, Books, Profession Groups, DVDGarden Therapy: Links to Articles, Books, Profession Groups, DVD
Garden Therapy: Links to Articles, Books, Profession Groups, DVDElisaMendelsohn
 
Sistemas Avícolas Alternativos con Acceso a Pastura
Sistemas Avícolas Alternativos con Acceso a PasturaSistemas Avícolas Alternativos con Acceso a Pastura
Sistemas Avícolas Alternativos con Acceso a PasturaElisaMendelsohn
 
Producción Orgánica de Lechugas de Especialidad y Verduras Para Ensalada
Producción Orgánica de Lechugas de Especialidad y Verduras Para EnsaladaProducción Orgánica de Lechugas de Especialidad y Verduras Para Ensalada
Producción Orgánica de Lechugas de Especialidad y Verduras Para EnsaladaElisaMendelsohn
 
Procesamiento de Aves a Pequeña Escala
Procesamiento de Aves a Pequeña EscalaProcesamiento de Aves a Pequeña Escala
Procesamiento de Aves a Pequeña EscalaElisaMendelsohn
 
Planeando la Plantación de Vegetales para una Cosecha Continua
Planeando la Plantación de Vegetales para una Cosecha ContinuaPlaneando la Plantación de Vegetales para una Cosecha Continua
Planeando la Plantación de Vegetales para una Cosecha ContinuaElisaMendelsohn
 
Nutrición para Rumiantes en Pastoreo
Nutrición para Rumiantes en PastoreoNutrición para Rumiantes en Pastoreo
Nutrición para Rumiantes en PastoreoElisaMendelsohn
 
Nutrición para Aves de Pastura
Nutrición para Aves de PasturaNutrición para Aves de Pastura
Nutrición para Aves de PasturaElisaMendelsohn
 
Nuevos Mercados para Su Cosecha (audio version)
Nuevos Mercados para Su Cosecha (audio version)Nuevos Mercados para Su Cosecha (audio version)
Nuevos Mercados para Su Cosecha (audio version)ElisaMendelsohn
 
Los Escarabajos del Pepino: Manejo Integrado de Plagas — MIP Orgánico y Biora...
Los Escarabajos del Pepino: Manejo Integrado de Plagas — MIP Orgánico y Biora...Los Escarabajos del Pepino: Manejo Integrado de Plagas — MIP Orgánico y Biora...
Los Escarabajos del Pepino: Manejo Integrado de Plagas — MIP Orgánico y Biora...ElisaMendelsohn
 
Las Crónicas Orgánicas No. 1: No Tenga Pánico Vuélvase Orgánico
Las Crónicas Orgánicas No. 1: No Tenga Pánico Vuélvase OrgánicoLas Crónicas Orgánicas No. 1: No Tenga Pánico Vuélvase Orgánico
Las Crónicas Orgánicas No. 1: No Tenga Pánico Vuélvase OrgánicoElisaMendelsohn
 
La Certificación para Granjas Orgánicas y el Programa Orgánico Nacional
La Certificación para Granjas Orgánicas y el Programa Orgánico NacionalLa Certificación para Granjas Orgánicas y el Programa Orgánico Nacional
La Certificación para Granjas Orgánicas y el Programa Orgánico NacionalElisaMendelsohn
 
Jardinería Comercial: Consideraciones para Producción de Frutas y Verduras
Jardinería Comercial: Consideraciones para Producción de Frutas y VerdurasJardinería Comercial: Consideraciones para Producción de Frutas y Verduras
Jardinería Comercial: Consideraciones para Producción de Frutas y VerdurasElisaMendelsohn
 
Guía Ilustrada para la Producción de Ovinos y Caprinos
Guía Ilustrada para la Producción de Ovinos y CaprinosGuía Ilustrada para la Producción de Ovinos y Caprinos
Guía Ilustrada para la Producción de Ovinos y CaprinosElisaMendelsohn
 
Fresas: Producción Orgánica
Fresas: Producción OrgánicaFresas: Producción Orgánica
Fresas: Producción OrgánicaElisaMendelsohn
 
Equipo para Producción Aviar Alternativa
Equipo para Producción Aviar AlternativaEquipo para Producción Aviar Alternativa
Equipo para Producción Aviar AlternativaElisaMendelsohn
 
El Proceso de la Certificación Orgánica
El Proceso de la Certificación OrgánicaEl Proceso de la Certificación Orgánica
El Proceso de la Certificación OrgánicaElisaMendelsohn
 
El Manejo Sostenible de Suelos
El Manejo Sostenible de SuelosEl Manejo Sostenible de Suelos
El Manejo Sostenible de SuelosElisaMendelsohn
 
El Manejo de Gallineros para la Producción Alternativa
El Manejo de Gallineros para la Producción AlternativaEl Manejo de Gallineros para la Producción Alternativa
El Manejo de Gallineros para la Producción AlternativaElisaMendelsohn
 
Como Prepararse para la Inspección Orgánica
Como Prepararse para la Inspección OrgánicaComo Prepararse para la Inspección Orgánica
Como Prepararse para la Inspección OrgánicaElisaMendelsohn
 

Plus de ElisaMendelsohn (20)

Beef Farm Sustainability Checksheet
Beef Farm Sustainability ChecksheetBeef Farm Sustainability Checksheet
Beef Farm Sustainability Checksheet
 
Garden Therapy: Links to Articles, Books, Profession Groups, DVD
Garden Therapy: Links to Articles, Books, Profession Groups, DVDGarden Therapy: Links to Articles, Books, Profession Groups, DVD
Garden Therapy: Links to Articles, Books, Profession Groups, DVD
 
Sistemas Avícolas Alternativos con Acceso a Pastura
Sistemas Avícolas Alternativos con Acceso a PasturaSistemas Avícolas Alternativos con Acceso a Pastura
Sistemas Avícolas Alternativos con Acceso a Pastura
 
Producción Orgánica de Lechugas de Especialidad y Verduras Para Ensalada
Producción Orgánica de Lechugas de Especialidad y Verduras Para EnsaladaProducción Orgánica de Lechugas de Especialidad y Verduras Para Ensalada
Producción Orgánica de Lechugas de Especialidad y Verduras Para Ensalada
 
Procesamiento de Aves a Pequeña Escala
Procesamiento de Aves a Pequeña EscalaProcesamiento de Aves a Pequeña Escala
Procesamiento de Aves a Pequeña Escala
 
Planeando la Plantación de Vegetales para una Cosecha Continua
Planeando la Plantación de Vegetales para una Cosecha ContinuaPlaneando la Plantación de Vegetales para una Cosecha Continua
Planeando la Plantación de Vegetales para una Cosecha Continua
 
Nutrición para Rumiantes en Pastoreo
Nutrición para Rumiantes en PastoreoNutrición para Rumiantes en Pastoreo
Nutrición para Rumiantes en Pastoreo
 
Nutrición para Aves de Pastura
Nutrición para Aves de PasturaNutrición para Aves de Pastura
Nutrición para Aves de Pastura
 
Nuevos Mercados para Su Cosecha (audio version)
Nuevos Mercados para Su Cosecha (audio version)Nuevos Mercados para Su Cosecha (audio version)
Nuevos Mercados para Su Cosecha (audio version)
 
Los Escarabajos del Pepino: Manejo Integrado de Plagas — MIP Orgánico y Biora...
Los Escarabajos del Pepino: Manejo Integrado de Plagas — MIP Orgánico y Biora...Los Escarabajos del Pepino: Manejo Integrado de Plagas — MIP Orgánico y Biora...
Los Escarabajos del Pepino: Manejo Integrado de Plagas — MIP Orgánico y Biora...
 
Las Crónicas Orgánicas No. 1: No Tenga Pánico Vuélvase Orgánico
Las Crónicas Orgánicas No. 1: No Tenga Pánico Vuélvase OrgánicoLas Crónicas Orgánicas No. 1: No Tenga Pánico Vuélvase Orgánico
Las Crónicas Orgánicas No. 1: No Tenga Pánico Vuélvase Orgánico
 
La Certificación para Granjas Orgánicas y el Programa Orgánico Nacional
La Certificación para Granjas Orgánicas y el Programa Orgánico NacionalLa Certificación para Granjas Orgánicas y el Programa Orgánico Nacional
La Certificación para Granjas Orgánicas y el Programa Orgánico Nacional
 
Jardinería Comercial: Consideraciones para Producción de Frutas y Verduras
Jardinería Comercial: Consideraciones para Producción de Frutas y VerdurasJardinería Comercial: Consideraciones para Producción de Frutas y Verduras
Jardinería Comercial: Consideraciones para Producción de Frutas y Verduras
 
Guía Ilustrada para la Producción de Ovinos y Caprinos
Guía Ilustrada para la Producción de Ovinos y CaprinosGuía Ilustrada para la Producción de Ovinos y Caprinos
Guía Ilustrada para la Producción de Ovinos y Caprinos
 
Fresas: Producción Orgánica
Fresas: Producción OrgánicaFresas: Producción Orgánica
Fresas: Producción Orgánica
 
Equipo para Producción Aviar Alternativa
Equipo para Producción Aviar AlternativaEquipo para Producción Aviar Alternativa
Equipo para Producción Aviar Alternativa
 
El Proceso de la Certificación Orgánica
El Proceso de la Certificación OrgánicaEl Proceso de la Certificación Orgánica
El Proceso de la Certificación Orgánica
 
El Manejo Sostenible de Suelos
El Manejo Sostenible de SuelosEl Manejo Sostenible de Suelos
El Manejo Sostenible de Suelos
 
El Manejo de Gallineros para la Producción Alternativa
El Manejo de Gallineros para la Producción AlternativaEl Manejo de Gallineros para la Producción Alternativa
El Manejo de Gallineros para la Producción Alternativa
 
Como Prepararse para la Inspección Orgánica
Como Prepararse para la Inspección OrgánicaComo Prepararse para la Inspección Orgánica
Como Prepararse para la Inspección Orgánica
 

Dernier

Incoming and Outgoing Shipments in 3 STEPS Using Odoo 17
Incoming and Outgoing Shipments in 3 STEPS Using Odoo 17Incoming and Outgoing Shipments in 3 STEPS Using Odoo 17
Incoming and Outgoing Shipments in 3 STEPS Using Odoo 17Celine George
 
call girls in Kamla Market (DELHI) 🔝 >༒9953330565🔝 genuine Escort Service 🔝✔️✔️
call girls in Kamla Market (DELHI) 🔝 >༒9953330565🔝 genuine Escort Service 🔝✔️✔️call girls in Kamla Market (DELHI) 🔝 >༒9953330565🔝 genuine Escort Service 🔝✔️✔️
call girls in Kamla Market (DELHI) 🔝 >༒9953330565🔝 genuine Escort Service 🔝✔️✔️9953056974 Low Rate Call Girls In Saket, Delhi NCR
 
Virtual-Orientation-on-the-Administration-of-NATG12-NATG6-and-ELLNA.pdf
Virtual-Orientation-on-the-Administration-of-NATG12-NATG6-and-ELLNA.pdfVirtual-Orientation-on-the-Administration-of-NATG12-NATG6-and-ELLNA.pdf
Virtual-Orientation-on-the-Administration-of-NATG12-NATG6-and-ELLNA.pdfErwinPantujan2
 
Influencing policy (training slides from Fast Track Impact)
Influencing policy (training slides from Fast Track Impact)Influencing policy (training slides from Fast Track Impact)
Influencing policy (training slides from Fast Track Impact)Mark Reed
 
FILIPINO PSYCHology sikolohiyang pilipino
FILIPINO PSYCHology sikolohiyang pilipinoFILIPINO PSYCHology sikolohiyang pilipino
FILIPINO PSYCHology sikolohiyang pilipinojohnmickonozaleda
 
INTRODUCTION TO CATHOLIC CHRISTOLOGY.pptx
INTRODUCTION TO CATHOLIC CHRISTOLOGY.pptxINTRODUCTION TO CATHOLIC CHRISTOLOGY.pptx
INTRODUCTION TO CATHOLIC CHRISTOLOGY.pptxHumphrey A Beña
 
Procuring digital preservation CAN be quick and painless with our new dynamic...
Procuring digital preservation CAN be quick and painless with our new dynamic...Procuring digital preservation CAN be quick and painless with our new dynamic...
Procuring digital preservation CAN be quick and painless with our new dynamic...Jisc
 
How to Add Barcode on PDF Report in Odoo 17
How to Add Barcode on PDF Report in Odoo 17How to Add Barcode on PDF Report in Odoo 17
How to Add Barcode on PDF Report in Odoo 17Celine George
 
GRADE 4 - SUMMATIVE TEST QUARTER 4 ALL SUBJECTS
GRADE 4 - SUMMATIVE TEST QUARTER 4 ALL SUBJECTSGRADE 4 - SUMMATIVE TEST QUARTER 4 ALL SUBJECTS
GRADE 4 - SUMMATIVE TEST QUARTER 4 ALL SUBJECTSJoshuaGantuangco2
 
AMERICAN LANGUAGE HUB_Level2_Student'sBook_Answerkey.pdf
AMERICAN LANGUAGE HUB_Level2_Student'sBook_Answerkey.pdfAMERICAN LANGUAGE HUB_Level2_Student'sBook_Answerkey.pdf
AMERICAN LANGUAGE HUB_Level2_Student'sBook_Answerkey.pdfphamnguyenenglishnb
 
Science 7 Quarter 4 Module 2: Natural Resources.pptx
Science 7 Quarter 4 Module 2: Natural Resources.pptxScience 7 Quarter 4 Module 2: Natural Resources.pptx
Science 7 Quarter 4 Module 2: Natural Resources.pptxMaryGraceBautista27
 
AUDIENCE THEORY -CULTIVATION THEORY - GERBNER.pptx
AUDIENCE THEORY -CULTIVATION THEORY -  GERBNER.pptxAUDIENCE THEORY -CULTIVATION THEORY -  GERBNER.pptx
AUDIENCE THEORY -CULTIVATION THEORY - GERBNER.pptxiammrhaywood
 
Barangay Council for the Protection of Children (BCPC) Orientation.pptx
Barangay Council for the Protection of Children (BCPC) Orientation.pptxBarangay Council for the Protection of Children (BCPC) Orientation.pptx
Barangay Council for the Protection of Children (BCPC) Orientation.pptxCarlos105
 
Choosing the Right CBSE School A Comprehensive Guide for Parents
Choosing the Right CBSE School A Comprehensive Guide for ParentsChoosing the Right CBSE School A Comprehensive Guide for Parents
Choosing the Right CBSE School A Comprehensive Guide for Parentsnavabharathschool99
 
ECONOMIC CONTEXT - PAPER 1 Q3: NEWSPAPERS.pptx
ECONOMIC CONTEXT - PAPER 1 Q3: NEWSPAPERS.pptxECONOMIC CONTEXT - PAPER 1 Q3: NEWSPAPERS.pptx
ECONOMIC CONTEXT - PAPER 1 Q3: NEWSPAPERS.pptxiammrhaywood
 
THEORIES OF ORGANIZATION-PUBLIC ADMINISTRATION
THEORIES OF ORGANIZATION-PUBLIC ADMINISTRATIONTHEORIES OF ORGANIZATION-PUBLIC ADMINISTRATION
THEORIES OF ORGANIZATION-PUBLIC ADMINISTRATIONHumphrey A Beña
 

Dernier (20)

Incoming and Outgoing Shipments in 3 STEPS Using Odoo 17
Incoming and Outgoing Shipments in 3 STEPS Using Odoo 17Incoming and Outgoing Shipments in 3 STEPS Using Odoo 17
Incoming and Outgoing Shipments in 3 STEPS Using Odoo 17
 
call girls in Kamla Market (DELHI) 🔝 >༒9953330565🔝 genuine Escort Service 🔝✔️✔️
call girls in Kamla Market (DELHI) 🔝 >༒9953330565🔝 genuine Escort Service 🔝✔️✔️call girls in Kamla Market (DELHI) 🔝 >༒9953330565🔝 genuine Escort Service 🔝✔️✔️
call girls in Kamla Market (DELHI) 🔝 >༒9953330565🔝 genuine Escort Service 🔝✔️✔️
 
Virtual-Orientation-on-the-Administration-of-NATG12-NATG6-and-ELLNA.pdf
Virtual-Orientation-on-the-Administration-of-NATG12-NATG6-and-ELLNA.pdfVirtual-Orientation-on-the-Administration-of-NATG12-NATG6-and-ELLNA.pdf
Virtual-Orientation-on-the-Administration-of-NATG12-NATG6-and-ELLNA.pdf
 
YOUVE_GOT_EMAIL_PRELIMS_EL_DORADO_2024.pptx
YOUVE_GOT_EMAIL_PRELIMS_EL_DORADO_2024.pptxYOUVE_GOT_EMAIL_PRELIMS_EL_DORADO_2024.pptx
YOUVE_GOT_EMAIL_PRELIMS_EL_DORADO_2024.pptx
 
LEFT_ON_C'N_ PRELIMS_EL_DORADO_2024.pptx
LEFT_ON_C'N_ PRELIMS_EL_DORADO_2024.pptxLEFT_ON_C'N_ PRELIMS_EL_DORADO_2024.pptx
LEFT_ON_C'N_ PRELIMS_EL_DORADO_2024.pptx
 
Influencing policy (training slides from Fast Track Impact)
Influencing policy (training slides from Fast Track Impact)Influencing policy (training slides from Fast Track Impact)
Influencing policy (training slides from Fast Track Impact)
 
FILIPINO PSYCHology sikolohiyang pilipino
FILIPINO PSYCHology sikolohiyang pilipinoFILIPINO PSYCHology sikolohiyang pilipino
FILIPINO PSYCHology sikolohiyang pilipino
 
INTRODUCTION TO CATHOLIC CHRISTOLOGY.pptx
INTRODUCTION TO CATHOLIC CHRISTOLOGY.pptxINTRODUCTION TO CATHOLIC CHRISTOLOGY.pptx
INTRODUCTION TO CATHOLIC CHRISTOLOGY.pptx
 
Procuring digital preservation CAN be quick and painless with our new dynamic...
Procuring digital preservation CAN be quick and painless with our new dynamic...Procuring digital preservation CAN be quick and painless with our new dynamic...
Procuring digital preservation CAN be quick and painless with our new dynamic...
 
How to Add Barcode on PDF Report in Odoo 17
How to Add Barcode on PDF Report in Odoo 17How to Add Barcode on PDF Report in Odoo 17
How to Add Barcode on PDF Report in Odoo 17
 
Raw materials used in Herbal Cosmetics.pptx
Raw materials used in Herbal Cosmetics.pptxRaw materials used in Herbal Cosmetics.pptx
Raw materials used in Herbal Cosmetics.pptx
 
GRADE 4 - SUMMATIVE TEST QUARTER 4 ALL SUBJECTS
GRADE 4 - SUMMATIVE TEST QUARTER 4 ALL SUBJECTSGRADE 4 - SUMMATIVE TEST QUARTER 4 ALL SUBJECTS
GRADE 4 - SUMMATIVE TEST QUARTER 4 ALL SUBJECTS
 
AMERICAN LANGUAGE HUB_Level2_Student'sBook_Answerkey.pdf
AMERICAN LANGUAGE HUB_Level2_Student'sBook_Answerkey.pdfAMERICAN LANGUAGE HUB_Level2_Student'sBook_Answerkey.pdf
AMERICAN LANGUAGE HUB_Level2_Student'sBook_Answerkey.pdf
 
Science 7 Quarter 4 Module 2: Natural Resources.pptx
Science 7 Quarter 4 Module 2: Natural Resources.pptxScience 7 Quarter 4 Module 2: Natural Resources.pptx
Science 7 Quarter 4 Module 2: Natural Resources.pptx
 
AUDIENCE THEORY -CULTIVATION THEORY - GERBNER.pptx
AUDIENCE THEORY -CULTIVATION THEORY -  GERBNER.pptxAUDIENCE THEORY -CULTIVATION THEORY -  GERBNER.pptx
AUDIENCE THEORY -CULTIVATION THEORY - GERBNER.pptx
 
FINALS_OF_LEFT_ON_C'N_EL_DORADO_2024.pptx
FINALS_OF_LEFT_ON_C'N_EL_DORADO_2024.pptxFINALS_OF_LEFT_ON_C'N_EL_DORADO_2024.pptx
FINALS_OF_LEFT_ON_C'N_EL_DORADO_2024.pptx
 
Barangay Council for the Protection of Children (BCPC) Orientation.pptx
Barangay Council for the Protection of Children (BCPC) Orientation.pptxBarangay Council for the Protection of Children (BCPC) Orientation.pptx
Barangay Council for the Protection of Children (BCPC) Orientation.pptx
 
Choosing the Right CBSE School A Comprehensive Guide for Parents
Choosing the Right CBSE School A Comprehensive Guide for ParentsChoosing the Right CBSE School A Comprehensive Guide for Parents
Choosing the Right CBSE School A Comprehensive Guide for Parents
 
ECONOMIC CONTEXT - PAPER 1 Q3: NEWSPAPERS.pptx
ECONOMIC CONTEXT - PAPER 1 Q3: NEWSPAPERS.pptxECONOMIC CONTEXT - PAPER 1 Q3: NEWSPAPERS.pptx
ECONOMIC CONTEXT - PAPER 1 Q3: NEWSPAPERS.pptx
 
THEORIES OF ORGANIZATION-PUBLIC ADMINISTRATION
THEORIES OF ORGANIZATION-PUBLIC ADMINISTRATIONTHEORIES OF ORGANIZATION-PUBLIC ADMINISTRATION
THEORIES OF ORGANIZATION-PUBLIC ADMINISTRATION
 

Food Miles: Background and Marketing

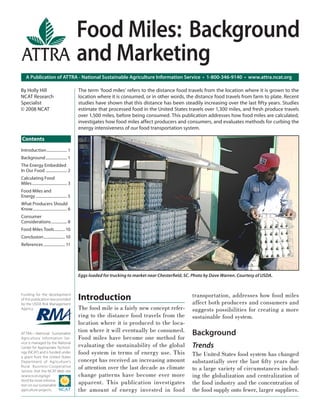
  • 1. Food Miles: Background and Marketing A Publication of ATTRA - National Sustainable Agriculture Information Service • 1-800-346-9140 • www.attra.ncat.org By Holly Hill The term ‘food miles’ refers to the distance food travels from the location where it is grown to the NCAT Research location where it is consumed, or in other words, the distance food travels from farm to plate. Recent Specialist studies have shown that this distance has been steadily increasing over the last fifty years. Studies © 2008 NCAT estimate that processed food in the United States travels over 1,300 miles, and fresh produce travels over 1,500 miles, before being consumed. This publication addresses how food miles are calculated, investigates how food miles affect producers and consumers, and evaluates methods for curbing the energy intensiveness of our food transportation system. Contents Introduction ..................... 1 Background ...................... 1 The Energy Embedded In Our Food ...................... 2 Calculating Food Miles .................................... 3 Food Miles and Energy ................................ 5 What Producers Should Know ................................... 6 Consumer Considerations ................ 8 Food Miles Tools ........... 10 Conclusion ...................... 10 References ...................... 11 Eggs loaded for trucking to market near Chesterfield, SC. Photo by Dave Warren. Courtesy of USDA. Funding for the development Introduction transportation, addresses how food miles of this publication was provided by the USDA Risk Management affect both producers and consumers and Agency. The food mile is a fairly new concept refer- suggests possibilities for creating a more ring to the distance food travels from the sustainable food system. location where it is produced to the loca- ATTRA—National Sustainable tion where it will eventually be consumed. Background Agriculture Information Ser- Food miles have become one method for vice is managed by the National Center for Appropriate Technol- evaluating the sustainability of the global Trends ogy (NCAT) and is funded under food system in terms of energy use. This The United States food system has changed a grant from the United States Department of Agriculture’s concept has received an increasing amount substantially over the last fi fty years due Rural Business- Cooperative Service. Visit the NCAT Web site of attention over the last decade as climate to a large variety of circumstances includ- (www.ncat.org/agri. change patterns have become ever more ing the globalization and centralization of html) for more informa- tion on our sustainable apparent. This publication investigates the food industry and the concentration of agriculture projects. the amount of energy invested in food the food supply onto fewer, larger suppliers.
  • 2. A report released in 1998 by the USDA system analysts, has its price. The farther found that 80% of the meat industry is con- food travels and the longer it takes en trolled by only four fi rms.(1) In his essay route to the consumer, the more freshness entitled “Food Democracy,” Brian Halweil declines and the more nutrients are lost. states that half of the food items in a typical Many fruits and vegetables are engineered supermarket are produced by no more than for a long shelf life, sacrificing taste and 10 multinational food and beverage com- nutrition for preservation. panies.(2) The majority of food consumed today passes through a complex, indirect As large multinational companies gain con- network of a few large, centralized produc- trol over the food industry, small local farm- ers, processors, transporters and distribu- ers suffer. Since 1979, 300,000 farmers tors before reaching the consumer. have gone out of business and those remain- ing are receiving 13% less for every con- An additional change in the food system is sumer dollar for farm goods.(1) Large dis- the increasing trend of these multinational tributors are able to drive prices down on firms sourcing food from outside of regional, imported goods, forcing many small farms state and even national boundaries in order to either export their crop as a raw com- to provide consistent products at low prices. modity or replace regional crops with some- Figure 1 illustrates the steady increase in thing more profitable. For example, in 1870 world agricultural trade between 1961 and 2000.(3) 100% of the apples consumed in Iowa were produced in Iowa. By 1999, Iowa farmers grew only 15% of the apples consumed Fig. 1: Volume of World Agricultural Trade, 1961-2000. Source: Brian Halweil. Home in the state.(4) This phenomenon limits Grown: The Case for Local Food in a Global Market. 2002. the potential for local self-sufficiency and increases dependency on outside sources. Changes in the food system have resulted in a broad range of social and economic impli- cations, but the present food system also has an environmental cost. The farther food travels, the more fossil fuels are required for transport. The burning of fossil fuels leads to the emission of greenhouse gases, which contribute to global warming. The fol- lowing sections will investigate the extent to which food miles contribute to high energy consumption levels and CO2 emissions. The Energy Embedded in Our Food The Carbon Footprint of the The development of global food transport Food System systems has resulted in higher consumer While studies vary, a typical estimate is expectations. Consumers now have the abil- that the food industry accounts for 10% of ity to choose from a wide variety of food all fossil fuel use in the United States.(5) items, regardless of the season or their loca- Of all the energy consumed by the food sys- tion, all at a low price. tem, only about 20% goes towards produc- The ability to enjoy consistent produce and tion; the remaining 80% is associated with exotic ingredients at all times of the year processing, transport, home refrigeration is a luxury that, according to many food and preparation. Page 2 ATTRA Food Miles: Background and Marketing
  • 3. Recent research at the University of Chicago Fig. 2: Transportation accounts for 14% of energy use within the food system. Source: has investigated the energy consumption Heller and Keoleian. Life Cycle-Based Sustainability Indicators for Assessment of the U.S. of the food system and compared it to the Food System. 2000. energy consumption associated with per- sonal transportation in the United States. Personal transportation is often recog- nized as a major contributor to greenhouse gas emissions, as evident in the movement towards higher efficiency vehicles. This study found, however, that the average American uses between 170 and 680 mil- lion BTUs of energy in personal transpor- tation annually and roughly 400 million BTUs in food consumption.(6) The food industry accounts for a considerable portion of energy consumption in the United States and merits closer evaluation. 2,000 miles to reach the Chicago market. The average distance traveled amounted According to one study, food transportation to 1,518 miles.(9) Figure 3 (next page) accounts for 14% of energy use within the shows the distance that select produce items food system. Figure 2 demonstrates the traveled before reaching their destination at energy use required for each step of the food the Chicago Terminal Market. industry process.(7) Food miles, although Related ATTRA a fraction of the U.S. energy consumption Another study conducted in the Waterloo Publications as a whole, remain a considerable source of Region of Southwestern Ontario investigated carbon emissions, especially when consider- the food miles associated with 58 commonly Bringing Local Food ing that the United States is the single larg- eaten, imported foods. The study found to Local Institutions: est emitter of greenhouse gases in the world, that each food item traveled an average of A Resource Guide for accounting for 23% of the global total at 4,497 kilometers or 2,811 miles, producing Farm-to-School and nearly 1,600 million metric tons annually. 51,709 tons of greenhouse gas emissions Farm-to-Institution Programs The U.S. food system alone uses as much annually.(10) energy as France’s total annual energy Community-Supported These calculated distances don’t include the Agriculture consumption.(8) distance consumers travel to shop for food or the distance that waste food travels to be Direct Marketing Calculating Food Miles disposed of. It is apparent that food is trav- Farmers’ Markets eling long distances, but the extent to which How Far Does Food Travel? food miles have an effect on the environ- Local Food Directories The Leopold Center for Sustainable Agri- ment is more complex. The following sec- culture has been the leading researcher of tions will cover the formulas used to calcu- food miles in the United States and has con- late food miles and investigate the energy ducted several studies comparing the dis- involved in the transportation of food. tance food travels if it is sourced locally rather than conventionally. A 1998 study How Are Food Miles Calculated? examined the distance that 30 conventional A series of formulas for calculating food fresh produce items traveled to reach the miles has been developed and has become Chicago Terminal Market. widely accepted. Calculating the distance a The Leopold Center found that only two food item has traveled varies in complexity food items, pumpkins and mushrooms, depending on whether the item is made up traveled less than 500 miles. Six food items of a single ingredient or multiple ingredi- including grapes, lettuce, spinach, broccoli, ents and the mode of transportation used to cauliflower and green peas traveled over carry the item. www.attra.ncat.org ATTRA Page 3
  • 4. Average distance by truck to Chicago Terminal Market* # of States % Total formula takes into account both distance supplying from (Continental U.S. only) this item Mexico and the associated greenhouse gas emis- sions for different modes of transportation. Grapes 2,143 miles 1 7 This formula was developed by the non- profit organization LifeCycles, in 2004. Broccoli 2,095 miles 3 3 For detailed information about food miles Asparagus 1,671 miles 5 37 formulas and calculating food miles, see the Leopold Center’s publication, Apples 1,555 miles 8 0 Calculating food miles for a multiple ingredient Sweet food product <www.leopold.iastate.edu/ Corn 813 miles 16 7 pubs/staff/files/foodmiles_030305.pdf> Squash 781 miles Each truck represents 12 43 about 500 miles of distance traveled Mode of Transportation Pumpkins 233 miles 5 0 As suggested by the Weighted Average * Information for this chart is based on the weighted aver- age source distance, a single distance figure that combines production origin to Chicago were estimated by using a city located in the center of each state as the production origin, Emissions Ratio formula, the mode by information on distances from production source to consump- tion or purchase endpoint. For these calculations, USDA Agri- and then calculating a one-way road distance to Chicago using the Internet site Mapquest (mapquest.com). Estimations do which food is transported is an important cultural Marketing Service arrival data for 1998 were used to identify production origin (state or country). Distances from not include distance from the Chicago Terminal Market to point of retail sale. factor when considering the environmental impact of food miles. A food item travel- Fig.3: Distance Produce Traveled to Reach Chicago Market. ing a short distance may produce more CO2 Source: Leopold Center for Sustainable Agriculture than an item with high food miles, depend- ing on how it is transported. The Weighted Average Source Distance (WASD) formula was developed by Annika Figure 4 (below) contains the estimated val- Carlsson-Kanyama in 1997 and takes into ues of energy consumption and greenhouse account the amount of food transported in gas emissions for four different transportation weight and the distance that it travels from modes measured in the UK.(11) Air trans- the place of production to the place of sale. portation is, by far, the most energy intensive Fruits and vegetables and other items consist- means of transporting food and other goods. ing of only one ingredient would utilize the A study released in the UK in 2005 found WASD formula for calculating food miles. A that air transport is the fastest growing ir transpor- The Weighted Total Source Distance mode of food distribution and although tation is, (WTSD) formula was developed by the air transport accounts for only 1% of food by far, the Leopold Center for Sustainable Agriculture transport in the UK, it results in 11% of most energy inten- and accounts for multiple-ingredient foods the country’s CO2 emissions. The UK report sive means of trans- by calculating the weight and distance also estimated that the social and economic porting food and traveled for each ingredi- ent. Foods like f lavored other goods. Fig.4: Energy use and emissions for different modes of freight transport. yogurt, bread, and other Source: Transport for a Sustainable Future: The Case for Europe.(11) processed foods would employ the WTSD formula Rail Water Road Air Primary energy for calculating food miles. consumption 677 423 2,890 15,839 KJ/Tonne-km While both WASD and Specific total emissions WTSD convey an estimate g/Tonne-km of the distance food trav- Carbon dioxide 41.0 30.0 207 1,260 els between the producer and consumer, neither for- Hydrocarbons 0.06 0.04 0.3 2.0 mula addresses greenhouse Volatile Organic 0.08 0.1 1.1 3.0 Compounds gas emissions associated with this distance traveled. Nitrogen oxide 0.2 0.4 3.6 5.5 The Weighted Average Carbon monoxide 0.05 0.12 2.4 1.4 Emissions Ratio (WAER) Page 4 ATTRA Food Miles: Background and Marketing
  • 5. costs of food transport including accidents, Food system Fuel $ value of fuel CO2 emissions Distance noise and congestion amount to over 9 and type of truck Consumption (gal/year) (current 2001 prices*) (lbs./year) traveled (miles) billion British pounds every year or 18 Conventional billion American dollars.(12) semitrailer 368,102 $581,601 8,392,727 2,245,423 Iowa regional 22,005 $35,208 501,714 134,230 semitrailer Food Miles and Energy Iowa regional 43,564 $69,702 993,243 370,289 midsize truck Is Local Food Less Energy Intensive? Iowa local -CSA Proponents of reducing food miles often farmers market small truck (gas) 49,359 $78,974 967,436 848,981 suggest that buying local food will reduce Iowa local insti- the amount of energy involved in the trans- tutional small 88,265 $141,224 1,729,994 1,518,155 truck (gas) portation process, as food sourced locally travels shorter distances. The Leopold Cen- Fig.6: Estimated fuel consumption, CO2 emissions and distance traveled for conven- tional, Iowa-based regional, and Iowa-based local food systems for produce. ter for Sustainable Agriculture has con- Source: Leopold Center for Sustainable Agriculture. ducted several studies that compare the dis- tance traveled by conventional versus local foods. Figure 5 (below), compiled by the from the conventional system used 4 to 17 Leopold Center, compares food miles for times more fuel than the locally sourced local versus conventional produce traveling food and emitted 5 to 17 times more CO2.(4) to Iowa. In all cases, the locally grown food The Leopold Center used this information travels a significantly shorter distance than to estimate the distance, fuel consumption the conventionally sourced food. and CO2 emissions that could potentially be saved by replacing 10% of the Iowa’s current Another study conducted by the Leopold food system with regional or locally sourced Center in 2001 investigated the distance food. This information is displayed in that food traveled to institutional markets Figure 6 (above). It is interesting to note such as hospitals and restaurants in Iowa that when the transportation method was using three different food sources: conven- taken into account, the local food system tional, Iowa-based regional and Iowa-based required more energy and emitted more CO2 local. The study found that food sourced than the regional system. This is because the trucks supplying food locally Fig. 5: Food miles for local versus conventional produce. had a smaller capacity, there- Source: Leopold Center for Sustainable Agriculture. fore requiring more trips and Produce Type Locally grown Conventional Source Estimation logging more miles. WASD (miles) WASD (miles) Apples 61 1,726 It has been shown that local Beans 65 1,313 food systems do reduce food Broccoli 20 1,846 miles, which in turn tend to Cabbage 50 719 reduce energy consumption, Carrots 27 1,838 but there are exceptions. Corn, Sweet 20 1,426 Local transportation systems Garlic 31 1,811 may not always be as efficient Lettuce 43 1,823 as regional systems, depend- Onions 35 1,759 ing on the mode of transport Peppers 44 1,589 and load capacity. Potatoes 75 1,155 Pumpkins 41 311 Does Reducing Spinach 36 1,815 Squash 52 1,277 Food Miles Reduce Strawberries 56 1,830 Energy Use? Tomatoes 60 1,569 A Japanese group, Daichi- WASD -for all produce 56 1,494 o -Mam or u Kai ( T he Sum of all WASDs 716 25,301 Association to Preserve www.attra.ncat.org ATTRA Page 5
  • 6. uses less energy than housing and feeding animals.(14) The UK Department for Environment, Food and Rural Affairs (DEFRA) released a report in 2005, which determined that food miles alone are not a valid indicator of the sustainability of the food system. In some cases, reducing food miles may reduce energy use, but there may be other social, environmental or economic trade-offs. The consequences of food transport are complex and require a group of indicators to deter- mine the global impact of food miles.(13) Life Cycle Assessment Cranberries loaded on truck for shipment. Photo by Earl J. Otis. Courtesy of USDA. There is increasing significance in consid- ering all stages of energy consumption in the Earth) conducted a study that found the food system. Many organizations have that a typical Japanese family could investigated the idea of life-cycle-based reduce their CO2emissions by 300 kilo- analysis to determine the sustainability of grams annually by eating locally.(13) The the food system. Canadian Waterloo Region study men- tioned above estimated that sourcing Life cycle assessment (LCA) is a method the 58 food items in the study locally and used to analyze the consumption and envi- regionally rather than globally could reduce ronmental burdens associated with a prod- greenhouse gas emissions by 49,485 tons uct. LCA takes into account energy input annually. This is the equivalent of removing and output involved in all stages of the life 16,191 vehicles from the road.(11) cycle including production, processing, packaging, transport and retirement. Life The food miles issue becomes even more cycle evaluation accounts for a matrix of complex when considering factors besides sustainability indicators beyond greenhouse distance traveled and mode of transpor- gas emissions, including resource deple- tation. The energy required to grow some tion, air and water pollution, human health foods in unsuitable climates may override impacts and waste generation. This method the energy of transporting food from loca- provides a more holistic approach to assess- tions where the food is more easily grown. ing the impact our food choices have on the For example, a Swedish study found that environment.(7) tomatoes traveling from Spain to Sweden were less energy intensive than tomatoes Life cycle assessments of various conven- raised in Sweden, because of the process by tional food products have found that the which they were grown. The Spanish toma- current food production and consumption toes were raised in the open ground, while patterns are unsustainable.(15) Adopt- the Scandinavian climate required tomatoes ing a “life cycle thinking” approach to to be raised in heated greenhouses utilizing food consumption would be a productive more fossil fuels.(4) method for increasing the sustainability of the food system. A New Zealand report found that export- ing some foods to the UK consumes less energy than producing the same food in What Producers Should Know the UK because the agricultural system in In general, the idea of reducing food miles New Zealand tends to use less fertilizer and is good news for producers. Reducing raises year round grass fed livestock, which energy costs equates to saving money and Page 6 ATTRA Food Miles: Background and Marketing
  • 7. consumers who are reducing food miles help how to join or start a farmers’ market suc- to create local markets. There are many cessfully, see the ATTRA publication, Farm- ways of reducing the energy intensiveness ers’ Markets: Marketing and Business Guide. of your operation. Reducing fuel consump- Community supported agriculture (CSA) tion, maintaining equipment and assess- offers another option for marketing to a ing field practices can have great impacts local or regional clientele. CSAs typically that will both reduce your energy use and have members that are “share-holders” in save you money. The ATTRA Farm Energy the farm, paying for the anticipated costs Web pages contain a host of information of the farm operation. The ATTRA pub- about managing energy-related costs on lication Community Supported Agriculture the farm. You will find links to farm energy contains information about production con- calculators, renewable energy informa- siderations and using the Internet as a means tion and links to food miles resources. of information dissemination to members. For more information visit the Web site at www.attra.ncat.org/energy. The number of farmers’ markets and CSAs has grown substantially over the last decade indicating both the potential of success for L Marketing the farmer and the growing demands of ife cycle For producers, reducing food miles means consumers for fresh, local food. assessment selling products to a more local or regional market. While, this may be an intimidating (LCA) is a prospect for farmers who have no experience Farm-to-Institution Programs method used to ana- with alternative markets, the opportunities Selling food directly to schools, hospitals, lyze the consumption are significant and diverse, including farm- prisons and other institutions is becoming and environmental ers’ markets, CSAs and farm-to-institution an increasingly popular option. Selling food to institutions creates a reliable market for burdens associated programs, all of which are looking for local producers. The following sections briefly the farmer and provides great health and with a product. examine some of the markets and methods economic benefits to the consumer. Farm-to- available for a producer looking to reduce institution programs also reduce food miles. the energy involved in transporting food. The University of Montana’s Farm to College program estimated that replacing a year’s Direct Marketing supply of conventionally sourced hamburgers and French fries with local ingredients saved Direct marketing allows farmers to com- 43,000 gallons of fuel and the associated pete with wholesale market channels and greenhouse gasses from being emitted.(16) mass supermarket systems, thereby creat- For more information about setting up a farm- ing a local food network and reducing the to-institution program in your area, see the distance that food travels. Direct marketing ATTRA publication Bringing Local Foods to networks could include farmers’ markets, Local Institutions: A Resource Guide for Farm- wholesale food terminals and community- to-School and Farm-to-Institution Programs. supported agriculture. The ATTRA publi- cation Direct Marketing offers information about alternative marketing systems, with Ecolabels an emphasis on value-added crops. Ecolabels offer one method for educating consumers about locally grown, sustainably Farmers’ Markets and CSAs raised foods, and have proven effective in product marketing. An ecolabel is a seal or Selling produce at farmers’ markets is one a logo indicating that a product has met a alternative marketing strategy available for certain set of environmental and/or social producers. By removing brokers from the standards or attributes. distribution chain, farmers are able to reap a greater profit. Farmers’ markets also ben- The Leopold Center for Sustainable Agricul- efit community interaction and economic ture has researched the impact that labeling development. For more information about food with ecolabels containing information www.attra.ncat.org ATTRA Page 7
  • 8. such as food miles and CO2 emissions has Consumer Considerations on consumers. The study aimed to deter- mine consumer opinion of locally produced Consumer Demand food and food miles. Surveys found that Producers may question the extent to consumers were more responsive to labels which consumers are using food miles as that focused on the food product’s fresh- a basis for their food choices. In general ness and quality rather than environmen- food choices are no doubt based on price, tal impact or CO2 emissions. Consumers taste and appearance and a large section of perceive that locally grown food is fresher; the public knows and cares little about cli- therefore ecolabels that contain information mate change, especially with regard to food such as “locally grown by family farmers” choices.(19) may be effective in influencing consumer food choices. The study also found that There has been increasing demand for food consumers are willing to pay more for food produced in accordance with ethical and that has low environmental impacts.(17) environmental standards, however, such as Figure 7 is an example of a food label organic and fair trade. Food mile concerns containing food miles information. may grow as well. Increasing food security and the domestic supply chain may be other arguments for reducing food miles. Why Consumers Should Care About Food Miles For consumers, convenience and cost are often driving factors when purchasing food. The choices consumers make, however, can have a great deal of influence on the direc- tion our food system is headed. Reducing the energy intensiveness of our food has several economic, social and environmental benefits. Consumers who are reducing their food mile footprint: • Enjoy fresher, healthier food • Support local farmers • Keep their money in the community • Know where their food comes from Fig. 7: Food miles ecolabel example. Source: Leopold Center for Sustainable Agriculture • Reduce their carbon footprint Diet and Energy The Western Montana Sustainable Grow- Buying local and regional food is just one of ers Union is a group of 12 Missoula-area many dietary choices with important envi- organic farms that has developed the ronmental consequences. The FAO esti- “Homegrown” label, which informs con- mates that livestock are responsible for 18% sumers that the food item they are purchas- of global greenhouse gas emissions.(20) A ing was grown within 150 miles. Producers study at the University of Chicago compared in the group pledge “to grow naturally, pro- the energy consumption associated with tect air and water, maintain fair labor prac- animal-based diets versus plant-based diets tices and, most importantly, to sell and buy and found that consuming a typical Ameri- in their communities.” Groups such as this can diet of both animals and plants results are jumping up across the country and hav- in 1,485 kg more CO2 than a diet based on ing an impact on their markets.(18) plant sources only. Page 8 ATTRA Food Miles: Background and Marketing
  • 9. This study concludes that “For a person natural gas and other fossil fuels, through a consuming a red meat diet at 35% of calo- highly energy-intensive process, eliminating ries from animal sources, the added GHG synthetic fertilizer and pesticides can signifi- burden above that of a plant eater equals cantly reduce the amount of energy required the difference between driving a Camry and for production. However, increased demand an SUV. These results clearly demonstrate for organics has resulted in retailers sourcing the primary effect of one’s dietary choices organically grown food from around the globe, on one’s planetary footprint, an effect com- creating increased emissions in the trans- parable in magnitude to the car one chooses portation process. Some locally grown non- to drive.”(6) organic foods may be less energy intensive than organic foods traveling long distances. Local vs. Organic When evaluating our food options, the deci- There has been a great amount of public sions are complex, especially if you want to interest over the last few years in organic make sustainable choices. Local, organic, food systems. This is an indication of con- fair-trade and other forms of sustainably pro- sumers’ increasing awareness of where their duced food all play a role in creating sustain- food is coming from. Organic food is grown able food consumption patterns. The follow- without synthetic fertilizers or pesticides. ing table provides some guidelines for making Since these chemicals are usually made from ethical food decisions. Reducing Food Miles: What Individuals Can Do • Learn what foods are in season in your area and try to build your diet around them. • Shop at a local farmers’ market. People living in areas without a farmers’ market might try to start one themselves, linking up with interested neighbors and friends and contacting nearby farmers and agricultural officials for help. People can do the same with CSA subscription schemes. • Eat minimally processed, packaged and marketed food. Generally speaking, the less processing and packaging you see, the less energy went into production and marketing, the less global warming pollution was created. • Ask the manager or chef of your favorite restaurant how much of the food on the menu is locally grown, and then encourage him or her to source food locally. Urge that the share be increased. People can do the same at their local supermarket or school cafeteria. • Consolidate trips when grocery shopping. Consider carpooling, public transportation, or a bike trailer for hauling groceries to reduce your personal contribution to food miles. • Take a trip to a local farm to learn what it produces. • Limit the amount of meat you consume and when you do buy meat, look for organic or free-range meat produced on sustainable farms. • Produce a local food directory that lists all the local food sources in your area, including CSA arrangements, farmers’ markets, food co–ops, restaurants emphasizing seasonal cuisine and local produce, and farmers willing to sell direct to consumers year-round. • Buy extra quantities of your favorite fruit or vegetable when it is in season and experiment with drying, canning, jamming, or otherwise preserving it for a later date. • Plant a garden and grow as much of your own food as possible. • Speak to your local politician about forming a local food policy council to help guide decisions that affect the local foodshed. Table 1. What individuals can do to reduce food miles. Adapted from Brian Halweil’s Home Grown: the Case for Local Food in a Global Market. 2002. www.attra.ncat.org ATTRA Page 9
  • 10. Food Miles Tools fruits and vegetables rather than produce from conventional sources outside the state. Life Cycles Food Calculator www.leopold.iastate.edu/research/calculator/ The Life Cycles food calculator deter- home.htm mines the distance and amount of green- house gases saved if a certain food product Conclusion is bought locally as opposed to imported. www.gworks.ca/lcsite/food_directory/?q=food Food miles are a growing cause of con- miles/inventory/add cern due to the greenhouse gas emis- sions released through the transportation Food Carbon Footprint Calculator of our food—and rightly so, as food miles A tool for residents within the UK to consume a considerable amount of energy. calculate their food carbon footprint to However, we must consider the many com- better understand the extent to which food plexities of the food system besides just decisions impact global warming. the distance our food is traveling. Other www.foodcarbon.co.uk important issues include the mode of trans- portation, the production method, and pack- LCA Food Database aging considerations, as well as our own A tool for acquiring an aggregated description personal dietary choices. Each consumer of emissions, waste and the resource use from food decision provides an opportunity to soil to kitchen per unit of different food items. make a difference (large or small) in the www.lcafood.dk way energy is used and greenhouse gases are emitted. At the same time, growing con- Iowa Produce Market Potential Calculator sumer interest in local and regional foods This calculator was designed to help users is creating new marketing opportunities determine expanding markets in Iowa if and new possibilities for partnerships with consumers ate more locally grown fresh agricultural producers. Truck on highway near Petersburg, West Virginia. Photo by Ken Hammond. Courtesy of USDA. Page 10 ATTRA Food Miles: Background and Marketing
  • 11. References 10) Xureb, Marc. 2005. Food Miles: Environmen- tal Implication of Food Imports to Waterloo Region. www.leopold.iastate.edu/research/ 1) United States Department of Agriculture. 1998. A marketing_ files/foodmiles_Canada_1105.pdf Time to Act: A Report on the USDA National 11) Whitlegg, J. 1993. Transport for a Sustainable Future: Commission on Small Farms. www.csrees.usda. The Case for Europe. Bellhaven Press, London. gov/nea/ag_systems/pdfs/time_to_act_1998.pdf 12) Smith, A. et al. 2005. The Validity of Food Miles 2) Halweil, Brian. 2006. Food Democracy: Nourishing as an Indicator of Sustainable Development. a Fundamental Freedom. Heifer International Oxon, United Kingdom: Department of Envi- World Ark. Jan/Feb 2006: 6-13. ronment, Food, and Rural Affairs. www.heifer.org/atf/cf/%7BE384D2DB- http://statistics.defra.gov.uk/esg/reports/ 8638-47F3-A6DB-68BE45A16EDC%7D/ foodmiles/execsumm.pdf ’06%20JAN.FEB%20WORLD%20ARK.PDF 13) Kyodo News. March 2, 2005. Biztrend: 3) Halweil, Brian. 2002. Home Grown: The Case for Consumption of Local Food Helps Cut CO2 Local Food in a Global Market. Emissions. www.farmtotable.org/index.php?cmd www.worldwatch.org/system/files/EWP163.pdf =F2TNews&method=view&id=262 4) Pirog, Rich, et al. 2001. Food Fuel, and Freeways: 14) Saunders, Caroline, et al. 2006. Food Miles Com- An Iowa Perspective on How Far Food Travels, parative Energy/Emissions Performance of Fuel Usage, and Greenhouse Gas Emissions. New Zealand’s Agriculture Industry. Leopold Center for Sustainable Agriculture. www.beehive.govt.nz/Documents/Files/Food%20 www.leopold.iastate.edu/pubs/staff/ppp/food_mil.pdf Miles%20Executive%20Summary.doc 5) Horrigan, Leo, et al. 2002. How Sustainable Agri- 15) Carlsson-Kanyama, Annika. 1998. Climate change and dietary choices – how can emis- culture can Address the Environment and sions of greenhouse gases from food consump- Human Health Harms of Industrial Agricul- tion be reduced? http://seminar.mannlib.cornell. ture. Environmental Health Perspectives. May edu/topics/food_security/resources/FS01.pdf 2002: 445-456. www.ehponline.org/members/ 2002/110p445-456horrigan/EHP110p445PDF.PDF 16) Hassanein, Neva, et al. 2007. Tracing the Chain: An in Depth Look at the University of Mon- 6) Eshel, Gidon and Pamela Martin. 2005. Diet, tana’s Farm to College Program. Energy and Global Warming. University of www.growmontana.ncat.org/docs/tracing_the_ Chicago, Department of Geophysical Sciences. chain_e_summary_new.pdf http://geosci.uchicago.edu/~gidon/papers/nutri/ nutri3.pdf 17) Pirog, Rich, et al. 2003. Ecolabel Value Assessment: Consumer and Food Business 7) Heller, Martin C., and Gregory A. Keoleian. Life Perceptions of Local Foods. www.leopold. Cycle-Based Sustainability Indicators for iastate.edu/pubs/staff/ecolabels/ecolabels.pdf Assessment of the U.S. Food System. Ann 18) Sooter, Tad. 2006. Western Montana Growers Arbor, MI: Center for Sustainable Systems, Go Beyond Organics and Get Local. University of Michigan, 2000: 42. Report No. www.newwest.net/index.php/main/article/ CSS00-04. www.public.iastate.edu/~brummer/ bringing_organics_home/ papers/FoodSystemSustainability.pdf 19) Garnett, T. 2003. Wise moves. Exploring the rela- 8) Murray, Danielle. 2005. Oil and Food: A Ris- tionship between food, road transport and ing Security Challenge. www.earthpolicy.org/ CO2. Transport2000. www.thepep.org/ Updates/2005/Update48.htm ClearingHouse/docfiles/wise_moves.pdf 9) Pirog, Rich. 2002. How Far Do Your Fruit 20) Steinfield, Henning et al. 2006. Livestock’s Long and Vegetables Travel? Leopold Center for Shadow: Environmental issues and options. Sustainable Agriculture. www.leopold.iastate. www.virtualcentre.org/en/library/key_pub/ edu/pubs/staff/ppp/food_chart0402.pdf longshad/A0701E00.pdf www.attra.ncat.org ATTRA Page 11
  • 12. Food Miles: Background and Marketing By Holly Hill NCAT Research Specialist © 2008 NCAT This publication is available on the Web at: www.attra.ncat.org/attra-pub/foodmiles.html or www.attra.ncat.org/attra-pub/PDF/foodmiles.pdf IP312 Slot 311 Version 010708 Page 12 ATTRA