1. Chapter 2: Creating a Project
Chapter 2
Creating a Project
ProjectExplorer is the centralized module for creating, activating, organizing, and modifying
GeoGraphix Discovery projects. Many diverse kinds of data (Well data, Cartographic data, Log data,
Seismic data, Surface data, and Zone data) can be imported into a project using pre-defined import
definitions. Other non-standard data can be imported using direct access to import tools such as the
Spreadsheet importer, or to DefCon2.
This course section is intended to introduce you to the fundamental workings of ProjectExplorer. This
module will also be explored in more detail throughout the course.
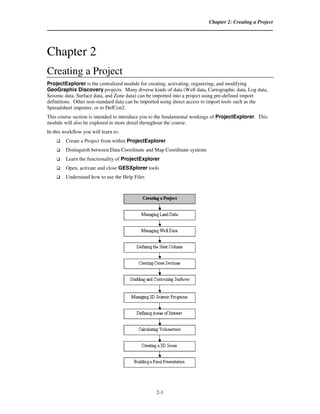
In this workflow you will learn to:
Create a Project from within ProjectExplorer
Distinguish between Data Coordinate and Map Coordinate systems
Learn the functionality of ProjectExplorer
Open, activate and close GESXplorer tools
Understand how to use the Help Files
2-1
2. GESXplorer
Creating a Project Area
1. Activate ProjectExplorer by clicking on the icon at the bottom of
the screen. If ProjectExplorer is not already open, click on the GeoGraphix Discovery icon on
the Desktop, or open it from the Start Menu by clicking on Start >> Programs >> GeoGraphix >>
Discovery >> ProjectExplorer.
Note: The Getting Started Wizard was turned off in the first chapter. If it appears
here, select the Create a new Discovery project radio button, then place a
checkmark in the box for Don’t show this dialog again, and click OK. Proceed to
Step 3 of this exercise.
2. From the ProjectExplorer menu bar, click File >> New >> Project.
The New Project Wizard dialog box will be displayed on the desktop. The new project will be
created through the wizard.
If your system has been configured for Landmark OpenWorks Connect, you will see the Type
dialog box displayed below. If you do not see this dialog box, skip to step 3.
In the New Project Wizard – Type dialog box, select the Create Discovery Project radio button and
click the Next > button.
2-2
3. Chapter 2: Creating a Project
3. On the Folder page, highlight the Projects home folder and click the Next > button.
4. On the Project page type Williston as the name of the new project in the text box.
Note:
Clicking the Help button at the lower left corner of the dialog box can access a
detailed explanation of each page of the New Project Wizard.
5. Accept the defaults and click on the Next command button to proceed to the Define Coordinate
System for Database Storage page.
2-3
4. GESXplorer
The next two dialog boxes allow the user to define the Database Coordinate System and Map Coordinate
System for the project.
The Database Coordinate System reflects how X-Y data are stored within the project.
The Map Coordinate System defines how data on an ellipsoidal solid (the earth) will be projected onto a
flat piece of paper (a map).
The Database Coordinate System defines how data will be stored within GESXplorer and reflects how the
data was recorded. For example, in the United States, location information is recorded most commonly in
State Planar coordinates, Universal Transverse Mercator (UTM) coordinates, or latitude/longitude.
Selecting a Database Coordinate System allows GESXplorer to store all location data using the same
coordinates. Information recorded in any coordinate system may be imported into the project, and will be
converted to the Database Coordinate System defined for that project. Once the Database Coordinate
System is defined for a project, it cannot be changed.
The Map coordinate System defines the map projection to be used to display the data. The projection can
be changed at any time while working in the GESXplorer project. Common map projections include
Conic and Mercator.
A conic projection displays features on the earth as if they were projected onto a piece of paper that was
wrapped into a cone shape and placed on top of the earth, or holds the earth, like an ice cream cone. Conic
projections display true scale lines in the east-west direction, and therefore work well for displaying
features or regions that are longer in the east-west direction than the north-south direction.
A Mercator projection displays features on the earth’s surface in map view as if the map were wrapped
around the Earth in a cylindrical shape, with the open ends of the cylinder directly over the poles. A
transverse Mercator projection tips the cylinder 90 degrees so that the open ends of the cylinder are over
the Equator. One of the most common projection systems is the Universal Transverse Mercator (UTM).
The UTM projection divides the earth into six-degree wide zones of longitude, each of which are displayed
in transverse Mercator projections. In each UTM zone worldwide, X and Y coordinates are measured in
metric units except for certain areas along the U.S. gulf coast. Within each zone, X and Y coordinates are
2-4
5. Chapter 2: Creating a Project
measured from a central meridian and the equator and are assigned a false easting (500 km) and a false
northing (10,000 km) to ensure positive numbers. This projection works well for features or zones that are
longer in the north/south direction, because the true scale lines are north/south.
The State Plane Coordinate System is a hybrid system developed by the U.S. Coast and Geodetic Survey.
It divides each state into separate zones, and it uses a transverse Mercator or a Lambert Conformal Conic
projection depending on whether the zone has an east/west or north/south orientation.
The selection of a database coordinate system or map projection also involves choosing a Datum, which
fixes a mathematical model (an ellipsoid) that approximates the shape of the Earth in a particular region,
with a reference point on the Earth. Latitudes, longitudes, and coordinate systems (UTM, State Plane, etc.)
are all measured with respect to a datum, or more precisely, to the origin of the datum’s reference ellipsoid.
Since Aristotle made the first estimates of the earth’s size, hundreds of datums (ellipsoids and reference
points) through time have been surveyed around the globe. Each continent has its own unique set of
Datums, and the Datum selections can vary in different Regions. The two most common Datums for the
United States are the NAD 1927 (with a reference point at Meades Ranch, Kansas), and the NAD 1983,
(with a reference point at the Earth’s center of gravity). It is important to use the proper datum when
referencing locations on the Earth’s surface because a single point can have multiple X and Y values
depending on the datum. Using the wrong datum can result in location inaccuracies in excess of 100
meters in certain areas.
6. With the New Project Wizard - Define Coordinate System for Database Storage page
active, place the cursor over the word Region to retrieve tips and helpful information as shown below.
By placing the cursor over various selections within GESXplorer, tips and helpful information can
commonly be retrieved.
2-5
6. GESXplorer
7. For the Williston Project, make the following selections for the Coordinate System for
Database Storage:
Region: World >> North America >> United States
System: Geographic Latitude/Longitude
Datum: NAD 1927– North American Datum of 1927 (Mean)
Area: Selection will automatically be filled in.
Hemisphere: Selection will automatically be filled in
2-6
7. Chapter 2: Creating a Project
8. Click Next. The New Project Wizard - Define Coordinate System for Map Display dialog
box will appear on the desktop.
9. Define the Coordinate System for the Map Display as follows:
Region: World >> North America >> United States
System: Universal Transverse Mercator
Zone: 13: 108W-102 W Longitude
Datum: NAD 1927– North American Datum of 1927 (Mean)
Area: selection will be automatically filled in.
2-7
9. Chapter 2: Creating a Project
11. If the project extents are known, they may be entered manually on this screen. Project extents need not
be entered, however, as they will automatically be set by the data extents imported into the project.
Click Finish to complete the creation of the project Williston. A progress bar will monitor the
project’s creation.
When the project has been created, the main ProjectExplorer window appears with the new project
automatically activated. The name of the active project appears in the ProjectExplorer window Title
Bar. The active project is highlighted with a yellow arrow in the left pane of the ProjectExplorer
window.
12. Leave ProjectExplorer open. It will be used for the next task.
2-9
10. GESXplorer
Working with ProjectExplorer
ProjectExplorer manages the projects and their layers built in GESXplorer. Projects are listed in the
directory tree on the left half of the window (the left pane), and the directories and files associated with the
highlighted project are listed on the right half of the window (the right pane). Areas of Interest are listed
under the project on the left pane. Layers are specific to the active Area of Interest when they are created
and will be listed on the right pane when the Area of Interest is highlighted on the left pane. Layers created
for the entire project will be listed on the right pane when Global is highlighted on the left pane. Certain
project properties can be edited from within ProjectExplorer. In addition, all other GESXplorer
applications can be accessed from icons on the GeoGraphix Toolbar on the right side of the ProjectExplorer
window or through Tools >> GeoGraphix. Other Toolbar buttons allow the user to create a new project,
activate a project, edit project properties, or delete selected items, such as layers or saved map files.
Although data can be easily imported through the individual modules, several types of data including
cultural/landgrid, lease information, log curves, IsoMap surfaces, certain types of seismic data, and well
information can be imported directly from ProjectExplorer. This central location for data import
facilitates the project creation process.
1. Place the cursor on any Toolbar button and
observe the help tips displayed at the bottom of the window and below the cursor. This behavior is
present in all GESXplorer applications.
2. Highlight the project name Williston and right-click to obtain a drop-down menu. Click on
Properties to produce the Project Properties dialog box. This dialog box may also be accessed
through the Discovery Properties button on the toolbar or through File >> Properties.
2-10
11. Chapter 2: Creating a Project
The Project Properties dialog box contains tabbed pages for Database Coordinate System,
Map Coordinate System, Extents, Users, Project Server, Folder, and Author. Information
about the project can be obtained and certain fields may be edited through the Project Properties
dialog box. The Database Coordinate System, the Author, and certain fields on the Project
Server pages are grayed out, meaning the information can be viewed but not changed.
3. Click on the Database Coordinate System tab.
4. Verify that the database coordinate system is set to GeoGraphic Latitude/Longitude. If the coordinate
system is incorrect, you will have to go back and create a new Williston2 project.
5. Click on the Map Display Coordinate System tab.
6. Verify that the map display coordinate system is set to Universal Transverse Mercator Zone 13. If the
coordinate system is incorrect, you may correct it at this time.
7. After viewing the data, click OK to close the Project Properties dialog box. Leave
ProjectExplorer open. It will be used to open other GESXplorer tools.
2-11
12. GESXplorer
Opening/Activating GESXplorer Tools
1. Open the LandNet tool/application by clicking on the LandNet icon in the GeoGraphix
application toolbar in the vertical column on the right hand side of the ProjectExplorer window.
2. The LandNet application window appears on the desktop.
Observe that the GeoGraphix application toolbar is available again on the right hand side of the
LandNet application window. Clicking on these buttons will open other chosen GeoGraphix
tools/applications.
3. GeoGraphix applications can also be opened from the Start menu through Start >> Programs >>
GeoGraphix >> Discovery. Using either of the two methods to open applications, open
ZoneManager , XSection , and WellBase (click OK to any message boxes that
may appear).
2-12
13. Chapter 2: Creating a Project
4. The active tool displays a blue title bar. Tools can be activated by clicking on the desired window or
by clicking on the desired icon listed at the bottom of the screen.
5. Minimize the LandNet, XSection, ZoneManager and WellBase tools by clicking on the
Minimize button in the upper right corner of each window.
6. The ProjectExplorer window should be active. If LandNet is the desired tool, click on the
LandNet – Williston icon bar at the bottom of the computer screen to display LandNet.
7. The LandNet window is brought to the top of the overlapping windows on the screen. Any of the
GESXplorer tools can be activated by clicking on the icon on the taskbar bar at the bottom of the
computer screen.
8. An alternate method of activating tools involves “Hot Keys”. Hold down the Alt key and press the
Tab key repeatedly to scroll through a list of GESXplorer tools.
9. Release the Alt key when WellBase Information Manager – Williston appears. The WellBase
window is activated. Keep WellBase open. The WellBase Help files will be explored in the next
task.
2-13
14. GESXplorer
Using the Help Files
The GeoGraphix Help Files are a very useful resource. Vast amounts of detailed descriptions and
explanations along with several “how to” examples and workflows are included in the help files for each
application.
Many applications now contain Context-Sensitive Help where clicking a Help button on a dialog box
opens a help topic specific to that dialog box. The Context Sensitive Help topics typically contain links to
other pertinent topics and help files.
Selecting Help from the menu bar in any application will access information about that particular
application. Applying the Search function while in help files for a particular application will search only
the help topics indexed for that application. However, utilizing the Other Discovery Help Files topic
found in the Table of Contents of any Help file or Help >> Search All Help Files in any application
menu bar can access the help files for any other GeoGraphix Discovery application.
This section of the course is intended to introduce users to the powerful capabilities of the GeoGraphix
Help system.
1. In WellBase, select Help >> WellBase Contents.
2. The WellBase Help dialog box opens to the Contents tab listing the help topics on the left and an
introductory discussion of WellBase on the right. Notice that the words WellBase 8.0 Help appear
on top of the discussion in the right pane as a reminder that all information accessed through this
dialog box pertains to the current version of the WellBase application.
2-14
15. Chapter 2: Creating a Project
3. Scroll to the bottom of the discussion in the right pane. A discussion of how to use the Help files can
be accessed in every GESXplorer application Help dialog box by clicking on the green arrow at the
bottom of the introductory page.
4. Click once on the Index tab. In the left pane scroll down and double click the help-open other
Discovery help files from the list.
5. Scroll down the list of applications listed in the right pane and click on the ProjectExplorer icon just
to the left of the Open PROJECTEXPLORER Help Files text. The ProjectExplorer Help
window appears on the desktop.
2-15
16. GESXplorer
6. Click the Search tab in the left pane of the ProjectExplorer Help window.
2-16
17. Chapter 2: Creating a Project
7. In the Type in the word(s) to search for list box type WellBase, then press the Enter key. A list
of 34 Titles from the ProjectExplorer help files appears ranked according to frequency of detection of
the search word (i.e. rank 1 detected the search word the most times, rank 34 detected it the least
number of times).
8. Details for any of the listed topics can be viewed in the right pane by selecting the desired Title and
clicking the Display button. In the Type in the word(s) to search for list box place your cursor
to the right of the currently selected word WellBase and click once to de-select it. Click on the
arrow next to the Type in the word(s) to search for list box and select AND, then type data
manager in the list box.
2-17
18. GESXplorer
9. Click the List Topics button. The topics list is reduced to 11 items. Click on any Title, then click on
the Display button to view the details in the right pane.
10. Click the Index tab in the left window and scroll down to Help-Search All Help Files then double-
click.
2-18
19. Chapter 2: Creating a Project
11. In the right pane, click Search All Help Files. Merged help files can also be accessed from the
menu bar in any application by selecting Help >> Search All Help Files.
12. On the Search tab in the left pane type Raster Logs in the Type in the word(s) to search for list
box.
13. Click the List Topics button. The search reveals 96 topics.
2-19
20. GESXplorer
14. In the Select topic list box click the Location column title to determine which help files describe
raster Log topics.
15. Click the check box next to Search previous results and in the Type in the word(s) to search
for dialog box type Import.
Click the List Topics button. The list of topics has been reduced to 37.
2-20
21. Chapter 2: Creating a Project
16. In the Select topic list box double-click on Displaying Raster Logs. Detailed information and
instructions on displaying raster logs in XSection is shown in the right pane.
17. Close all Help Files. They will not be needed in the next task. Access the Help files at any time
during this course to obtain information and clarification on the subjects covered.
2-21
22. GESXplorer
Closing Any Tool
The following three methods can be used to close any GESXplorer tool.
1. Activate ZoneManager. From the menu bar select File >> Exit.
2. Activate XSection. Press the Alt key and the F4 key simultaneously to close the application.
3. Activate WellBase. Close the application by clicking the close button in the upper right
corner of the window.
4. Leave ProjectExplorer and LandNet open for use in the next task.
2-22