What is the the age structure in your local area?
•
0 j'aime•204 vues

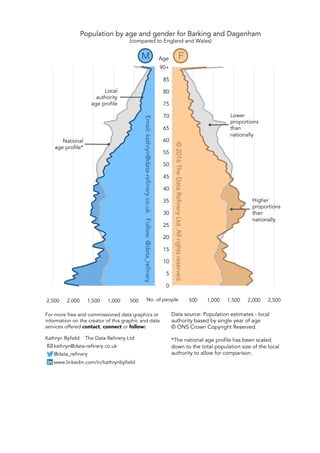
Sample population by age data graphic (Barking and Dagenham). I am offering a free graphic for every local authority area in the UK. The graphic shows population by age and gender (sample shown below). Contact me to order a free one for your area.
Recommandé

Recommandé
Contenu connexe
En vedette
En vedette (9)
Similaire à What is the the age structure in your local area?
Similaire à What is the the age structure in your local area? (7)
Dernier
Dernier (20)
What is the the age structure in your local area?
- 1. -2,500 -2,000 -1,500 -1,000 -500 - - 500 1,000 1,500 2,000 2,500 90+ 85 80 75 70 65 60 55 50 45 40 35 30 25 20 15 10 5 0 ©2016TheDataRefineryLtd.Allrightsreserved. Email:kathryn@data-refinery.co.ukFollow:@data_refinery M FAge Population by age and gender for Barking and Dagenham (compared to England and Wales) National age profile* Lower proportions than nationally Higher proportions than nationally Local authority age profile Data source: Population estimates - local authority based by single year of age © ONS Crown Copyright Reserved. *The national age profile has been scaled down to the total population size of the local authority to allow for comparison. For more free and commissioned data graphics or information on the creator of this graphic and data services offered contact, connect or follow: Kathryn Byfield The Data Refinery Ltd kathryn@data-refinery.co.uk @data_refinery www.linkedin.com/in/kathrynbyfield No. of people