1. 1
Thesis & Recommendation Summary
Key Investment Driver #2
Key Investment Driver #3
Catalent is the global leader in the Drug Development
and manufacturing industry. Their client position allows
the company to gain significantly from the sector growth
Unparalleled Business Strategy leading to increased
demand and contracts from leading life sciences
companies, resulting in long-term stable and growing
revenues
As the global industry leader, Catalent maintains this
status through innovation. They have developed
proprietary solutions and hold around 1,300 patents,
allowing them to gain in their industry through size and
revenue
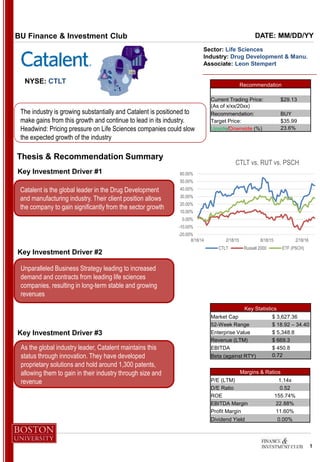
DATE: MM/DD/YY
NYSE: CTLT
Sector: Life Sciences
Industry: Drug Development & Manu.
Associate: Leon Stempert
BU Finance & Investment Club
The industry is growing substantially and Catalent is positioned to
make gains from this growth and continue to lead in its industry.
Headwind: Pricing pressure on Life Sciences companies could slow
the expected growth of the industry
Key Statistics
Market Cap $ 3,627.36
52-Week Range $ 18.92 – 34.40
Enterprise Value $ 5,348.8
Revenue (LTM) $ 669.3
EBITDA $ 450.8
Beta (against RTY) 0.72
Margins & Ratios
P/E (LTM) 1.14x
D/E Ratio 0.52
ROE 155.74%
EBITDA Margin 22.88%
Profit Margin 11.60%
Dividend Yield 0.00%
Recommendation
Current Trading Price: $29.13
(As of x/xx/20xx)
Recommendation: BUY
Target Price: $35.99
Upside/Downside (%) 23.6%
-20.00%
-10.00%
0.00%
10.00%
20.00%
30.00%
40.00%
50.00%
60.00%
8/18/14 2/18/15 8/18/15 2/18/16
CTLT vs. RUT vs. PSCH
CTLT Russell 2000 ETF (PSCH)
Key Investment Driver #1
2. 2
INDUSTRY TRENDS & PRIMARY RESEARCH
INDUSTRY OVERVIEW
DATE: MM/DD/YY
Development and Manufacturing: Biosimilar Drug, Etc.
This industry group consists of companies that either discovers,
develop, or manufacture chemically based therapeutic and
preventive medicine, and medicinal products. Companies
included in this industry tend to collaborate with other
pharmaceutical companies
Industry Definition
BU Finance & Investment Club
Overview: Growth in Life Sciences companies are driven by a healthy economy, growing GDP and Global
Healthcare Spending. Factors: Aging Population, Rising Consumer Wealth (Emerging Countries), Proliferation
in chronic diseases (Longer life expectancies, etc.)
Growth: Most sub-industries are expected to grow by 6-10% each year through 2020, and Increased
Acquisitions in the entire sector
Industry Characteristics: High R&D Costs, high capital intense, High Entry Barrier, Medium Competition (On
Focused Researches)
Industry Summary
Growth by Segment:
Pharma Segment sales have slowed in certain global
markets, but are expected to maintain 6-8% to 2020
Biotech sales are expected CAGR of 9.02% through
2020
Generics and biosimilars Segment is expected to grow at
a CAGR of 10.03% through 2017
All other Life Sciences sub-industries are expected to
grow within 6-10%
Growth Drivers: Increased trend towards Universal
healthcare policies (Global Trend), Aging Population
Impact on Company: Catalent end consumers are top
pharmaceutical, Biotech, Generics, biosimilars, and
Medtech companies. Which each segment in high
growth stage, Catalent stands to gain and grow in the
long-term
Trend #1: Optimistic Sector Growth
1831
1587
1398
2408
402
Revenue of Peer Group ($mm)
Catalent ICON Charles River PAREXEL AMRI
$0.00
$1,000.00
$2,000.00
$3,000.00
$4,000.00
2016 2017 2018 2019 2020
Expected High Growth Revenues
3. 3
INDUSTRY TRENDS & PRIMARY RESEARCH
DATE: MM/DD/YYBU Finance & Investment Club
Outlook: M&A has been increasing in this sector over the years. Deal value in 2014 was $351 billion, a 113
percent growth rate from 2013. The first half of 2015 saw 304 pharma deals valued at $221 billion, compared
$62 billion same period 2014.
Key Drivers: Pricing Pressure; strengthening existing product portfolios; replenishing pipelines depleted by
patent expiry; deepening capabilities in priority areas, entering and/or emerging markets, and acquiring
innovative technologies to leverage current assets or generate cost-saving synergies
Impact on Company: Catalent has a unique business model that focuses on development, delivery, and
supply. This makes the company look like a promising acquisition target. This activity also indirectly affects the
company positively through stronger customers that are growing.
Trend #3 Changing Demographics & Policy
Changing Factors: Aging Population, Growing
Prevalence of Chronic Diseases, Rising consumer
wealth, and Universal healthcare programs
Outcome: These factors are expected to boost
healthcare spending and demand for life sciences
products in 2016+
Impact on Company: Catalent supplies drug
products to pharma's and ultimately the consumers.
This changing environment will positively affect the
sales of its services through increased healthcare
spending/demand.
Trend #2: M&A and Collaborations
0
200
400
600
800
1000
1200
(inthousands)
Aging Population (Census Report)
0
10000
20000
30000
40000
50000
60000
2015
2016
2017
2018
2019
2020
2021
2022
2023
2024
2025
2026
2027
2028
2029
2030
(Inthousands)
Noncommunicable Diseases (NCD)
4. 4
COMPANY OVERVIEW
DATE: MM/DD/YYBU Finance & Investment Club
Catalent offers a range of life sciences services. From drug and biologic development services to delivery
technologies to supply solutions. With over 80 years of experience, Catalent has the deepest expertise, the
broadest offerings, and the most innovative technologies to help Life Sciences companies get more molecules to
market faster, enhance product performance, and provide superior, reliable manufacturing results.
Business Overview
Drug Development & Formulation Services: With our
broad range of expert services, we drive faster, more
efficient development timelines and produce better
products (Biologics Cell Line, Formulation, Solid State
Services, Etc.)
Drug Delivery Technologies: Offers better treatments and
more value for patients, payers, and innovators with our
innovative delivery technologies and dose forms. (Versatile
SOFTGEL Solutions, Controlled Release, Inhalation,
Injectable, and Oral Fast Dissolve)
Supply Services: Offers global, reliable supply from our
world-class manufacturing and supply network and
integrated solutions
Core Products & Services
ICON is a global provider of outsourced development services to the pharmaceutical, biotechnology and
medical device industries.
Charles River Laboratories International, Inc. is an early-stage contract research company, which provides
essential products and services to help pharmaceutical and biotechnology companies, government agencies
and academic institutions around the globe to accelerate their research and drug development efforts
PAREXEL International Corp. is a biopharmaceutical services company. It provides clinical research, medical
communications, consulting, commercialization and informatics, and technology services to pharmaceutical,
biotechnology, and medical device industries
Albany Molecular Research, Inc. engages in research and manufacturing organization providing customers
drug discovery, development, and manufacturing services.
Competitors & Competitive Positioning
274.00
314.00
354.00
388.00 413.00 432.00 443.00
2009 2010 2011 2012 2013 2014 2015
Adjusted EBITDA
5. 5
COMPANY OVERVIEW
DATE: MM/DD/YYBU Finance & Investment Club
Catalent generates its revenues through three main segments. Development and Clinical Solutions, Medication
Deliveries Solutions, and Oral Technologies.
Revenue Generation
Finished Product/Service Back to
Company
Drug Manufacturing
Supplies
Pharmaceutical
Raw Material
Supplies
Performed by
Industry Firms
Outsourced
$$$
Drug
Development
& Formulation
Services
Drug Delivery
Technologies
Supply &
Supply
Management
Services
Biotech Companies
Pharmaceutical &
Biopharmaceutical
companies
Generics &
Biosimilar
Companies
$0.00
$250.00
$500.00
$750.00
$1,000.00
$1,250.00
2012 2013 2014 2015
Historical Segment Revenue
Development and Clinical Solutions Medication Deliveries Solutions
Oral Technologies & Others
$0.00
$400.00
$800.00
$1,200.00
$1,600.00
$2,000.00
$2,400.00
$2,800.00
2011 2012 2013 2014 2015
Total Revenue
6. 6
MANAGEMENT OVERVIEW
DATE: MM/DD/YYBU Finance & Investment Club
Management Profiles
John Chiminski -- Holdings: 363,000 shares – No recent activity
Matthew Walsh – Holdings 88,000 shares – No recent activity
Management Ownership & Insider Trading
John Chiminski, CEO
• More than 30+ Years of Experience in the Industry
• Hired as CEO of Catalent in 2009
• Former CEO of GE Medical Diagnostics from 2007-2009, but with GE for over 20 years
• Masters Degree from Kellogg School of Management; BS and MS in Electrical Engineering
at Purdue University
Matthew Walsh, CFO
• Over 8+ Years of Life Sciences Sector experience
• Hired as CFO of Catalent in 2008
• Former CFO of Escala Group, Inc. (Global Collectibles Network and Precious Metals
Trader)
• MBA from Cornell University; BS in Chemical Engineering at Cornell University
Steve Leonard, SVP - Global Operations
• More than 30+ Years of Experience in the Industry
• Promoted to SVP – Global Operations of Catalent in June of 2009
• Former GM of Global Operations at GE Healthcare’s Medical Diagnostics Business
• BS in Mechanical Engineering at Drexel University
Holding Summary
Institutional Holdings 77.5%
Total number of holders 260
Total shares held 97,605,000
Total value of holdings $2,388,394,350
7. 7
MANAGEMENT OVERVIEW
DATE: MM/DD/YYBU Finance & Investment Club
Exhibit X: Insider Trades Summary
COMPANY TRENDS: INVESTMENT THESES
Thesis: Catalent’s client position exposes it to the
future significant growth expected in the life
sciences sector. As more companies look to cut
cost due to pricing pressure by government and
R&D, this will drive growth of Catalent’s financials
Aggressive investments to expand their sales and
marketing activities has led them to grow their
client accounts.
Client Breakdown:
• 82 of top 100 Branded drug marketers
• 19 of top 20 generic marketers
• 40 of top 50 biologics marketers
• 23 of top 25 consumer health marketers
globally
• Key Customers: Pfizer, J&J, GlaxoSmithKline,
Novartis, Roche, Actavis, and Teva
Investment Thesis #1: Global Leader in Drug Development
0
5
10
15
20
3 Months 6 Months
Number of Shares Bought Number of Shares Sold
-0.02%
0.00%
0.02%
0.04%
0.06%
0.08%
0.10%
0.12%
John (CEO) Matthew (CFO) Khichi Samrat Morel Donald E. JR
Insider Share Change
% Change
233.2
268.3
404.8
412.2
438.8
2011 2012 2013 2014 2015
Drug Development Revenues
8. 8
DATE: MM/DD/YYBU Finance & Investment Club
Investment Thesis #2: Unparalleled Business Model
Investment Thesis #3: Patented Proprietary Solutions
Thesis: Catalent business strategy has gained significant demand leading to increased contracts and contract
revenue.
Catalent has an unrivalled and unique Business Strategy by providing advanced delivery technologies and
development solutions, as well as, supply solutions. These three major solutions allow Catalent to capitalize on
demand from businesses looking to market their products faster and grow their business, while reducing the
cost.
Thesis: Catalent continues to innovate and develop proprietary solutions to sustain a competitive advantage in
the industry.
Currently, they have over 1,300 patents in advanced drug delivery and biologics formulations and technologies,
manufacturing, nutritional and pharmaceutical dosage forms, mammalian cell engineering, sterile
manufacturing services, and others.
Notable Patents: Vegicaps and Optishell capsules, and GPEx Technology
COMPANY TRENDS: INVESTMENT THESES
175.3
268.3
404.8
412.2
438.8
2011 2012 2013 2014 2015
Contract Generated Revenue
19.00%
20.00%
21.00%
22.00%
23.00%
24.00%
25.00%
2011 2012 2013 2014 2015
0.0
100.0
200.0
300.0
400.0
500.0
EBITDA & EBITDA Margins
9. 9
GROWTH OPPORTUNITIES & PROJECTIONS
DATE: MM/DD/YYBU Finance & Investment Club
Revenue Summary & Forecast
Growth as per a proxy for revenue
Revenue is expected to grow with the sector through increased healthcare spending, pricing pressure, and
demand from Pharmaceutical, Biotech, Biosimilar, Generics, Consumers, etc.
175
268
405
412 439 467 499 533
570
610
2011 2012 2013 2014 2015 2016 2017 2018 2019 2020
Drug Development Revenue
224 219 246 262 279
297
317
339
363
2011 2012 2013 2014 2015 2016 2017 2018 2019 2020
Medication Deliveries Revenue
1,203
1,176 1,169
1,130
1,107
1,096 1,096 1,107
1,118
2011 2012 2013 2014 2015 2016 2017 2018 2019 2020
Oral Technologies Revenue
1,532
1,695 1,800
1,828 1,831 1,853 1,892 1,947 2,017 2,092
2011 2012 2013 2014 2015 2016 2017 2018 2019 2020
Total Revenues
10. 10
VALUATION: DISCOUNTED CASH FLOW ANALYSIS
DATE: MM/DD/YYBU Finance & Investment Club
Catalent is a leader in its industry. The industry is expected to grow by ~ 6-10% and Catalent is in the position
to see revenues grow as a result.
Assumptions
WACC Calculation
Risk-Free Rate 1.83%
Equity Risk Premium 6.70%
Size Premium 0.94%
Beta 0.72
Cost of Equity 7.62%
Cost of Debt 2.27%
WACC 5.62%
Historical Forecasted
2012 2013 2014 2015 2016 2017 2018 2019 2020
Revenue Growth 10.6% 6.2% 1.5% 0.2% 1.2% 2.1% 2.9% 3.6% 3.7%
COGS (% of Revenue) 59.42% 59.39% 59.96% 59.43% 58.70% 58.70% 58.70% 58.70% 58.70% 58.70%
EBITDA Growth 2.07% 11.76% 6.97% 2.98% -1.33% 2.08% 2.89% 3.62% 3.71%
EBITDA (% of Revenue) 21.8% 20.10% 21.10% 22.30% 22.90% 22.3% 22.3% 22.3% 22.3% 22.3%
EBIT Growth -1.54% 8.31% 15.70% 5.38% -7.06% 0.86% 1.64% 2.35% 2.42%
EBIT (% of Revenue) 14.0% 12.40% 12.70% 14.40% 15.20% 13.90% 13.80% 13.60% 13.40% 13.30%
NWC 372.2 126.4 162.4 160.1 187.2 204.1 208.4 214.4 222.2 230.4
FCFF Calculation
Forecasted
2016 2017 2018 2019 2020
EBIT $258.38 $260.60 $264.87 $271.09 $277.64
- Taxes $90.43 $91.21 $92.70 $94.88 $97.17
$348.81 $351.81 $357.57 $365.97 $374.81
+ D&A $154.85 $161.24 $169.15 $178.64 $188.76
- CAPEX $196.39 $199.48 $216.46 $235.47 $249.30
- Δ in NWC $16.94 $4.25 $6.01 $7.76 $8.23
Unlevered FCF $290.33 $309.32 $304.24 $301.38 $306.03
Net Present Value $1,285.34
11. 11
VALUATION: DISCOUNTED CASH FLOW ANALYSIS
DATE: MM/DD/YYBU Finance & Investment Club
Terminal Value Calculation
Catalent is about to release its latest fiscal year data in the coming weeks. The data used to calculate the
intrinsic value is a bit stale, however, using the relative value multiple, a more accurate implied price
becomes apparent.
Key Takeaways
DCF Valuation
Growth Rate 2.00%
Undiscounted TEV $ 8,620
Discounted TEV $ 6,558
Implied Exit Multiple 10.20x
Enterprise Value $ 7,843
Equity Value $ 6,122
Implied Share Price $ 49.17
WACC/Growth Rate Price Sensitivity
WACC
$49.17 4% 4.6% 5.1% 5.6% 6.1% 6.6% 7.1% 7.6%
GrowthRate
3.0% $181.03 $121.09 $ 89.47 $ 69.97 $ 56.76 $ 47.23 $ 40.05 $ 34.44
2.5% $123.49 $ 91.26 $ 71.37 $ 57.90 $ 48.19 $ 40.86 $ 35.15 $ 30.57
2.0% $ 93.08 $ 72.80 $ 59.07 $ 49.17 $ 41.70 $ 35.87 $ 31.20 $ 27.39
1.50% $ 74.27 $ 60.27 $ 50.17 $ 42.55 $ 36.61 $ 31.85 $ 27.96 $ 24.73
1.00% $ 61.49 $ 51.19 $ 43.42 $ 37.36 $ 32.51 $ 28.55 $ 25.25 $ 22.47
0.50% $ 52.24 $ 44.32 $ 38.14 $ 33.19 $ 29.15 $ 25.78 $ 22.95 $ 20.52
3.5% $283.42 $178.90 $127.52 $96.96 $76.70 $62.29 $51.51
Valuation Output:
1yr Price Target $ 35.99
Current Price $ 29.13
Upside Potential 23.6%
Recommendation BUY
12. 12
VALUATION: COMPARABLE
COMPANIES ANALYSIS
DATE: MM/DD/YYBU Finance & Investment Club
- Comps Comparable, but not identical. Some comps
have different segments
- More accurate representation of the implied share
price than intrinsic approach
Key Takeaways Name TKR
ICON ICLR
Charles River Labs CRL
PAREXEL PRXL
Albany Molecular Research AMRI
Wide Comparable Companies
Wide CompCo Results
EV/Sales EV/EBITDA
Target 8.0x 11.9x
Max 8.0x 11.9x
Mean 6.1x 10.2x
Median 5.7x 10.0x
Min 4.6x 9.1x
13. 13
DATE: MM/DD/YYBU Finance & Investment Club
VALUATION SUMMARY & RANGE
ANALYSIS
Catalent looks to be positioned to take advantage
of growth in the industry. My price target seems
fairly reasonable. Consider investing into a
company and industry the fund doesn’t have much
exposure to.
Key Takeaways
Methodology Price / Share Weight
Discounted Cash Flow
Perpetuity Growth $16.53 50%
Exit Multiple $25.56 25%
Comparable Company
EV/Sales - Core $16.73 5%
EV/EBITDA $22.35 10%
P/E $19.49 10%
Target Price/Share $35.99
Valuation Summary
>>Income Approach (75%)
• The overall growth expected for the industry is
driving the intrinsic valuation assumptions
>>Market Approach (25%)
• EV/EBITDA more of an appropriate metic for
this industry
• Comps are good comparables, but have other
segments
Assumptions: change weights to fit your
analysis
Valuation Football Field
Make headlines a cause-effect thesis – e.g. “Economies of Scale Driving Industry Consolidation”
Common trends:
Changes in underlying commodity prices because of some supply/demand change
Industry consolidation increasing prices or driving out high-cost competition
Substitute goods driving down demand
Changes in consumer preferences
Cyclical effects – indicate leverage (consider regression) and whether positive or negative correlation
Foreign companies entering market or exporting at lower cost
Changes in supply chain structure, e.g. outsourcing part of the business overseas
Regulatory/legal changes
Expansion/contraction of capacity
Technological changes
Changes in underlying demographics
Geographic expansion
Increasing/decreasing multiple valuations
Aging Population Source: https://www.census.gov/content/dam/Census/library/publications/2016/demo/p95-16-1.pdf
Management Profiles:
Benchmark performance against peer group since took over
Note any significant market cap growth of companies where previously in leadership
Note any improvement in margins, etc. above industry
Note any preference for organic growth vs. acquisitions
Note any preference for debt load
Note capital expenditure habits
Note dividends/share buybacks
Note if manager has outperformed in both good and bad cycles for the industry
Note if there have been any accounting scandals or significant earnings revisions
Note compensation in stock/stock options
Note insider buying/selling as well as flat ownership %’s – high ownership and insider buying highly correlated with performance, especially in the small-cap space
Note: asymmetric in that there are plenty of non-damning reasons to sell but only one reason to buy
Common theses:
Underappreciated changes in fundamentals
Likely acquisition target
Cheap on a relative basis without good reason
Depressed stock price for some reason we do not view as important
Unrecognized valuable asset – real estate, brand name, etc.
Particularly good exposure to a positive trend
Minimal downside due to very low valuation with no BK risk
Pricing does not reflect market commodity pricing
Market commodity pricing does not reflect our expectations
Unlocked value through financial engineering
Strong, steady cash flows with high dividend yield
Massive market size allows company to grow for decades
Superior operating model reduces costs, increases flexibility, etc.
Contractual agreements lock in certain cash flows – low risk
New product poised to deliver market share gains
Geographic expansion offer considerable upside
Soon-to-be-realized estimates of pent-up demand
Historical lows of time-series multiple valuation, should return to average
Etc.
GPEx: Used to develop stable, high-yielding mammalian cell lines for both innovator and bio-similar biologic compounds
Include choice of comps, why, and what benchmark you used (e.g. median, median and mean, regression)
Weighting of comps with resulting target prices