SlideShare une entreprise Scribd logo
1  sur  21
Data Analysis & Interpretation
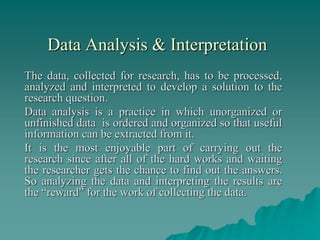
The data, collected for research, has to be processed,
analyzed and interpreted to develop a solution to the
research question.
Data analysis is a practice in which unorganized or
unfinished data is ordered and organized so that useful
information can be extracted from it.
It is the most enjoyable part of carrying out the
research since after all of the hard works and waiting
the researcher gets the chance to find out the answers.
So analyzing the data and interpreting the results are
the “reward” for the work of collecting the data.
Types of Data analysis
Data analysis can be categorized into two:
Descriptive analysis
Inferential analysis
Descriptive analysis
 Descriptive analysis describe the main features of a collection
of data quantitatively
 Provides simple summaries about the sample and the measures
 Descriptive analysis includes the numbers, tables, charts, and
graphs used to describe, organize, summarize, and present raw
data
 Describes the frequency and/or percentage distribution of a
single variable
 Tells how many and what percent
Example:33% of the respondents are male and
67% are female
…….Descriptive analysis
 Descriptive analysis are most often used to examine:
- Central tendency of data, i.e. where data tend to fall,
as measured by the mean, median, and mode.
- Dispersion of data, i.e. how spread out data are, as
measured by the variance and the standard deviation.
- Skew of data, i.e. how concentrated data are at the low
or high end of the scale, as measured by the skew index.
- Kurtosis of data, i.e. how concentrated data are
around a single value, as measured by the kurtosis
index.
Inferential analysis
 Inferential analysis is the process of drawing conclusions from
data that are subject to random variation
 Used to analyze data from randomly selected samples
 Used to try to infer from the sample data what the population
might think
 Risk of error because your sample may be different from the
population as a whole
 To make an inference, you first need to estimate the
probability of that error
…..With descriptive analysis you are simply
describing what is or what the data shows. With
inferential analysis, you are trying to reach
conclusions that extend beyond the immediate data
alone. we use inferential analysis to make judgments
of the probability that an observed difference between
groups is a dependable one or one that might have
happened by chance in this study. Thus, we use
inferential analysis to make inferences from our data
to more general conditions; we use descriptive
analysis simply to describe what's going on in our
data.
Interpretation
 After collecting and analyzing data, the
researcher has to accomplish the task of
drawing inferences. It has to be done
very carefully, otherwise misleading
conclusions may be drawn. It is through
the task of interpretation the researcher
draws inferences from the collected facts.
….Interpretation
Need of Interpretation
 Usefulness and utility of research findings lie in
proper interpretation
 Researcher can well understand the principle
that works beneath his findings
 Leads to the establishment of explanatory
concepts for future research
 Researcher can better appreciate what and why
his findings are..
Tabulation
 Tabulation is the process of arranging data in
systematic manner in the form of rows and
columns.
 Classified data is condensed in the form of a
table so that it may be more easily understood.
 The main objective of tabulation is to
systematize data and make them simple and
comparable.
….Tabulation
Objectives
 To simplify complex data
 To facilitate comparison
 To economize space
 To facilitate statistical analysis
 To facilitate presentation
….Tabulation
The most important thing about a table is
that it should clearly communicate
information. To achieve this there are
certain conventions that must be followed.
 Tables must be clear and easy to read
 Must be ruled or presented as a computer
generated table an of an appropriate size for
the information.
….Tabulation
 Must have a title which describes the data in
the table. This title should be underlined or in
bold type.
 Columns and rows should be clearly headed.
When appropriate the left column or top row
should contain the independent variable and
the bottom row or right column should contain
the dependent variable.
….Tabulation
 Units should be displayed in column / row
headings only.
 Missing values should be displayed as -, and
zeros as 0. Thee should be no blanks in a table
conveying experimental results.
 Numbers should be listed neatly below each
other and should be to the same number of
decimal places.
….Tabulation
Main parts of a table
 Table No.
 Title of table
 Captions
 Stubs
 Body of the table
 Head notes
 Foot notes
 Source note
----Box Head----
----Row
Captions----
------Column Captions-----
---Stub
Entries---
-----The Body-----
Generalization
In research, once the data is
properly arranged using tabulation, it
starts showing some pattern. On the
basis of this pattern, the researcher
may assume about the nature of the
population. The process of making
such assumptions is known as
generalization.
….Generalization
 It is a broad statement about the population based
on provided information, observations and
experiences
 A valid generalization is build on
- supporting facts
- several examples
- past experiences
- logic and reasoning
 For a valid generalization, the sample drawn
should be typical and representative.
….Generalization
Types of Generalization
Valid generalizations
Faulty generalizations
….Generalization
Valid generalizations
 Supported by facts
 Agrees with what you already know about the
topic
 Uses logic and reasoning
 Proven with several examples
….Generalization
Faulty generalizations
 Not supported by facts
 Watch for the key words: none, all, always,
never, everyone, nobody

Contenu connexe

Tendances (20)

Research objective
Research objectiveResearch objective
Research objective
 
Data analysis and Presentation
Data analysis and PresentationData analysis and Presentation
Data analysis and Presentation
 
Sampling techniques and types
Sampling techniques and typesSampling techniques and types
Sampling techniques and types
 
Quantitative Data Analysis
Quantitative Data AnalysisQuantitative Data Analysis
Quantitative Data Analysis
 
Data and its Types
Data and its TypesData and its Types
Data and its Types
 
Data analysis
Data analysisData analysis
Data analysis
 
processng and analysis of data
 processng and analysis of data processng and analysis of data
processng and analysis of data
 
Data
DataData
Data
 
Ppt on research design
Ppt on research designPpt on research design
Ppt on research design
 
Statistical Data Analysis | Data Analysis | Statistics Services | Data Collec...
Statistical Data Analysis | Data Analysis | Statistics Services | Data Collec...Statistical Data Analysis | Data Analysis | Statistics Services | Data Collec...
Statistical Data Analysis | Data Analysis | Statistics Services | Data Collec...
 
Data Interpretation
Data Interpretation Data Interpretation
Data Interpretation
 
Non-Probability sampling
Non-Probability samplingNon-Probability sampling
Non-Probability sampling
 
Methods of data collection
Methods of data collectionMethods of data collection
Methods of data collection
 
Data collection
Data collection Data collection
Data collection
 
Research, Types and objectives of research
Research, Types and objectives of research Research, Types and objectives of research
Research, Types and objectives of research
 
Descriptive statistics
Descriptive statisticsDescriptive statistics
Descriptive statistics
 
Research problem
Research problemResearch problem
Research problem
 
Sampling in research
 Sampling in research Sampling in research
Sampling in research
 
Data analysis
Data analysisData analysis
Data analysis
 
Data analysis and Interpretation
Data analysis and Interpretation Data analysis and Interpretation
Data analysis and Interpretation
 

Similaire à Data analysis & interpretation

probability and statistics-4.pdf
probability and statistics-4.pdfprobability and statistics-4.pdf
probability and statistics-4.pdfhabtamu292245
 
STATISTICAL PROCEDURES (Discriptive Statistics).pptx
STATISTICAL PROCEDURES (Discriptive Statistics).pptxSTATISTICAL PROCEDURES (Discriptive Statistics).pptx
STATISTICAL PROCEDURES (Discriptive Statistics).pptxMuhammadNafees42
 
Research methodology-Research Report
Research methodology-Research ReportResearch methodology-Research Report
Research methodology-Research ReportDrMAlagupriyasafiq
 
Research Methodology-Data Processing
Research Methodology-Data ProcessingResearch Methodology-Data Processing
Research Methodology-Data ProcessingDrMAlagupriyasafiq
 
Data Analysis & Interpretation and Report Writing
Data Analysis & Interpretation and Report WritingData Analysis & Interpretation and Report Writing
Data Analysis & Interpretation and Report WritingSOMASUNDARAM T
 
Statistics for management
Statistics for managementStatistics for management
Statistics for managementJohn Prarthan
 
Assigment 1
Assigment 1Assigment 1
Assigment 1Shaf Fik
 
MELJUN CORTES research designing_research_methodology
MELJUN CORTES research designing_research_methodologyMELJUN CORTES research designing_research_methodology
MELJUN CORTES research designing_research_methodologyMELJUN CORTES
 
Tabulation of data-Development of Research Instrument/ Tool and Analysis
Tabulation of data-Development of Research Instrument/ Tool and Analysis Tabulation of data-Development of Research Instrument/ Tool and Analysis
Tabulation of data-Development of Research Instrument/ Tool and Analysis ShaharyarShoukatShou
 
DATA-PROCESSING.pptx
DATA-PROCESSING.pptxDATA-PROCESSING.pptx
DATA-PROCESSING.pptxMeetHooda
 
EDUCATIONAL STATISTICS_Unit_I.ppt
EDUCATIONAL STATISTICS_Unit_I.pptEDUCATIONAL STATISTICS_Unit_I.ppt
EDUCATIONAL STATISTICS_Unit_I.pptSasi Kumar
 
IDS-Unit-II. bachelor of computer applicatio notes
IDS-Unit-II. bachelor of computer applicatio notesIDS-Unit-II. bachelor of computer applicatio notes
IDS-Unit-II. bachelor of computer applicatio notesAnkurTiwari813070
 

Similaire à Data analysis & interpretation (20)

7.pptx
7.pptx7.pptx
7.pptx
 
Biostatistics
BiostatisticsBiostatistics
Biostatistics
 
Chapter 10-DATA ANALYSIS & PRESENTATION
Chapter 10-DATA ANALYSIS & PRESENTATIONChapter 10-DATA ANALYSIS & PRESENTATION
Chapter 10-DATA ANALYSIS & PRESENTATION
 
probability and statistics-4.pdf
probability and statistics-4.pdfprobability and statistics-4.pdf
probability and statistics-4.pdf
 
STATISTICAL PROCEDURES (Discriptive Statistics).pptx
STATISTICAL PROCEDURES (Discriptive Statistics).pptxSTATISTICAL PROCEDURES (Discriptive Statistics).pptx
STATISTICAL PROCEDURES (Discriptive Statistics).pptx
 
Research methodology-Research Report
Research methodology-Research ReportResearch methodology-Research Report
Research methodology-Research Report
 
Research Methodology-Data Processing
Research Methodology-Data ProcessingResearch Methodology-Data Processing
Research Methodology-Data Processing
 
Data Analysis & Interpretation and Report Writing
Data Analysis & Interpretation and Report WritingData Analysis & Interpretation and Report Writing
Data Analysis & Interpretation and Report Writing
 
CHAPTER FOUR.pptx
CHAPTER FOUR.pptxCHAPTER FOUR.pptx
CHAPTER FOUR.pptx
 
Data Analysis
Data AnalysisData Analysis
Data Analysis
 
Statistics for management
Statistics for managementStatistics for management
Statistics for management
 
Assigment 1
Assigment 1Assigment 1
Assigment 1
 
MELJUN CORTES research designing_research_methodology
MELJUN CORTES research designing_research_methodologyMELJUN CORTES research designing_research_methodology
MELJUN CORTES research designing_research_methodology
 
Tabulation of data-Development of Research Instrument/ Tool and Analysis
Tabulation of data-Development of Research Instrument/ Tool and Analysis Tabulation of data-Development of Research Instrument/ Tool and Analysis
Tabulation of data-Development of Research Instrument/ Tool and Analysis
 
DATA-PROCESSING.pptx
DATA-PROCESSING.pptxDATA-PROCESSING.pptx
DATA-PROCESSING.pptx
 
Data presenatation
Data presenatationData presenatation
Data presenatation
 
Introduction to Descriptive Statistics
Introduction to Descriptive StatisticsIntroduction to Descriptive Statistics
Introduction to Descriptive Statistics
 
EDUCATIONAL STATISTICS_Unit_I.ppt
EDUCATIONAL STATISTICS_Unit_I.pptEDUCATIONAL STATISTICS_Unit_I.ppt
EDUCATIONAL STATISTICS_Unit_I.ppt
 
statistics PGDM.pptx
statistics PGDM.pptxstatistics PGDM.pptx
statistics PGDM.pptx
 
IDS-Unit-II. bachelor of computer applicatio notes
IDS-Unit-II. bachelor of computer applicatio notesIDS-Unit-II. bachelor of computer applicatio notes
IDS-Unit-II. bachelor of computer applicatio notes
 

Plus de avid

Vaccine hesitancy
Vaccine hesitancyVaccine hesitancy
Vaccine hesitancyavid
 
Electronic publishing
Electronic publishingElectronic publishing
Electronic publishingavid
 
Electronic library and information resources
Electronic library and information resourcesElectronic library and information resources
Electronic library and information resourcesavid
 
E resources
E resourcesE resources
E resourcesavid
 
Digital library
Digital libraryDigital library
Digital libraryavid
 
Digital library software
Digital library softwareDigital library software
Digital library softwareavid
 
Differently able library
Differently able libraryDifferently able library
Differently able libraryavid
 
Different types of interviews
Different types of interviewsDifferent types of interviews
Different types of interviewsavid
 
Common communication format
Common communication formatCommon communication format
Common communication formatavid
 
Classaurus classification
Classaurus classificationClassaurus classification
Classaurus classificationavid
 
Central food technological research institute, mysore
Central food technological research institute, mysoreCentral food technological research institute, mysore
Central food technological research institute, mysoreavid
 
Canon of classification
Canon of classificationCanon of classification
Canon of classificationavid
 
Business library
Business libraryBusiness library
Business libraryavid
 
Barc (bhabha atomic research center)
Barc (bhabha atomic research center)Barc (bhabha atomic research center)
Barc (bhabha atomic research center)avid
 
Automatic classification
Automatic classificationAutomatic classification
Automatic classificationavid
 
Audio format
Audio formatAudio format
Audio formatavid
 
Artificial intelligence and expert system
Artificial intelligence and expert systemArtificial intelligence and expert system
Artificial intelligence and expert systemavid
 
Agris international system for agricultural science and technology
Agris international system for agricultural science  and technologyAgris international system for agricultural science  and technology
Agris international system for agricultural science and technologyavid
 
Agris (agricultural information system)
Agris (agricultural information system)Agris (agricultural information system)
Agris (agricultural information system)avid
 
Acquisitions of library materials
Acquisitions of library materialsAcquisitions of library materials
Acquisitions of library materialsavid
 

Plus de avid (20)

Vaccine hesitancy
Vaccine hesitancyVaccine hesitancy
Vaccine hesitancy
 
Electronic publishing
Electronic publishingElectronic publishing
Electronic publishing
 
Electronic library and information resources
Electronic library and information resourcesElectronic library and information resources
Electronic library and information resources
 
E resources
E resourcesE resources
E resources
 
Digital library
Digital libraryDigital library
Digital library
 
Digital library software
Digital library softwareDigital library software
Digital library software
 
Differently able library
Differently able libraryDifferently able library
Differently able library
 
Different types of interviews
Different types of interviewsDifferent types of interviews
Different types of interviews
 
Common communication format
Common communication formatCommon communication format
Common communication format
 
Classaurus classification
Classaurus classificationClassaurus classification
Classaurus classification
 
Central food technological research institute, mysore
Central food technological research institute, mysoreCentral food technological research institute, mysore
Central food technological research institute, mysore
 
Canon of classification
Canon of classificationCanon of classification
Canon of classification
 
Business library
Business libraryBusiness library
Business library
 
Barc (bhabha atomic research center)
Barc (bhabha atomic research center)Barc (bhabha atomic research center)
Barc (bhabha atomic research center)
 
Automatic classification
Automatic classificationAutomatic classification
Automatic classification
 
Audio format
Audio formatAudio format
Audio format
 
Artificial intelligence and expert system
Artificial intelligence and expert systemArtificial intelligence and expert system
Artificial intelligence and expert system
 
Agris international system for agricultural science and technology
Agris international system for agricultural science  and technologyAgris international system for agricultural science  and technology
Agris international system for agricultural science and technology
 
Agris (agricultural information system)
Agris (agricultural information system)Agris (agricultural information system)
Agris (agricultural information system)
 
Acquisitions of library materials
Acquisitions of library materialsAcquisitions of library materials
Acquisitions of library materials
 

Dernier

Advanced Views - Calendar View in Odoo 17
Advanced Views - Calendar View in Odoo 17Advanced Views - Calendar View in Odoo 17
Advanced Views - Calendar View in Odoo 17Celine George
 
Key note speaker Neum_Admir Softic_ENG.pdf
Key note speaker Neum_Admir Softic_ENG.pdfKey note speaker Neum_Admir Softic_ENG.pdf
Key note speaker Neum_Admir Softic_ENG.pdfAdmir Softic
 
Russian Escort Service in Delhi 11k Hotel Foreigner Russian Call Girls in Delhi
Russian Escort Service in Delhi 11k Hotel Foreigner Russian Call Girls in DelhiRussian Escort Service in Delhi 11k Hotel Foreigner Russian Call Girls in Delhi
Russian Escort Service in Delhi 11k Hotel Foreigner Russian Call Girls in Delhikauryashika82
 
Grant Readiness 101 TechSoup and Remy Consulting
Grant Readiness 101 TechSoup and Remy ConsultingGrant Readiness 101 TechSoup and Remy Consulting
Grant Readiness 101 TechSoup and Remy ConsultingTechSoup
 
General AI for Medical Educators April 2024
General AI for Medical Educators April 2024General AI for Medical Educators April 2024
General AI for Medical Educators April 2024Janet Corral
 
Introduction to Nonprofit Accounting: The Basics
Introduction to Nonprofit Accounting: The BasicsIntroduction to Nonprofit Accounting: The Basics
Introduction to Nonprofit Accounting: The BasicsTechSoup
 
Kisan Call Centre - To harness potential of ICT in Agriculture by answer farm...
Kisan Call Centre - To harness potential of ICT in Agriculture by answer farm...Kisan Call Centre - To harness potential of ICT in Agriculture by answer farm...
Kisan Call Centre - To harness potential of ICT in Agriculture by answer farm...Krashi Coaching
 
Class 11th Physics NEET formula sheet pdf
Class 11th Physics NEET formula sheet pdfClass 11th Physics NEET formula sheet pdf
Class 11th Physics NEET formula sheet pdfAyushMahapatra5
 
Explore beautiful and ugly buildings. Mathematics helps us create beautiful d...
Explore beautiful and ugly buildings. Mathematics helps us create beautiful d...Explore beautiful and ugly buildings. Mathematics helps us create beautiful d...
Explore beautiful and ugly buildings. Mathematics helps us create beautiful d...christianmathematics
 
Measures of Central Tendency: Mean, Median and Mode
Measures of Central Tendency: Mean, Median and ModeMeasures of Central Tendency: Mean, Median and Mode
Measures of Central Tendency: Mean, Median and ModeThiyagu K
 
Accessible design: Minimum effort, maximum impact
Accessible design: Minimum effort, maximum impactAccessible design: Minimum effort, maximum impact
Accessible design: Minimum effort, maximum impactdawncurless
 
Presentation by Andreas Schleicher Tackling the School Absenteeism Crisis 30 ...
Presentation by Andreas Schleicher Tackling the School Absenteeism Crisis 30 ...Presentation by Andreas Schleicher Tackling the School Absenteeism Crisis 30 ...
Presentation by Andreas Schleicher Tackling the School Absenteeism Crisis 30 ...EduSkills OECD
 
Software Engineering Methodologies (overview)
Software Engineering Methodologies (overview)Software Engineering Methodologies (overview)
Software Engineering Methodologies (overview)eniolaolutunde
 
Nutritional Needs Presentation - HLTH 104
Nutritional Needs Presentation - HLTH 104Nutritional Needs Presentation - HLTH 104
Nutritional Needs Presentation - HLTH 104misteraugie
 
BASLIQ CURRENT LOOKBOOK LOOKBOOK(1) (1).pdf
BASLIQ CURRENT LOOKBOOK  LOOKBOOK(1) (1).pdfBASLIQ CURRENT LOOKBOOK  LOOKBOOK(1) (1).pdf
BASLIQ CURRENT LOOKBOOK LOOKBOOK(1) (1).pdfSoniaTolstoy
 
Q4-W6-Restating Informational Text Grade 3
Q4-W6-Restating Informational Text Grade 3Q4-W6-Restating Informational Text Grade 3
Q4-W6-Restating Informational Text Grade 3JemimahLaneBuaron
 
Unit-IV- Pharma. Marketing Channels.pptx
Unit-IV- Pharma. Marketing Channels.pptxUnit-IV- Pharma. Marketing Channels.pptx
Unit-IV- Pharma. Marketing Channels.pptxVishalSingh1417
 
Beyond the EU: DORA and NIS 2 Directive's Global Impact
Beyond the EU: DORA and NIS 2 Directive's Global ImpactBeyond the EU: DORA and NIS 2 Directive's Global Impact
Beyond the EU: DORA and NIS 2 Directive's Global ImpactPECB
 

Dernier (20)

Advanced Views - Calendar View in Odoo 17
Advanced Views - Calendar View in Odoo 17Advanced Views - Calendar View in Odoo 17
Advanced Views - Calendar View in Odoo 17
 
Advance Mobile Application Development class 07
Advance Mobile Application Development class 07Advance Mobile Application Development class 07
Advance Mobile Application Development class 07
 
Key note speaker Neum_Admir Softic_ENG.pdf
Key note speaker Neum_Admir Softic_ENG.pdfKey note speaker Neum_Admir Softic_ENG.pdf
Key note speaker Neum_Admir Softic_ENG.pdf
 
Russian Escort Service in Delhi 11k Hotel Foreigner Russian Call Girls in Delhi
Russian Escort Service in Delhi 11k Hotel Foreigner Russian Call Girls in DelhiRussian Escort Service in Delhi 11k Hotel Foreigner Russian Call Girls in Delhi
Russian Escort Service in Delhi 11k Hotel Foreigner Russian Call Girls in Delhi
 
Mattingly "AI & Prompt Design: Structured Data, Assistants, & RAG"
Mattingly "AI & Prompt Design: Structured Data, Assistants, & RAG"Mattingly "AI & Prompt Design: Structured Data, Assistants, & RAG"
Mattingly "AI & Prompt Design: Structured Data, Assistants, & RAG"
 
Grant Readiness 101 TechSoup and Remy Consulting
Grant Readiness 101 TechSoup and Remy ConsultingGrant Readiness 101 TechSoup and Remy Consulting
Grant Readiness 101 TechSoup and Remy Consulting
 
General AI for Medical Educators April 2024
General AI for Medical Educators April 2024General AI for Medical Educators April 2024
General AI for Medical Educators April 2024
 
Introduction to Nonprofit Accounting: The Basics
Introduction to Nonprofit Accounting: The BasicsIntroduction to Nonprofit Accounting: The Basics
Introduction to Nonprofit Accounting: The Basics
 
Kisan Call Centre - To harness potential of ICT in Agriculture by answer farm...
Kisan Call Centre - To harness potential of ICT in Agriculture by answer farm...Kisan Call Centre - To harness potential of ICT in Agriculture by answer farm...
Kisan Call Centre - To harness potential of ICT in Agriculture by answer farm...
 
Class 11th Physics NEET formula sheet pdf
Class 11th Physics NEET formula sheet pdfClass 11th Physics NEET formula sheet pdf
Class 11th Physics NEET formula sheet pdf
 
Explore beautiful and ugly buildings. Mathematics helps us create beautiful d...
Explore beautiful and ugly buildings. Mathematics helps us create beautiful d...Explore beautiful and ugly buildings. Mathematics helps us create beautiful d...
Explore beautiful and ugly buildings. Mathematics helps us create beautiful d...
 
Measures of Central Tendency: Mean, Median and Mode
Measures of Central Tendency: Mean, Median and ModeMeasures of Central Tendency: Mean, Median and Mode
Measures of Central Tendency: Mean, Median and Mode
 
Accessible design: Minimum effort, maximum impact
Accessible design: Minimum effort, maximum impactAccessible design: Minimum effort, maximum impact
Accessible design: Minimum effort, maximum impact
 
Presentation by Andreas Schleicher Tackling the School Absenteeism Crisis 30 ...
Presentation by Andreas Schleicher Tackling the School Absenteeism Crisis 30 ...Presentation by Andreas Schleicher Tackling the School Absenteeism Crisis 30 ...
Presentation by Andreas Schleicher Tackling the School Absenteeism Crisis 30 ...
 
Software Engineering Methodologies (overview)
Software Engineering Methodologies (overview)Software Engineering Methodologies (overview)
Software Engineering Methodologies (overview)
 
Nutritional Needs Presentation - HLTH 104
Nutritional Needs Presentation - HLTH 104Nutritional Needs Presentation - HLTH 104
Nutritional Needs Presentation - HLTH 104
 
BASLIQ CURRENT LOOKBOOK LOOKBOOK(1) (1).pdf
BASLIQ CURRENT LOOKBOOK  LOOKBOOK(1) (1).pdfBASLIQ CURRENT LOOKBOOK  LOOKBOOK(1) (1).pdf
BASLIQ CURRENT LOOKBOOK LOOKBOOK(1) (1).pdf
 
Q4-W6-Restating Informational Text Grade 3
Q4-W6-Restating Informational Text Grade 3Q4-W6-Restating Informational Text Grade 3
Q4-W6-Restating Informational Text Grade 3
 
Unit-IV- Pharma. Marketing Channels.pptx
Unit-IV- Pharma. Marketing Channels.pptxUnit-IV- Pharma. Marketing Channels.pptx
Unit-IV- Pharma. Marketing Channels.pptx
 
Beyond the EU: DORA and NIS 2 Directive's Global Impact
Beyond the EU: DORA and NIS 2 Directive's Global ImpactBeyond the EU: DORA and NIS 2 Directive's Global Impact
Beyond the EU: DORA and NIS 2 Directive's Global Impact
 

Data analysis & interpretation

  • 1. Data Analysis & Interpretation The data, collected for research, has to be processed, analyzed and interpreted to develop a solution to the research question. Data analysis is a practice in which unorganized or unfinished data is ordered and organized so that useful information can be extracted from it. It is the most enjoyable part of carrying out the research since after all of the hard works and waiting the researcher gets the chance to find out the answers. So analyzing the data and interpreting the results are the “reward” for the work of collecting the data.
  • 2. Types of Data analysis Data analysis can be categorized into two: Descriptive analysis Inferential analysis
  • 3. Descriptive analysis  Descriptive analysis describe the main features of a collection of data quantitatively  Provides simple summaries about the sample and the measures  Descriptive analysis includes the numbers, tables, charts, and graphs used to describe, organize, summarize, and present raw data  Describes the frequency and/or percentage distribution of a single variable  Tells how many and what percent Example:33% of the respondents are male and 67% are female
  • 4. …….Descriptive analysis  Descriptive analysis are most often used to examine: - Central tendency of data, i.e. where data tend to fall, as measured by the mean, median, and mode. - Dispersion of data, i.e. how spread out data are, as measured by the variance and the standard deviation. - Skew of data, i.e. how concentrated data are at the low or high end of the scale, as measured by the skew index. - Kurtosis of data, i.e. how concentrated data are around a single value, as measured by the kurtosis index.
  • 5. Inferential analysis  Inferential analysis is the process of drawing conclusions from data that are subject to random variation  Used to analyze data from randomly selected samples  Used to try to infer from the sample data what the population might think  Risk of error because your sample may be different from the population as a whole  To make an inference, you first need to estimate the probability of that error
  • 6. …..With descriptive analysis you are simply describing what is or what the data shows. With inferential analysis, you are trying to reach conclusions that extend beyond the immediate data alone. we use inferential analysis to make judgments of the probability that an observed difference between groups is a dependable one or one that might have happened by chance in this study. Thus, we use inferential analysis to make inferences from our data to more general conditions; we use descriptive analysis simply to describe what's going on in our data.
  • 7. Interpretation  After collecting and analyzing data, the researcher has to accomplish the task of drawing inferences. It has to be done very carefully, otherwise misleading conclusions may be drawn. It is through the task of interpretation the researcher draws inferences from the collected facts.
  • 8. ….Interpretation Need of Interpretation  Usefulness and utility of research findings lie in proper interpretation  Researcher can well understand the principle that works beneath his findings  Leads to the establishment of explanatory concepts for future research  Researcher can better appreciate what and why his findings are..
  • 9. Tabulation  Tabulation is the process of arranging data in systematic manner in the form of rows and columns.  Classified data is condensed in the form of a table so that it may be more easily understood.  The main objective of tabulation is to systematize data and make them simple and comparable.
  • 10. ….Tabulation Objectives  To simplify complex data  To facilitate comparison  To economize space  To facilitate statistical analysis  To facilitate presentation
  • 11. ….Tabulation The most important thing about a table is that it should clearly communicate information. To achieve this there are certain conventions that must be followed.  Tables must be clear and easy to read  Must be ruled or presented as a computer generated table an of an appropriate size for the information.
  • 12. ….Tabulation  Must have a title which describes the data in the table. This title should be underlined or in bold type.  Columns and rows should be clearly headed. When appropriate the left column or top row should contain the independent variable and the bottom row or right column should contain the dependent variable.
  • 13. ….Tabulation  Units should be displayed in column / row headings only.  Missing values should be displayed as -, and zeros as 0. Thee should be no blanks in a table conveying experimental results.  Numbers should be listed neatly below each other and should be to the same number of decimal places.
  • 14. ….Tabulation Main parts of a table  Table No.  Title of table  Captions  Stubs  Body of the table  Head notes  Foot notes  Source note
  • 15.
  • 17. Generalization In research, once the data is properly arranged using tabulation, it starts showing some pattern. On the basis of this pattern, the researcher may assume about the nature of the population. The process of making such assumptions is known as generalization.
  • 18. ….Generalization  It is a broad statement about the population based on provided information, observations and experiences  A valid generalization is build on - supporting facts - several examples - past experiences - logic and reasoning  For a valid generalization, the sample drawn should be typical and representative.
  • 19. ….Generalization Types of Generalization Valid generalizations Faulty generalizations
  • 20. ….Generalization Valid generalizations  Supported by facts  Agrees with what you already know about the topic  Uses logic and reasoning  Proven with several examples
  • 21. ….Generalization Faulty generalizations  Not supported by facts  Watch for the key words: none, all, always, never, everyone, nobody