Solar wind magnetosphere coupling effect on radio refractivity
SeaSurfaceHeight
1. Julianna K. Kurpis, Marino A. Kokolis, and Grace Terdoslavich: Bard High School Early College, Long Island City, New York
Jeremy N. Thomas and Natalia N. Solorzano: Digipen Institute of Technology& Northwest Research Associates, Redmond, Washington
Although the structure of tropical cyclones (TCs) is well known, there are
innumerable factors that contribute to their formation and development. The
question that we choose to assess is at the very foundation of what conditions are
needed for TC genesis and intensification: How does ocean heat content
contribute to TC intensity change? Today, it is generally accepted that warm water
promotes TC development. Indeed, TCs can be modeled as heat engines that gain
energy from the warm water and, in turn, make the sea surface temperature (SST)
cooler. Our study tests the relationship between the heat content of the ocean and
the intensification process of strong Western North Pacific (WNP) Typhoons
(sustained winds greater than 130 knots). We obtained storm track and wind
speed data from the Joint Typhoon Warning Center and sea surface height (SSH)
data from AVISO as a merged product from altimeters on three satellites: Jason-1,
Jason-2, and Envisat. We used MATLAB to compare the SSH to the wind speeds,
using these as proxies for ocean heat content and intensity, respectively. Two of
our most notable WNP typhoons, Xangsane and Durian (2006), initiated rapid
intensification when the SSH was well above the mean. However, later during their
intensification the SSH began to steadily drop, thus supporting the basic heat
engine model. Using the results from these two case studies and from additional
tropical cyclones included in our study, we will discuss how monitoring SSH might
help to better forecast TC intensity change.
Abstract
Discussion and Conclusions
•
Two of our most notable WNP typhoons, Xangsane and Durian (2006), initiated rapid intensification when the SSH was above the
mean. However, later during their intensification the SSH began to steadily drop.
•
The connection between SSH and intense winds we observed supports the idea of a tropical cyclone acting like a heat engine,
taking heat from the ocean and converting it into kinetic energy (manifested as wind). This leaves the ocean cold and depressed,
explaining the sharp drops in SSH while the wind speed continues to increase.
•
Our observed relationship between SSH and hurricane wind intensity generally agree with previous studies by Nonaka and Xie
(2002) and Zhu and Zhang (2006).
•
A high SSH can raise a hurricane’s intensity, but alone it is not a sufficient factor in determining a hurricane’s strength.
•
Additional studies comparing SSH and tropical cyclone intensity in all basins are needed to solidify our findings.
Acknowledgments
We’d like to thank Yoav Bergner from Bard High School Early College for helping with MATLAB. This work was partially supported
by a grant from the Toshiba America Foundation to Bard High School Early College Queens.
Bard Early College Atmospheric Physics Program
Bard High School Early College is a four-year program that enables students to earn a
New York State high school diploma and a tuition-free Bard College associate's degree in
four years. During 2008-2010, students participated in an atmospheric science program
designed by Professors Jeremy Thomas and Natalia Solorzano. The atmospheric science
course was a lab- and project-based course that provided an introduction to the physics
and chemistry of the earth’s atmosphere. As a prerequisite, all students in the class had
completed one year of algebra-based physics. Some topics that were covered included
electromagnetic radiation, layers of the sun, cloud development, atmospheric circulation,
weather forecasting, thunderstorms, hurricanes, air pollution, climate, and climate change.
Students were expected to complete two major projects, one each semester, which
required significant independent work done outside of class and lab times. Our study
comparing SSH and hurricane intensity grew out of one such student project.
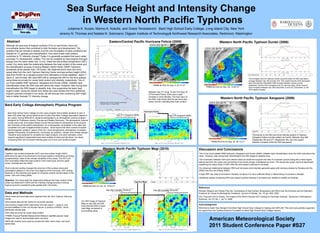
The trends on the SSH and wind intensity graphs of Typhoon
Xangsane follow a similar pattern as Durian. Between day 269
(September 26) and 271 (September 28), the wind speed
steadily increased while the SSH decreased.
The strongest wind for Typhoon Durian occurred when the SSH was below
average between day 333 and day 334. This means that the SSH decreased
when the typhoon intensified. After its peak intensity, Durian’s winds
weakened, and the SSH increased over the next two days. When Durian’s
wind increased between day 336 (December 2) and 337 (December 3), the
SSH rapidly dropped.
Between day 217 (Aug. 5) and 218 (Aug. 6)
of Hurricane Felicia, there was a rapid
increase in wind intensity. The blue color on
the SSH map shows that the sea level was
below normal, indicating less heat content.
Aug: 4 5 6 7 8 9 10 11 12
Typhoon Megi
Hurricane Felicia
Our SSH maps of Typhoon
Megi on day 292 and 293
show that the SSH is lower
near Megi compared to
surrounding areas.
October : 13 15 17 19 21 23 25
American Meteorological Society
2011 Student Conference Paper #S27
Eastern/Central Pacific Hurricane Felicia (2009) Western North Pacific Typhoon Durian (2006)
Western North Pacific Typhoon Xangsane (2006)
Map taken from the NHC Tropical Cyclone Report
Hurricane Felicia 3-11 August 2009
Day 217 (August 5 2009) Day 218 (August 6 2009)
Day 292 (October 19 2010) Day 293 (October 20 2010)
November/December: 25 26 27 28 29 30 1 2 3 4 5 6
September: 25 26 27 28 29 30 31
32
Sea Surface Height and Intensity Change
in Western North Pacific Typhoons
Motivations
•
Together, sea surface temperate (SST) and sea surface height (SSH)
determine the type of environment a hurricane needs to intensify by providing
complementary views of the climate variability of the ocean. The SST and
SSH anomalies reflect the heat content in the mixed layer and the upper
ocean. (Nonaka and Xie 2002)
•
Storm-induced cooling changes the structure of the surface winds and
precipitation patterns in the inner core regions of the hurricane. SST cooling
depends on the intensity and speed of a tropical cyclone and the depth of the
ocean. (Zhu and Zhang 2006)
Objective: Our study tests the relationship between the heat content of the
ocean (as observed in SSH) and the intensity change process of strong
tropical cyclones (sustained winds greater than 130 knots).
Data and Methods
•Storm track and wind data were obtained from the Joint Typhoon Warning
Center.
•
Wind speed data are the metric for hurricane intensity.
•Sea Surface Height (SSH) data came from the Jason-1, Jason-2, and
Envisat satellites on the Live Access Server, a product of AVISO, which
distributes climate data.
•
SSH data are proxy for ocean heat content.
•TRMM (Tropical Rainfall Measurement Mission) satellite passive radar
images are used to demonstrate storm structure.
•MATLAB routines were used to process the SSH, storm track, and wind
speed data.
TRMM 85-GHz for Aug. 4, 23:17 UT
Western North Pacific Typhoon Megi (2010)
TRMM 85-GHz for Oct 16, 15:25 UT
TRMM 85-GHz for Nov. 29, 13:00 UT
TRMM 85-GHz for Sep. 30, 06:13 UT
References
Nonaka, Masami and Shang-Ping Xie, Covariations of Sea Surface Temperature and Wind over the Kuroshio and Its Extension:
Evidence for Ocean-to-Atmosphere Feedback, Journal of Climate, Vol. 16, pp 1404, 2002.
Zhu, Tong and Da-Lin Zhang, The Impact of the Storm-Induced SST Cooling on Hurricane Intensity, Advances in Atmospheric
Sciences, Vol. 23, No. 1, pp 14, 2006.