1. Sub-basin level Vulnerability Analysis, Massachusetts
To determine the impact of the new Water Management Act (WMA) Permitting requirements
INTRODUCTION RESULTS
CONCLUSION
METHODS
Surface Water Supply Watersheds
Coldwater Fisheries Resources Groundwater PermitsPopulation Change 2000 – 2013
Aquifers
Surface Water Protection Outstanding Resource Waters
Table 1. Scoring Card: scoring attributed to each layer
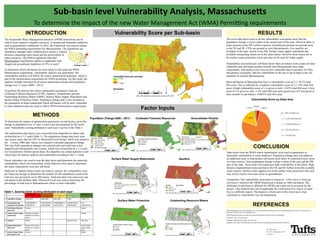
The seven data layers used to do the vulnerability assessment show that the
population change is most evident in the eastern part of the state. However there is
some increase in the SW (yellow regions). Groundwater permits are present most
in the NE and SE. CFRs are present in west Massachusetts. Few aquifers are
available in the state, mostly in the SW. Surface water supply watersheds and
available outstanding waters are in the same basins. However those baisns are in
the surface water protection zones and may not be used for water supply.
Vulnerability assessment per sub-basin shows that sub-basins in the center are least
vulnerable and sub-basins present towards east Massachusetts have high
vulnerability. Sub-basins in the west are also vulnerable due to presence of CFRs
and absence of aquifers. But the vulnerability in the east is not as high as the vul-
nerability in western Massachusetts.
Most sub-basins in Massachusetts have a vulnerability score of 2 (~76.2% total
MA area). This is followed by a medium vulnerability score of 3 (~18% total MA
area). A high vulnerability score of 1 is given to only ~4.05% total MA area. A low
score of 4 is given to only ~1.8% total MA area and a good score of 5 was given to
least number of sub-basins (~0.003% total MA area).
Vulnerability Score by State Area
The Sustainable Water Management Initiative (SWMI) framework can be
used to asses impacts to aquatic resources, to natural and manmade conditions
such as groundwater withdrawal. In 2012, the framework was used to outline
the WMA permitting requirements for Massachusetts. The regulations are
intended to manage water withdrawals to ensure a balance
between competing water needs and the preservation of
water resources. The WMA regulations state that
Minimization requirements applies to applicants with
August net groundwater depletion of 25% or more4
.
To determine which sub-basins are most likely to fall under the WMA
Minimization requirement, vulnerability analysis was performed. The
vulnerability analysis will follow the source optimization technique, which is
part of the minimization requirement for WMA permitting. For this study, the
analysis includes sub-basin level source optimization along with population
change over 13 years (2000—2013).
To perform the analysis the source optimization parameters used are:
Coldwater Fisheries Resources (CFR), Aquifers, Groundwater permits,
Outstanding Resource Waters (ORW), Surface Water Supply Watersheds and
Surface Water Protection Zones. Population change data is also included to
the parameters to better understand which sub-basins will be most vulnerable
to water depletion and may need to follow WMA minimization requirements.
To determine the impact of optimization parameters on sub-basins, given the
change in population over 13 year, a score card was prepared for the layers
used. Vulnerability scoring attributed to each layer is given in the Table 1.
The optimization data layers were converted from shapefiles to rasters and
reclassified on a 1-5 scale (Table 1). The population change data layer used
was census tracts data for 2013 in Microsoft Excel format, which was joined to
the Census_2000 data. Query was created to calculate population change.
The new field (population change) was selected and converted into a new
shapefile and subsequently into a raster, which was reclassified on a 1-5 scale.
For Groundwater Permits (point data), the shapefile was joined spatially to sub
-basin layer for density analysis and reclassified according to the 1-5 scale.
Raster calculator was used to sum the data layers and determine the statewide
vulnerability which was reclassified. Zonal Statistics were used to determine
the mean vulnerability score per sub-basin.
Math tool in Spatial Analyst tools was used to convert the vulnerability score
per basin into integer to determine the number of cells attributed to each score.
Cell size was previously set to 300 meters. Total area (km2
) for each score was
calculated in the attribute table. Microsoft Excel was used to determine the
percentage of total area in Massachusetts which is most vulnerable.
Bad Score Good Score
1 2 3 4 5
1 Population Change 2060-3052 1000-2000 500-1000 0-500 -12051 – 0
2 Groundwater dis-
charge permit density
0.023699805 to
0.090200752
0.007074569 to
0.023699805
0.002829828 to
0.007074569
0.000353728 to
0.002829828
0 to
0.000353728
3 Cold Water Fisheries
Resources
Present Absent
4 Surface Water supply
watersheds
Emergency Supply
Watershed/ Rhode
Island
Present
5 Aquifers Absent Medium Yield High Yield
6 Outstanding Water
Resources
Restricted/ Protect-
ed/Scenic / Retired
water
Surface Water
Supply Water-
shed
7 Surface Water Protec-
tion Zones A, B, C
Present Absent
REFERENCES
Data layers from the WMA source optimization were used as parameters to
determine vulnerability to water depletion. Population change data was added as
an additional layer to help predict sub-basins most likely to experience more stress
on water sources. Since population change is most evident in the east and the SW
part of the state. These areas will experience high vulnerability in the future. High
density of groundwater water permits in the NE and SE further stress the available
water sources. Surface water supplies are in the surface water protection zone and
may not be used to overcome stress on groundwater.
Limitations: The vulnerability assessment is based on ~2200 minor or drainage
sub-basins. However the SWMI framework is based on 1400 sub-basins. The
definition of sub-basin is different for SWMI and could not be accessed for the
project. This analysis may not be applicable for a sub-basin if its source of water
lies in a different region. The degree to which each of the seven layers may
contribute to vulnerability was not determined.
Water Management Act Permit Guidance Nov 7,2014 Massachusetts department of environmental protection: http://www.mass.gov/eea/
docs/dep/water/laws/i-thru-z/wmaguide14.doc
SWMI framework: http://www.mass.gov/eea/docs/dep/water/resources/n-thru-y/wmafaq.pdf
Data layers: http://www.mass.gov
Population 2000 data layer: http://www.mass.gov
Population 2013 data: http://factfinder.census.gov/faces/nav/jsf/pages/searchresults.xhtml?refresh=t#
BY: Mehar Kaur
CEE 187_Introduction to GIS
12.10.2015
Vulnerability Score per Sub-basin
Factor Inputs