109 michael mello - 7538891 - surface characterization based on lateral shearing of diffracted wave fronts to measure in-plane and out-of-plane displacement gradient fields
Michael Mello, Ares J. Rosakis - Surface Characterization Based on Lateral Shearing of Diffracted Wave Fronts to Measure In-Lane and Out-of-Plane Displacement Gradient Fields
133 stephanie mello - 8439759 - system and method of facilitating external ...Mello_Patent_Registry
Contenu connexe
Similaire à 109 michael mello - 7538891 - surface characterization based on lateral shearing of diffracted wave fronts to measure in-plane and out-of-plane displacement gradient fields
Depth Estimation and Source Location of Magnetic Anomalies from a Basement Co...IOSR Journals
Similaire à 109 michael mello - 7538891 - surface characterization based on lateral shearing of diffracted wave fronts to measure in-plane and out-of-plane displacement gradient fields (20)
AWS Community Day CPH - Three problems of Terraform
109 michael mello - 7538891 - surface characterization based on lateral shearing of diffracted wave fronts to measure in-plane and out-of-plane displacement gradient fields
1. IIIIII 1111111111111111111111111111111111111111111111111111111111111
c12) United States Patent
Mello et al.
(54)
(75)
(73)
( *)
(21)
SURFACE CHARACTERIZATION BASED ON
LATERAL SHEARING OF DIFFRACTED
WAVE FRONTS TO MEASURE IN-PLANE
AND OUT-OF-PLANE DISPLACEMENT
GRADIENT FIELDS
Inventors: Michael Mello, Phoenix, AZ (US); Ares
J. Rosakis, Altadena, CA (US)
Assignee: California Institute of Technology,
Pasadena, CA (US)
Notice: Subject to any disclaimer, the term ofthis
patent is extended or adjusted under 35
U.S.C. 154(b) by 172 days.
Appl. No.: 11/538,055
(22) Filed: Oct. 2, 2006
(60)
(51)
(52)
(58)
(56)
Related U.S. Application Data
Provisional application No. 60/722,514, filed on Sep.
30, 2005.
Int. Cl.
GOJB 9102
GOJL 1124
(2006.01)
(2006.01)
U.S. Cl. ....................... 356/520; 356/35.5; 356/521
Field of Classification Search ................ 356/35.5,
356/450, 520, 521
See application file for complete search history.
References Cited
U.S. PATENT DOCUMENTS
5,710,631 A * 111998 Bou-Ghannam et al..... 356/495
100
)
110
Optical
Module
Sample Holder
1lU
Diffracted
Probe Light
US007538891Bl
(10) Patent No.: US 7,538,891 Bl
May 26,2009(45) Date of Patent:
6,031,611 A *
6,304,325 B1 *
6,600,565 B1 *
212000 Rosakis eta!. .............. 356/511
10/2001 Hardy et al................. 356/450
7/2003 Suresh eta!. ............... 356/521
2004/0257587 A1 12/2004 Rosakis eta!.
OTHER PUBLICATIONS
Bates, W.J., "A Wavefront Shearing Interferometer," Proceedings of
the Physical Society ofLondon, 59(6):940-950, Nov. 1947.
Boone, P.M., "Determination of Slope and Strain Contours by
Double-exposure Shearing Interferometry," Experimental Mechan-
ics, 15(8):295-302, Aug. 1975.
Kim, K.-S., eta!., "A combinednormal- and transverse-displacement
interferometer with an application to impact ofy-cut quartz," Journal
ofApplied Physics, 48(10):4132-4139, Oct. 1977.
Lee, H., eta!., "Full-field optical measurement ofcurvatures in ultra-
thin-film-substrate systems in the range of geometrically nonlinear
deformations," Journal ofApplied Physics, 89(11):6116-6129, Jun.
2001.
Nakadate, S., et al., "Fringe scanning speckle-pattern
interferometry," Applied Optics, 24(14):2172-2180, Jul. 1985.
Patorski, K., "Shearing interferometry and the moire method for
shear strain determination,"Applied Optics, 27(16):3567-3572, Aug.
1988.
Patorski, K., et a!., "Real-time optical differentiation for Moire
interferometry," Applied Optics, 26(10):1977-1982, May 1987.
(Continued)
Primary Examiner-Michael A Lyons
(74) Attorney, Agent, or Firm-Fish & Richardson P.C.
(57) ABSTRACT
Apparatus and techniques for using an optical shearing inter-
ferometry to obtain full field mapping ofin-plane and out-of-
plane displacement field gradients of a sample surface of a
sample.
37 Claims, 16 Drawing Sheets
providing a first optical grating and a second optical grating on a
sample surface of a sample, where the first and second optical
gratings are along a first grating direction and a second, different
direction within the sample surface and spatially overlapping with
each other
l
directing different optical probe beams to the sample surface at
different incident directions, respectively
lusing at least one optical shearing interferometer to receive
diffracted light of the different optical probe beams from the first and
the second optical gratings, without interaction between two of the
different optical probe beams, to obtain phase-shifted optical
shearing interferograms along two different shearing directions at
each location that are perpendicular to a normal direction of the
sample surface at the location
processing obtained phase-shifted optical shearing interferograms
from the different optical probe beams to separate field gradients for
both in-plane and out-of-plane displacements and to generate a map
of field gradients for both in-plane and out-of-plane displacements on
the sample surface
2. US 7,538,891 Bl
Page 2
OTHER PUBLICATIONS
Rastogi, P.K., "High Resolution Moire Photography: Extension to
Variable Sensitivity Displacement Measurement and to the Determi-
nation of Direct Strains," Supplement to Optics & Photonics News,
9(2):8133-8135, Feb. 1998.
Rastogi, P.K., "Letter Measurement of in-plane strains using elec-
tronic speckle and electronic speckle-shearing pattern
interferometry," Journal ofModern Optics, 43(8):1577-1581, Aug.
1996.
Tippur, H.V., et al., "A coherent gradient sensor for crack tip defor-
mation measurements: analysis and experimental results," Interna-
tional Journal ofFracture, 48(3):193-204, Apr. 1991.
Tippur, H.V., eta!., "Optical mapping ofcracktip deformations using
the methods oftransmission and reflection coherent gradient sensing:
a study ofcrack tipK-dominance," International Journal ofFracture,
52(2):91-117, Nov. 1991.
Weissman, E.M., eta!., "Whole-Field Strain Determination by Moire
Shearing Interferometry," Journal ofStrain Analysisfor Engineering
Design, 19(2):77-80, 1984.
Assa, A., et al., "Recording slope and curvature contours of flexed
plates using a grating shearing interferometer," Applied Optics,
16(9):2504-2513, Sep. 1977.
Creath, K., "Phase-measurement interferometry techniques,"
Progress in Optics, 26:349-393, (1988).
Espinosa, H.D., et a!., "A Variable Sensitivity Displacement
Interferometer with Application to Wave Propagation Experiments,"
Journal ofApplied Mechanics, 64(1):123-131, Mar. 1997.
Han, B., et a!., "Immersion Interferometer for Microscopic Moire
Interferometry," Experimental Mechanics, 32(1):38-41, Mar. 1992.
He, M.Y., eta!., "Asymmetric Four-Point Crack Specimen," Journal
ofApplied Mechanics, 67(1):207-209, Mar. 2000.
Hung, Y.Y., et a!., "Speckle-Shearing Interferometric Technique: a
Full-Shield Strain Gauge," Applied Optics, 14(3):618-622, Mar.
1975.
Mello, M., eta!., "Infrared Diffraction Interferometer for Coplanarity
Measurement of High-Density Solder Bump Pattern," Optical Engi-
neering, 43(4):888-894, Apr. 2004.
Park, T.-S., et al., "Measurement offull-field curvature and geometri-
cal instability of thin film-substrate systems through CGS
interferometry," Journal of the Mechanics and Physics of Solids,
51(11-12):2191-2211, Nov.-Dec. 2003.
Patorski, K., et a!., "Collimation test by double grating shearing
interferometer," Applied Optics, 15(5):1234-1240, May 1976.
Patorski, K., eta!., "Digital in-plane electronic speckle pattern shear-
ing interferometry," Optical Engineering, 36(7):2010-2015, Jul.
1997.
Rosakis, A.J., et a!., "Full field measurements of curvature using
coherent gradient sensing: application to thin film characterization,"
Thin Solid Films, 325(1-2):42-54, Jul. 1998.
Shang, H.M., et a!., "Locating and Sizing Disbonds in Glassfibre-
Reinforced Plastic Plates Using Shearography," Journal ofEngineer-
ing Materials and Technology, 113(1):99-103, Jan. 1991.
Shield, T.W., et a!., "Diffraction Theory of Optical Interference
Moire and a Device for Production of Variable Virtual Reference
Gratings: a Moire Microscope," Experimental Mechanics,
31(2):126-134, Jun. 1991.
* cited by examiner
4. U.S. Patent May 26,2009 Sheet 2 of 16 US 7,538,891 Bl
FIG. 18
providing a first optical grating and a second optical grating on a
sample surface of a sample, where the first and second optical
gratings are along a first grating direction and a second, different
direction within the sample surface and spatially overlapping with
each other
,,
directing different optical probe beams to the sample surface at
different incident directions, respectively
,,
using at least one optical shearing interferometer to receive
diffracted light of the different optical probe beams from the first and
the second optical gratings, without interaction between two of the
different optical probe beams, to obtain phase-shifted optical
shearing interferograms along two different shearing directions at
each location that are perpendicular to a normal direction of the
sample surface at the location
'
processing obtained phase-shifted optical shearing interferograms
from the different optical probe beams to separate field gradients for
both in-plane and out-of-plane displacements and to generate a map
of field gradients for both in-plane and out-of-plane displacements on
the sample surface
7. U.S. Patent May 26,2009 Sheet 5 of 16 US 7,538,891 Bl
E
co
co (])
-~ a:l
+-' (])
0...0
Oo.....
a_
~
~
--------------------}---, -----------------.----- .,.. i'o:
~ i I aJ
~ i i
~ : I
~ i
~ i
~ ~ _....-1
~ ~ I ~
~ i i
......-
......-
N
~ i !
~ : ' : <(
~! : ~""~-r-
··················TiJ""""""""""~----- 0 N
~ ~ ~ E
~ ~ l' ! ,·· a:l co ~or- ~ ~ i .../· uco......-" ~ ! : ..· ,.•·0·-
~~~· . ~ . ! ~--·/ ,..../' ~ 8-~" ! : ~ ••·• ,<' "" 0
~ . .. ~ • ! /,•' ....···~ .....
" . '.. ! 00 ~ ,.·· .• a_
~ ~ • 1/-"' .......····
"' !~-·····'] .......··
t1"'• - .,,,......,,,......,....>1~::·1~1·:~:·~:.,.................... 00.
_ )
•.•.•.•.•.•.·.······················· ··································~·····~···ffil••••.··w······· oo
+ I
~ ~
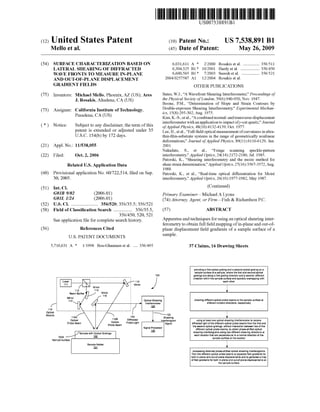
8. FIG. 4
FIG. 4A FIG. 48
Grating
r
x,,u, 0----~-~LC1-;-! I~ 8·
A I I 1
IT'
I I
X3,U3
110B
Optical
Probe Beam
I I
I I
I I
I I
I I
~
~s = u2 sine
Optical
m=+ll 1
(H~
Probe Beam
410
Diffracted
Probe Light
420
Diffracted
Probe Light
110A
FIG. 4C
..---..........,
' '
/ a " ·····' a '
r~·~tt--··~.:.~.l~1~ :,___ - ··.. ~
····.. ,
'...... ··:.,, u3
~S = u3 (1+cos8)
~
7J).
•
~
~
~
~
=~
~
~
N
~Cl
N
0
0
0
rFJ
=-('D
('D
.....
Cl
0
.....
....Cl
d
rJl
-....l
u.w
00
Oo
C
""""'
=""""'
9. U.S. Patent
'0
•
(!)
u:
"0
(])
.......
u
roI...
;t::
0
May 26,2009 Sheet 7 of 16
~
~ ~ rJl
~ ' .......
'
;.<
lrol
:";
1.saI
1.
: ........
I 0...I
0
I
I
I
l
I
I
' :
~
·~
!
I
' II
rJl
I •
I ' . '.1 0l
--------.... - - --------· u
.......
..c
0)
:.:::i
(])
.0
eo.._
C")
0
.......
- ro
CU<D<(
.~ a:l 0
O.<D..--
o.o..--
eo.._
'
I
0~
I
.
~ <l~
I :
I
I I
0...
,,
____ (J_ ___ ~
--1-- u
US 7,538,891 Bl
a:l
.......
.......
N
<(
.......
.......
N
10. U.S. Patent May 26,2009 Sheet 8 of 16 US 7,538,891 Bl
FIG. 6A-1
CGS Lateral Shearing inteferometry:
Measurement Sensitivity to Changes in Surface Slope
Q) 0.9
.
C)
i
---·······---Modified CGS slope sensitivity@ 633nm
using a 12001ine/mm diffraction grating1: 0.8ItS 1.. .J: Q)
0.7 ~ ~~
u
"Q)
1..
,----
Q. 0 0.6 I··
----Modified CGS slope sensitivity@ 316.5nm
using a 24001ine/mm diffraction grating
0
C/)
Q)
(.)
.jg
::J
C/)
~0
Q)
0.5 C)
1:
·······Conventional CGS slope sensitivity
·;:: 0.4 1
-0.3 1..
Q)
'Q. 0.2
0.1
0
0 0.05 0.1 0.15 0.2 0.25 0.3 0.35 0.4 0.45 0.5
1.00
0.90
Q) 1.. 0.80
C'lQ)
1: " 0.70ItS 1..
J: 0 0.60
u Q)
.: g' 0.50
ItS ·;:: 0.40
.=-C/) ~ 0.30
?!- Q. 0.20
0.10
0.00
Shearing Distances (mm)
FIG. 6A-2
CGS Lateral Shearing inteferometry:
Effective Measurement Sensitivity to in-plane Strain
----···········Modified CGS strain sensitivity@
I
633nm wavelength using a
' 12001ine/mm diffraction grating
----Modified CGS strain sensitivity@
316.5nm wavelength using a 2400'..v
~
'
line/mm diffraction grating
....., f"'"'-._
~...___
r----
~--..-...nn-......_._....,._
~.........~..............,.
~~ ~-..-....-..~.........................
0 0.05 0.1 0.15 0.2 0.25 0.3 0.35 0.4 0.45 0.5
Shearing Distance s (mm)
11. U.S. Patent
Q)
Cl
1:
II) '-
.s:::: Q)
U-c
'-
~0
0 Q)
(j) ~
Q) ·;::
u ....
II) '-
't: Q)
:::l c.
UJ
<!.
Q) '-
ClQ)
I:"C
II) '-
.s:::: 0
u Q)
1: Cl
·- 1:
II) ·-
J:;J:::
UJ '-Q)
<!. c.
May 26,2009 Sheet 9 of 16 US 7,538,891 Bl
FIG. 6B-1
CGS Lateral Shearing inteferometry:
Measurement Sensitivity to Changes in Surface Slope
1
0.9 +-<L+-.~··.------1 ·~-~~-~~-~~--Modified CGS slope sensitivity@ 633nm
0.8 t · using a 12001ine/mm diffraction grating
I ,
0.7 r';.···················· ----ModifiedCGSslopesensitivity@
0.6 1 •• 316.5nm using a 24001ine/mm diffraction
I ,
0
·
5
t .......C;~i~Jlntional CGS slope sensitivity
0.4 I ·,
00.32 '>('..~ ~,_,____~----,-------,-------,--------,----
. +-~,~'-~~~.~~-.+-----+-~--+-~
0.1 +·······················'·~---""·····cJf2_?::::_~~:.::::::::---~~~ --~~~~:.::~- ..':"~.:.:~:..:~:
o~~~~~~~~~~~~~~
0.00 2.50 5.00 7.50 10.00 12.50 15.00 17.50 20.00
Grating separation 11 (mm)
FIG. 6B-2
CGS Lateral Shearing inteferometry:
Effective Measurement Sensitivity to in-plane Strain
1.00
0.90
0.80
0.70
0.60
0.50
0.40
0.30
0.20
0.10
0.00
I
I
'
,.......
'.
/ '..., -......
~-Modified CGS strain sensitivity@
633nm wavelength using a
12001ine/mm diffraction grating
-~--Modified CGS strain sensitivity@
316.5nm wavelength using a 2400
line/mm diffraction grating
'"'--
------
-~.............._...,._
~...,,,....__,.._.,uu...__.._..~"'••,~~-.,
ou•uu
·-- ~~-.~~-.-....~~w
0.00 2.50 5.00 7.50 10.00 12.50 15.00 17.50 20.00
Grating separation 11 (mm)
12. U.S. Patent May 26,2009 Sheet 10 of 16 US 7,538,891 Bl
FIG. 7A
p
w
FIG. 78
p
w
13. U.S. Patent May 26,2009 Sheet 11 of 16
0.
co
(!)
i!:
US 7,538,891 Bl
18. r:110 :
Optical
Module
FIG. 13
--~--~:1--~-----y~r-----------------~nJi;!,
Mirror
114
Mirror
116
Beam
Splitter
Optical Shearing
Interferometer
120
_ _ _ _ _ _ ...J
110A
Optical
Probe Beam
103
Diffracted
Probe Light
110B
Optical
Probe Beam
Sample with Optical Gratings
102
Sample Holder
101
~ 122
Optical Shearing
Interferometer
120B
I
I
I
I
--, I
I I
I I
~~__/ j I
122B ttI
Shearing
Shearing
lnterferogram
Signal
lnterferogram I Signal Processor
Signal 130
~
00
•
~
~
~
~
=~
~
~
N
~Cl
N
0
0
0
rFJ
=-('D
('D
.....
....Cl
0
.....
....Cl
d
rJl
-....l
u.w
00
Oo
C
""""'
=""""'
19. US 7,538,891 Bl
1
SURFACE CHARACTERIZATION BASED ON
LATERAL SHEARING OF DIFFRACTED
WAVE FRONTS TO MEASURE IN-PLANE
AND OUT-OF-PLANE DISPLACEMENT
GRADIENT FIELDS
2
obtain surface, slopes, curvatures and other surface topo-
graphical information. Examples of measurable surfaces
include but are not limited to surfaces in various panels and
plates, various substrates and wafers, integrated electronic
circuits, integrated optical devices, opto-electronic circuits,
and micro-electro-mechanical systems (MEMs), flat panel
display systems (e.g., LCD and plasma displays), photoli-
thography masks, pellicles and reticles. Optical shearing
interferometry can be implemented in various configurations,
This application claims the benefit of U.S. Provisional
Application No. 60/722,514 entitled "combined normal &
transverse gradient interferometer" and filed on Sep. 30,
2005, which is incorporated by reference as part ofthe speci-
fication of this application.
BACKGROUND
10 including a coherent gradient sensing (CGS) system using
optical gratings to cause the shearing of the wavefront (see,
e.g., U.S. Pat. No. 6,031,611), a radial shear interferometers,
wedge plate in a ai-lateral shearing interferometer (see, e.g.,
U.S. Pat. No. 5,710,631) and others.
This application relates to measurements ofsurface slopes 15
and other topological properties of surfaces in flat panels,
substrates, and wafers, and more particularly, to optical tech-
niques and systems for such measurements.
Optical interferometry uses optical interference between
two at least partially mutually coherent beams to extract 20
information embedded in the wavefront ofat least one ofthe
SUMMARY
This application describes, among others, techniques and
apparatus for implementing a lateral shearing interferometer
to provide whole field mapping of in-plane and out-of-plane
displacement field gradients ofa sample surface ofa sample.
In one implementation, symmetric pairs of normally dif-
fracted wave fronts, generated by a specimen grating, are
directed to a lateral shearing interferometer where gradient
beams as an optical probe beam which interacts with a target
whose information is under measurement. Various coherent
optical measurement techniques have been proposed for mea-
suring deformation fields on loaded and deforming solids
with increased sensitivity, owing to the coherence property of
lasers [1, 2], while several interferometry techniques, such as
Moire interferometry and speckle pattern interferometry, are
widely employed in experimental stress/strain analysis [3, 4].
The suitability ofthese and other techniques for optical mea-
surements depends on the optical properties of the object
undermeasurement andthe nature ofthe mechanics problems
under investigation. The application of such techniques in
deformation analysis often requires numerical differentiation
25 mapping of the individual diffracted wave fronts is con-
ducted. Wave front shearing is achieved and a series ofphase
shifted fringe patterns is acquired using a CCD imaging sys-
tem with integrated phase shifting diagnostics. Phase
unwrapping algorithms can be applied and de-coupling ofthe
30 out-of-plane and in-plane displacement field gradients is
achieved through linear combinations of specific phase map
of discretely-sampled displacement data which may intra- 35
duce significant error magnification problems. In addition,
many ofthese methods can be undesirably sensitive to rigid-
body rotations and susceptible to ambient vibrations.
One of optical interferometry techniques for optical mea-
surements is wave front shearing interferometry [5] for per- 40
forming optical differentiations ofwave-front phase by using
self-referencing common-path interference between two lat-
erally sheared wave-fronts. A typical optical shearing inter-
ferometer produces and interferes two spatially shifted repli-
cas of the same, usually distorted wavefront of an optical 45
beam along a direction transverse to the direction of propa-
gation of the wavefront. The interference between the spa-
tially shifted and replicated wavefronts generates an interfer-
ence pattern representing the spatial distribution of slopes in
the wavefront. In an effect, the shearing interferometry per- 50
forms an optical differentiation ofthe wavefront and thus can
be used to reduce the numerical differentiation ofdiscretely-
sampled displacement data and thus reduce errors associated
with such numerical differentiation. Another feature of opti-
cal shearing interferomety is measurement of a deformation 55
ofone point ofthe wavefront to another ofthe same wavefront
separated by the shearing distance, i.e., the distance between
the two interfering replicas of the same wavefront. In this
sense, an optical shearing interferometer is a selfreferencing
interferometer and thus provides insensitivity or immunity to 60
vibrations and other perturbations present at the wafer or
device under measurement.
pairs.
In another implementation, a method for optically charac-
terizing a surface is described to include providing a first
optical grating and a second optical grating on a sample
surface of a sample, where the first and second optical grat-
ings are along a first grating direction and a second, different
direction within the sample surface and spatially overlapping
with each other. This method further includes directing a
plurality of different optical probe beams to the sample sur-
face at different incident directions, respectively; using at
least one optical shearing interferometer to receive diffracted
light ofthe different optical probe beams from the first and the
second optical gratings, without interaction between two of
the different optical probe beams, to obtain phase-shifted
optical shearing interferograms along two different shearing
directions at each location that are perpendicular to a normal
direction ofthe sample surface at the location; and processing
obtained phase-shifted optical shearing interferograms from
the different optical probe beams to generate a map of field
gradients for bothin-plane and out-of-plane displacements on
the sample surface.
In another implementation, a system for optically charac-
terizing a surface is described to include a sample holder for
holding a sample having a sample surface on which a first
optical grating and a second optical grating are formed to
spatially overlap with each other and along a first grating
direction and a second, different direction within the sample
surface; an optical module to produce and direct a plurality of
different optical probe beams to the sample surface at differ-
ent incident directions, respectively; an optical shearing inter-
ferometer module to receive diffracted light of the different
optical probe beams from the first and the second optical
gratings, without interaction between any two ofthe different
In implementations, a shearing interferometer may be con-
figured to produce a shearing interference pattern from either
of the optical transmission of the probe beam through the
surface or from the optical reflection ofthe probe beam by the
surface. The shearing interference pattern is then processedto
65 optical probe beams, to obtain phase-shifted optical shearing
interferograms along two different shearing directions at each
location that are perpendicular to a normal direction of the
20. US 7,538,891 Bl
3
sample surface at the location; and a signal processor to
process obtained phase-shifted optical shearing interfero-
grams from the different optical probe beams to generate a
map of field gradients for both in-plane and out-of-plane
displacements on the sample surface.
4
FIG. 13 shows an apparatus based on the design in FIG. lA
where two optical shearing devices are provided for shearing
at two different shearing directions.
DETAILED DESCRIPTION
Many shearing interferometers are limited to obtaining
surface slope fields, i.e. gradients of the out-of-plane dis-
placement field, and thus do not measure in-plane displace-
ment gradient components, stains and slopes. In-plane dis-
placements can be measured using other techniques. One
example is the Moire interferometer which uses crossed-line
diffraction grating on the specimen surface to obtain optical
interference of symmetric diffraction orders oftwo coherent
and symmetric optical probe beams interacting with each
grating to generate a Moire fringe pattern. The Moire fringe
pattern includes information on in-plane displacements along
a respective grating direction of the grating and is digitally
processed to perform numerical differentiation of the
In yet another implementation, a system for optically char-
acterizing a surface is described to include a sample holder, an
optical module, a beam control mechanism, an optical shear-
ing device; an optical device, and an optical imaging device.
The sample holder is used to hold a sample having a sample 10
surface on which a first optical grating and a second optical
grating are formed to spatially overlap with each other and
along a first grating direction and a second, different direction
within the sample surface. The optical module is used to
produce and direct different optical probe beams to the 15
sample surface at different incident directions, respectively.
The beam control mechanism is used to control the different
optical probe beams to prevent optical interference between
two different optical probe beams at the sample surface. The
optical shearing device is placed in an optical path of dif-
fracted light ofthe different optical probe beams from the first
and the second optical gratings on the sample surface to
interact with received diffracted light of each optical probe
beam and to produce a replica of the diffracted light that is
spatially shifted by a shearing distance along a direction
parallel to the sample surface and the optical shearing device
20 in-plane displacements to compute the gradients of the out-
of-plane displacement field.
The present lateral sharing techniques described in this
application use two optical diffraction gratings along two
different grating directions on a sample surface ofa sample to
25 reveal the in-plane deformation of the sample surface. A
diffraction beam from one optical probe beam from each
optical grating is directed into an optical shearing interferom-
eter to perform lateral shearing on the wavefront of the dif-
fraction beam without optically interfering with a diffraction
is operable to adjust a phase shift between the diffracted light
and the replica. The optical device is to spatially overlap the
diffracted light and the replica output from the optical shear-
ing device to produce phase-shifted shearing interferograms
from interference of the diffracted light and the replica. The
optical imaging device is used to capture images ofthe phase-
shifted shearing interferograms.
The details of one or more embodiments of the invention
are set forth in the accompanying drawings and the descrip-
tion below. Other features, aspects, and advantages of the
invention will become apparent from the description, the
drawings, and the claims.
BRIEF DESCRIPTION OF DRAWINGS
FIG.lA shows an example ofan optical shearing apparatus
for obtaining whole field mapping of in-plane and out-of-
plane displacement field gradients of a sample surface.
FIG. lB illustrates an operation flow of the apparatus in
FIG.lA.
FIGS. 2A, 2B, 3, 4A, 4B, 4C and 5 illustrate operations of
the apparatus in FIG. lA where the optical shearing device is
implemented by using a coherent gradient sensing (CGS)
device having two shearing gratings.
FIGS. 6A and 6B show measurements obtained in an appa-
ratus based on the design in FIG. lA where the optical shear-
ing device is implemented by using a coherent gradient sens-
ing (CGS) device having two shearing gratings.
FIGS. 7A and 7B show two sample loading configurations
used for testing an apparatus based on the design in FIG. lA
where the optical shearing device is implemented by using a
coherent gradient sensing (CGS) device having two shearing
gratings.
FIGS. SA, SB, SC, SD, 9, lOA, lOB, llA, llB, llC and
llD shows various measurements using the sample loading
configurations in FIGS. 7A and 7B in an apparatus based on
the design in FIG. lA where the optical shearing device is
implemented by using a coherent gradient sensing (CGS)
device having two shearing gratings.
FIG. 12 shows a polarization coding design in one imple-
mentation for the apparatus in FIG. lA.
30 beam of another optical probe beam from the same optical
grating. Because the wavefront of such a diffraction beam is
distorted by both in-plane displacements and out-of-plane
displacements, an optical shearing interferogram by the opti-
cal sharing interferometer has information on both the out-
35 of-plane and in-plane displacement field gradients. The out-
of-plane and in-plane displacement field gradients in this
optical shearing interferogram are coupled together and can-
not be separated by processing the optical shearing interfero-
gram alone. To separate out-of-plane and in-plane displace-
40 ment field gradients, shearing interferograms from at least
two different selected optical probe beams are obtained from
each ofthe two gratings on the sample surface and the sharing
interferograms from the two gratings are correlated in the
signal processing to decouple the out-of-plane and in-plane
45 displacement field gradients. The decoupled out-of-plane and
in-plane displacement field gradients are then used to con-
struct a whole field mapping of in-plane and out-of-plane
displacement field gradients of the sample surface.
FIG. lA illustrate an exemplary optical lateral shearing
50 apparatus 100 for implementing the present techniques. FIG.
lB shows an operation of the apparatus in FIG. lA.
In this example, an optical module 110 is provided to
produce and direction optical probe beams to a sample 102
held by a sample holder or stage 101. The sample 102 has a
55 sample surface 102A that is processed to have two spatially
overlapped optical diffraction gratings along two different
grating directions. For example, one gratings can have grating
lines perpendicular to grating lines ofthe other grating so that
the grating direction perpendicular to the grating lines in one
60 grating is perpendicular to the grating direction of the other
grating. For each grating, the optical module 110 directs at
least two different optical probe beams to the sample 102 to
measure the sample surface 102A. Hence, the optical module
110 produces at least four different optical probe beams for
65 measuring the sample surface 102A. As an example, two
different optical probe beams llOA and HOB for one of the
two gratings are illustrated and are directed to the sample in a
21. US 7,538,891 Bl
5
plane defined by the normal direction of the sample surface
102A and the grating direction of the respective grating. For
convenience of subsequent data processing, each optical
probe beam is directed at an incident angle to the respective
grating to produce a respective diffracted beam that is normal
6
using a an imaging system (e.g., a CCD array) with integrated
phase shifting diagnostics and phase unwrapping algorithms
are applied through a post processing procedure in order to
obtain phase maps of each optically differentiated phase
front. De-coupling ofthe out-of-plane and in-plane displace-
ment field gradients is subsequently achieved through a linear
combination of specific phase map pairs.
FIGS. 2A and 2B illustrate an implementation ofthe appa-
to the sample surface 102A. For example, the first order
diffraction beam can be in the normal direction ofthe sample
surface 102A. The two optical probe beams (e.g., HOA and
HOB) can be directed symmetrically from two opposite sides
of the normal direction of the sample surface 102A and at a
common incident angle with respect to the normal direction.
The two optical probe beams are in a plane defined by the
grating direction of the respective optical grating and the
normal direction to generate two diffracted beams, respec-
tively, at the normal direction.
10 ratus 100 in FIG. 1A. A Cartesian coordinate system x1, x2
and x3 is used where x1 and x2 are two orthogonal in-plane
directions and x3 is the direction perpendicular to the plane
defined by x1 and x2. The optical shearing interferometer 120
includes an optical shearing device 210, an imaging lens 220,
In FIG. 1A the optical module HO can include a laser H1
to produce a laser beam which is split into the different optical
probe beams that are coherent with one another. In other
implementations, the optical module may include two or
more lasers that are phase locked to one another to produce
the different optical probe beams. In the illustrated example,
15
a spatial filter 220 with one or more filtering apertures, and an
imaging array 240 at an imaging plane to capture the filtered
image and to produce interferogram signals 122 to be pro-
cessed by the signal processor 130 shown in FIG. 1A. The
a beam splitter H2 splits the laser beam from the laser HO
into the optical probe beams HOA and HOB. Optical ele-
ments, such as mirrors H3, H4 and HS, can be used to
control and direct the optical probe beams to the sample 102
20
optical hearing device 210 performs the spatial shearing on
the wavefront ofthe diffracted probe light 103 and the imag-
ing lens 220 images the optical output ofthe shearing device
210 on the spatial filter 230. One or more apertures in the
spatial filter 230 filter one or more selected regions in the
at directed incident angles. In some implementations, an opti-
25 interference imaging field to be capturedby the imaging array
240 at the imaging plane. In this example, a CGS shearing
device with two parallel optical gratings 2HA and 2HB is
used as to perform the lateral sharing ofeach diffracted probe
beam. Examples of CGS shearing devices are described in
cal beam control mechanism can be used as part ofthe optical
module HO to control different optical probe beams to illus-
trate the sample 102 at different times so two different optical
probe beams do not appear at the sample 102 at the sample
time to interfere with each other. Optical shutters, for
example, may be used as this optical beam control. In other
implementations, the optical beam control mechanism can
control optical polarizations oftwo optical probe beams inter-
acting with the same grating at the same time to be orthogonal 35
with each other to avoid or minimize optical interference of
the two optical probe beams.
30 U.S. Pat. No. 6,031,611, which is incorporated by reference
in its entirety as part of the specification of this application.
The sample surface is fabricated with ftwo sets of mutually
perpendicular grating lines oriented parallel to orthogonal x1
An optical shearing interferometer 120 is used in the appa-
ratus 100 to receive and process the diffracted probe light of
each optical probe beam. One or more mirrors H6 or other 40
optical elements can be used to direct the diffracted probe
light 103 into the optical shearing interferometer 120. The
diffracted probe light 103 can be in the same side of the
sample surface 102A as illustrated or be a transmission beam
on a side ofthe surface 102Athat is opposite to the side where 45
the respective probe beam is directed to the surface 102A. The
optical sharing interferometer 120 can be a CGS or a different
shearing device and includes an image device such as a sens-
ing array to convert the shearing interference pattern into a
sharing interferogram signal 122. A signal processor 130, 50
such as a computer, is used to process the signal122 and other
interferogram signals 122 from other optical probe beams to
produce the whole field mapping ofout-of-plane and in-plane
displacement field gradients.
The apparatus 100 in FIG. 1A an be used to achieve simul- 55
taneous whole field mapping of in-plane and out-of-plane
displacement gradients. In one implementation, two pairs of
obliquely incident probe beams can be used to illuminate a
fine pitch crossed-line diffraction grating attached to the
sample surface 102A ofthe sample 102 to produce +1 and -1 60
diffraction order beams for measuring the sample surface
102A. Unlike a Moire Interferometer, symmetric pairs of 1st
order normally diffracted wave fronts are prevented from
mutually interfering and instead are directed to the lateral
shearing interferometer 120 where gradient mapping ofeach 65
individual wave front is conducted. A series offringe shifted
interferograms is acquired for each independent wave front
and x2 axes in the plane ofthe sample surface 102A.
As illustrated, a pair of obliquely incident rays HOA and
HOB, representing wave vectors of the expanded and colli-
mated laser beams, propagate within the x2 -x3 plane and
intersect the sample at an angle 8 with respect to the surface
normal for the sample surface 102A. A second pair of sym-
metrically incident beams (not depicted) having wave vectors
propagating in the orthogonal x1-x3 plane, are also directed to
intersect the sample at the same angle 8 with respect to the
surface normal. The specimen grating lines oriented parallel
to the x1 axis diffract the incident beams with wave vectors in
the x2 -x3 plane and the grating lines oriented parallel to the x2
axis diffract the second pair ofilluminating beams with wave
vectors in the x1-x3 plane. In both cases, sharp diffraction
orders arise which propagate within each respective plane of
incidence along directions 8 m in accordance with the general
grating equation
(1)
where 8,respects the angle ofincidence as depicted in FIG. 1,
m is an integer (0,+/-1,+/-2, ... +1-k) related to a specific
diffraction order of interest, A represents the laser wave-
length, and d equals the pitch of the undeformed diffraction
grating.
The optical configuration for the apparatus in FIG. 2A can
be initially aligned using a master grating element and the
incidence angle of both illuminating beam pairs is then pre-
cisely adjusted to satisfY the illumination angle condition
22. US 7,538,891 Bl
7
(2)
such that that four symmetric j'h order wave fronts emerge
normal to the specimen surface in accordance with (1). For
example, the diffracted probe light in the primary 1st order
incidence angles (i.e., the +1 and -1 orders) can be used in
some implementations. In general, any pair of symmetric
diffraction orders may be selected provided that these diffrac-
tion orders exist for a given combination of source wave
length and specimen grating pitch. In an effort to satisfy
condition (2), the symmetric pairs of normally diffracted 1st
order beams are allowed to temporarily interfere, one pair at
a time, in a moire interferometer arrangement during this
initial alignment process. In a properly aligned configuration,
two pairs ofnormally diffracted beams emerge normal to the
specimen surface; (1) the (u1 ,u3 ) beam pair, derived from
diffraction of the illuminating beams having incident wave
vectors within the x1 -x3 plane and (2) the (u2 ,u3 ) beam pair,
derived from diffraction of the illuminating beams having
their incident wave vectors within the x2 -x3 plane. When the
symmetric (m=±1) diffraction orders comprising either the
(u1 ,u3 ) and (u2 ,u3 ) beam pairs are allowed to mutually inter-
fere, a complete cancellation of the out-of-plane (u3 ) phase
contribution results and the generated fringe patterns corre-
spond to whole field maps of displacement fields along the
two orthogonal in-plane directions u1 andu2 , respectively [3].
The optical elements are then precisely adjusted until u1 and
u2 null field fringe conditions are independently achieved at
which point the precise establishment of the condition (2) is
achieved for bothilluminating beam pairs. The master grating
element is subsequently removed andreplaced by a test speci-
men (i.e., the sample 102) containing an attached replica
grating obtained from the very same master grating. The test
specimen is then precisely adjusted such that the specimen
surface coincides with the same location in space which was
previously occupied by the master grating element.
In the diffracted wave front shearing arrangement, the (u1 ,
u3 ) and (u2 ,u3 ) beam pairs are directed to a lateral shearing
interferometer. Mutual interference of the normally dif-
fracted wave fronts is prevented through a series of optical
shutters and wave front shearing ofeach individual diffracted
wave front is then systematically conducted along a specific
axis of interest. When subjected to mechanical loading con-
ditions, the test specimen will naturally experience in-plane
and out-of-plane deformations. Non uniformities ofthe grat-
ing pitch will induce optical perturbations within the initially
planar diffracted wave fronts which are superimposed with
any wave front perturbations induced by out-of-plane dis-
placements (u3 ). Propagating wave fronts therefore contain
coupled phase information about the combined state ofdefor-
mation at the specimen surface. A series of fringe shifted
interferograms is acquired for each diffracted wave front
using an imaging system with integrated phase shifting diag-
nostics and phase unwrapping algorithms are applied through
8
results and the generated fringe patterns correspond to whole
field maps ofhorizontal u1 and vertical u2 displacement fields
[3]. In the examples shown in FIGS. 1A, 2A and 2B, the
interference betweentwo diffracted beams from two different
probe beams is prevented and each diffracted beam is opti-
cally sheared by the optical shearing device 210 without
optically interfering with another diffracted beam ofa differ-
ent optical probe beam. As such, in the examples shown in
FIGS. 1A, 2A and 2B, each fringe pattern represents a gradi-
10 ent mapping of the associated optical wave front which con-
tains information about the combined state of in-plane and
out-of-plane displacement gradients at the specimen surface.
De-coupling ofthe respective displacement gradient terms is
then achievedby the linearcombination ofspecific phase map
15 pairs through a post processing procedure. The diffracted
wave front shearing technique can be implemented into an
existing moire interferometry set up as a complementary tool
in experimental stress/strain analysis.
In the examples described this application, a CGS lateral
20 shearing interferometer is used for conducting the wave front
shearing operation on the diffracted wave fronts [10,11] as an
example. A CGS wave front shearing scheme can be advan-
tageously used to provide robust and continuous sensitivity
adjustment, and the flexibility to spatially differentiate along
25 any particular direction of interest in some application. The
implementations ofthe apparatus and techniques described in
this application are not limited to use of a CGS shearing
device. Other non-CGS lateral wave front shearing devices
can also be used to implement the apparatus and techniques
30 described in this application. Some examples of non-CGS
shearing devices are described in [20] and in U.S. Patent
Publication No. US2004/0257587A1 dated Dec. 23, 2004.
The entire disclosure ofU.S. Patent Publication No. US2004/
0257587A1 is incorporated by reference as part ofthe speci-
35 fication of this application.
FIG. 2B illustrates the working principle ofthe CGS lateral
shearing operation in the apparatus in FIG. 2A. The specimen
is illuminated by four, oblique, expanded, and properly col-
limated laser beams. Among the multiple diffracted beam
40 paths, only the two illuminating beams with wave vectors k1
and k2 in the x2 -x3 plane are shown for the sake of clarity.
Incident beams intersect the specimen at an angle 8 and are
subsequently diffracted by the reflective grating G0 on the
sample surface. The 1storderdiffractedbeams emerge normal
45 to the specimen surface and are directed to the Coherent
gradient Sensing (CGS) lateral shearing interferometer [10].
A ray within the first-order diffracted wave front, emanat-
ing from a point a on the specimen surface, is transmitted
through the first CGS grating G1 (211A) and diffracted at the
50 second CGS grating G2 (211B). A second ray, which ema-
nates from a neighboring point bat a distances on the speci-
men surface is diffracted at the first CGS grating G1 and
transmitted through the second CGS grating G2 . Both rays
then merge and propagate through the imaging system and
55 aperture filter. Following this process, which can be extended
to all points on the sample surface, two identical and laterally
sheared wave fronts interfere to create a fringe pattern at the
image plane I (240) which corresponds to a displacement
a post processing procedure in order to obtain phase maps of
each optically differentiated phase front. De-coupling of the 60
out-of-plane and in-plane displacement field gradients is sub-
sequently achieved through a linear combination of specific
phase map pairs.
gradient map of the diffracted optical wave front.
For the sake of clarity and without any loss of generality,
we will initially considerthe case ofa normally diffracted (u2 ,
u3 ) beam pairwhich is laterally shearedalong the x2 direction,
as depicted in FIG. 2B. Results of the derivation are later
extended to the (uu u3 ) beam pair and to the wave frontIn an in-plane moire interferometer, the symmetric (m±+1)
diffraction orders comprising the (u1 ,u3 ) and (u2 ,u3 ) beam
pairs are allowed to mutually interfere in which case a com-
plete cancellation ofthe out-of-plane (u3 ) phase contribution
65 shearing, parallel to the x1 direction, of either beam pair.
As depicted in FIG. 3, the lateral shearing distance s is
equivalent to the physical distance between two arbitrary
23. US 7,538,891 Bl
9
neighboring points a and b, located on the specimen surface.
From a ray optics perspective, two rays of light which origi-
nate at each ofthese points are merged after passing through
the pair ofparallel CGS instrument gratings. The interference
problem is analyzed by modeling the changes in optical path
length which result due to the displacements ofpoints a and b
and the associated phase change at corresponding points on
the laterally shearedinterfering wave fronts. Since point a and
point b represent arbitrary points on the sample surface, the
optical path length descriptions apply to any pair of neigh-
10
boring points on the specimen surface and the extension to
full field solution naturally follows.
Neglecting all common path phase terms and coordinate
scaling effects introduced by the imaging optics, the two 15
laterally sheared, interfering wave fronts may be modeled as
plane waves and expressedina symmetric form inaccordance
with the coordinate description contained in FIG. 3.
20
(3)
(4)
10
and can therefore only approximate the intensity at the mid
point (x1 , x2 ) in the limit that the shearing distance s2 is made
sufficiently small. The intensity of the resulting interfero-
grams is modulated by a relative phase term
+!- . 2n: [ ( s2 ) ( s2 )]
1'1'2,3 ),2 = ,~r;), T LlS Xj, X2 + 2' t -LlS Xj, X2- 2' t
(7)
which is proportional to the relative changes in optical length
between neighboring points a and b on the specimen surface
and where we have adopted the symbolic notation
where a=1,2 and EB=1,2 in order to denote the wave front
shearing operation ofeither m=±1 diffraction order compris-
ing the normally diffracted (uwu3 ) wave fronts with respect to
25 the x13
direction.
Here, A and B represent the plane wave amplitudes, k=2Jt!A. is
the wave number, x3 represents the propagation distance to
the image plane, t represents time, and the phase factor
30
35
FIGS. 4A, 4B and 4C depict how the optical path lengths of
the normally diffracted wave fronts are altered as an arbitrary
point a on the specimen surface shifts to a new location a' in
the transverse direction and a" in the normal direction. A
similar operation occurs to the displacements at the neighbor-
ing point b located at coordinate
Assuming that the optical path from the light source to the
represents changes in optical path length induced by the dis-
placements which evolve over time at each ofthe neighboring
points a and b which are separated by the lateral shearing
distance s2 along the x2 direction.
The interference pattern is derived by taking the time aver-
aged intensity of the combined plane wave fields given by
(5)
40 specimen is the same for every ray within an incident beam,
the change ofpath length (llS) ofa diffracted ray with respect
to an obliquely incident ray at each neighboring point is given
by
where the symbol *denotes the complex conjugate operation, 45
Ea and E6 represent the combining plane wave fields, and the
optical constants of proportionality have been suppressed.
Substituting for the interfering plane waves from (3) and (4)
into (5) leads to the familiar two beaminterference expression
50
/(x1 , x2, t) = (6)
Ia + h + 2~cos~ U~nc(lls(x1 , x2 + ~· r)- llS(x1, x2 - ~· r)]
55
where Ia =EaEa and I6=E6 E6 represent the steady state
background intensity ofeach interfering beam. Note that the
time averaged intensity relation is expressed here as a limit
due to the fact that the quantity (l)is actually a function ofthe 60
optical information collected at neighboring points
lls(x1 , x2 + ~· r) =
(8)
point a
lls(x1 , x2 - ~· r) =
(9)
point b
where the ± symbols correspond to the individual m=±l
diffracted orders which comprise the (u2 ,u3 ) beam pair. Simi-
lar optical path length expressions apply for the (uvu3 ) beam
pair with pairs of neighboring points which are laterally dis-
placed in the x2 direction, and for pairs ofneighboring points
within either beam pair, which are laterally displaced in the x1
(x1,x2- ~)and (x1,x2 + ~) 65 direction. Substituting the optical path length expressions
(8,9) into (7) leads to an explicit form of the relative phase
term given by
24. US 7,538,891 Bl
11 12
+/- . 2n:{( ( S2 ) ( S2 ))
1'1'2,3),
2
=,~r;),-:f U3XJ,X2+2,t -U3XJ,X2-
2
,t (1+cos0)±
(10)
where the± symbols correspond to the respective m=±1 dif-
fracted orders and also reflect the fact that the symmetrically
diffracted wave fronts experience equal and opposite phase
changes in response to a given transverse displacement.
by the factor
10
The intensity of the resulting interferograms is therefore
modulated by a linear combination of relative differential 15
displacements which take place between pairs ofneighboring
points on the specimen surface. Clearly, if the shearing dis-
tance s is made to equal zero, then there are no optical path
lengthdifferences betweenthe interfering wave fronts and the
20
interferometer is rendered completely insensitive. On the
other hand if s is too large, the interferometer will respond to
differential displacements across a broad characteristic
length on the specimen surface and fail to accurately capture
local displacement gradient behavior. We are therefore pri- 25
marily interested in the behavior ofthe lateral shearing inter-
ferometer in the limit where s approaches zero, yet remains
finite, in order to accurately capture displacement field gra-
dients, i.e out-of-plane slope maps and in-plane strain fields,
30
as a function ofpositionon the specimen surface. Multiplying
and dividing (10) by
can be used to obtain an equivalent derivative form of the
interferometer output as follows:
+!- 2n:{(au3(x1, x2, t)) (au2(x1, x2, t)). }l<l>23) =- (1 +cos0)± sm0 =
· '2 A ax2 ax2
(11)
where
35
40
45
50
Similar lateral wave front shearing operation can be
applied to the spatial differentiation of the (u1 ,u3 ) beam pair
along the same shearing direction:
+!- 2n:{(au3(x1,x2,t)) (au1(x1,x2,t)). }1<1>13 ) =- (1+cos0)± sm0 =
· '2 A ax2 ax2
(12)
Similarly, we may also considerlateral wave front shearing
of either diffracted beam pair along the orthogonal x1 wave
front shearing direction as follows:
+!- 2n:{(au3(x1, x2, t)) (au2(x1, x2, t)). }1<1>23 )~ =- (1 +cos0)± sm0 =
· '1 A ax1 ax1
(13)
(14)
All four cases (11 )-(14) may be summarized in a compact
form as follows:
(15)
which denotes spatial differentiation of the normally dif-
fracted (uwu3 ) wave fronts with respect to the x13 direction
now symbolizes optical differentiation of the normally dif-
fracted (uwu3 ) wave fronts with respect to the x13 direction
where a=1,2 and ~=1,2. In practice this simply requires scal-
ing the actual interferometer phase output
55 where a=1,2 and ~=1,2. Equation (15) therefore represents a
total of eight possible phase maps which can be obtained
through the optical differentiation of normally diffracted
wave fronts. Perhaps most importantly, the form of (15)
clearly suggests that de-coupling of the in-plane and out-of-
60 plane displacement gradient terms may be achieved through
the addition or subtraction of symmetric m=±1 phase terms,
provided that a suitable procedure is available for extracting
whole field phase information from each laterally sheared
diffracted wave front. Wave front shearing along other off-
65 axis directions can also be performed.
Phase shifting techniques canbe used to extract whole field
phase information contained within generated interference
25. US 7,538,891 Bl
13
patterns [20]. In quasi-static testing applications, phase shift-
ing of the individual laterally sheared diffracted wave fronts
and their associated interferograms may be executed in a
sequential fashion. Under dynamic test conditions however,
where the phase front evolves rapidly in time, instantaneous
phase shifting schemes can be used to simultaneously capture
all of the phase-shifted interferograms as expressed by (15)
without any significant time lag between measurements. Sev-
eral such dynamic phase shifting schemes have been devel-
oped in related applications and are addressed in the literature
[20].
Phase shifting may be implemented to progressively adjust
the phase separation between the two shifted interfering
wavefronts which cycles or manipulates fringe position on
the specimen's surface under measurement. In one imple-
mentation, a shearing interferometer may be configured to
obtain multiple phased images ofa patterned wafer's surface,
for example at 0, 90, 180, 270 and 360 degrees in phase. The
phase shifting method allows for the wavefront slope to be
measured by calculating the "relative phase" modulation at
each pixel on a detector array that receives the interference
pattern. The phase shifting method also allows for consistent
interpretation of wavefront and specimen slope on a surface
that exhibits changing reflectivity, like those found on pat-
terned wafers. On a patterned wafer surface, each pixel loca-
tion on the specimen may reflect light with a varying degree
of intensity relative to other pixel locations. This may com-
plicate the interpretation of any single shearing interfero-
gram. The phase shifting method in shearing interferometry
can simultaneously increase the accuracy of the slope reso-
lution and allow for accurate interpretation ofinterferograms
on patterned surfaces with a spatially varying optical reflec-
tivity. This is possible in part because the relative phase of
each pixel or location within the shearing interfering pattern
rather than merely the variation in the fringe intensity is
measured.
In implementation ofthe phase shifting, the collected mul-
tiple phase-shifted interferograms are subsequently pro-
cessed by a phase extraction algorithm and a unwrapping
algorithm to accurately interpret the surface slopes embedded
14
interferometric images of the surface at multiple increments
ofshearing distances, it is possible to resolve features smaller
than the effective pixel size ofthe camera or imaging sensing
array being used to sample the interferometric data. In addi-
tion, as described later in this application, the use ofmultiple
shearing distances enables the highly accurate calculation of
the estimated surface topography or nanotopography from
the relative data by a geometric calculation rather than a
standard numerical integration algorithm to compute the
10
actual surface profile.
The phase shifting in a two-grating CGS shearing device
may be achieved by changing the relative position between
the two gratings 211A and 211B. In one implementation, the
15 relative position of the two gratings in the transverse plane
defined by directions xl and x2 may be adjusted while main-
taining the spacing between the two gratings along the x3
direction fixed at a desired constant. A positioning mecha-
nism, such as precise translation stage or a positioning trans-
20 ducer, canbe usedto implement this adjustment ofthe relative
position between the gratings for phase shifting. At least one
lateral position controller may be engaged to one of the two
gratings to cause the lateral change in position. Two lateral
position controllers may be respectively engaged to the two
25 gratings to cause the phase shift. In this implementation, the
two gratings may be maintained to be parallel to each other
with the fixed spacing during the lateral movement. Multiple
shearing interference patterns with different lateral relative
positions between the gratings can be obtained for further
30 processing withphase extractionandunwrapping algorithms.
Alternatively, the relative lateral position between the two
gratings can be fixed and a position control mechanism is
implemented to slightly change the spacing between the two
gratings along the x3 direction by a small amount much less
35 than the desired spacing so the spacing and the measurement
resolution are not significantly affected by the small change.
This small change in the spacing between two gratings
changes the overall phase ofthe shearing interference pattern
produced by the two gratings. In data acquisition, the spacing
40 is adjusted to have different small shifts to obtain different
shearing interference patterns with different phase shifts for
further processing with phase extraction and unwrapping
algorithms.
in the phase-shifted interferograms. Once the phase-shifted
interferograms have been unwrapped, the interpretation of
raw slope data and the derivation of curvature may be
enhanced by statistically fitting a surface polynomial to the
raw slope data. Statistical surface fits, including Zernicke 45
polynomials and Legendre polynomials, may be applied to
raw slope data derived from Patterned Wafers for the purpose
To demonstrate the lateral wave front shearing scheme for
the combined whole field mapping of in-plane and out-of-
plane displacement gradients, a three-step phase shifting pro-
cedure was adopted by inducing a series ofincremental trans-
verse movements ofone CGS diffraction grating with respect
of deriving topography (or nanotopography) and curvature
data.
One property of the shearing interferometry due to its
self-referencing nature is that the resulting shearing interfer-
ence pattern essentially measures the deviations from flatness
50
to the other, through the use of a calibrated PZT actuator.
Three phase shifted interferograms, each offset by a phase
shift increment a, were acquired for each individual wave
front sheared diffraction order. The intensity ofthe interfero-
grams comprising a three-step phase shift sequence may be
ofthe surface under measurement by using the surface itself
as a reference surface. Such relative data on surface height or
flatness may be useful in various applications where the
height or flatness ofa surface is monitored or controlled. For
example, in a chemical mechanical polishing (CMP) process
55
mathematically expressed as
orother surface polishing processes, the relative height across
the surface may be monitored to determine the effectiveness
of the polishing process. A shearing interferometer may be 60
used to monitor the surface flatness and the measurements
may be used to dynamically control the polishing conditionof
the polishing process in real time.
In some implementations, the shearing distance between
the transversely shifted wavefronts that interfere with each 65
other may be adjusted during the measurement process to
improve the resolution and accuracy ofthe data. By capturing
(16)
where the shearing distance factor s has been reintroduced
within the phase term along side <I>(xux2 ,t;s13) in order to
retain a dimensionless phase term and to recapture the fact
that the interferometer output is actually modulated by dif-
ferential displacements. Iix1 ,x2 ,t;s13) represents the intensity
distribution ofeachphase shiftedinterferogram, Ia is intensity
amplitude, Im is the mean intensity level, s13 represents the
general wave front shearing distance along the x13 direction
where ~=1,2, and 11 represents the induced phase step incre-
ment. Phase maps of the individual diffracted wave fronts,
26. US 7,538,891 Bl
15
corresponding to the quantities expressed in (15), are
obtained by applying the three step phase shift algorithm [20]
(17)
_l_tan-ll[1 -COSCY]r /_1 (XJ, X2, t; Sfi)- h (XJ, X2, t; Sfi) jjSfi SlllCY 2/o(XJ, X2, t; Sfi)- /_1 (XJ, X2, t; Sfi) -
/ 1(x1, x2 , t; sfi)
16
-continued
aua(XJ, X2, t) = __A_ {l<!>;;j) -l<!>;;-j) }
axfi 4n(sm0) . 'fi . 'fi
UNWRAPPED m=±l
PHASE TERMS SUBTRACTED
(21)
An inspection of (20) reveals that two independent mea-
surements of the same surface slope component may be
to each sequence ofphase shifted interferograms. The ratio of
the signal intensity amplitude to the mean intensity of the
recorded signals defines the modulation of the phase mea-
10 obtained through lateral shearing of the normally diffracted
beams arising from either the (u1 ,u3 ) or (u2 ,u3 ) beam pairs.
For example, two independent whole field maps of surface
slope
surements in the interference pattern and is given by
15
Ia ~{[1- cosa:](/_1 - /1)}2
+ [sina:(2/o- L1 - /1)f
(18)
r = /,;, = [!_1 + h - 2I0cosa:Jsina: 20 may be generated as follows:
The uncertainty in the quantitative phase measurements
may be represented as
dl
dfl >>-
r
(19)
25
30
where di represents the smallest resolvable intensity change.
Often times the signal modulation may be less than the ideal
value of unity due to unequal beam intensities. Moreover,
there are numerous other noise sources which can affect 35
measurement accuracy such as errors in the mechanical phase
shifting process, nonlinearities in the detection system, sta-
bility ofthe light source, quantization errors in the digital-to-
analog conversion process, mechanical vibration, air turbu-
lence, extraneous ghost fringes, and any wave front slope 40
errors associated with the actual interferometer optics [20].
Once all ofthe aforementioned error sources are considered,
it is more realistic to encounter a phase uncertainty of more
like
7r
dfl>-
50
in actual practice, which is still far more accurate than what is
achieved through the use of manual fringe counting tech-
niques.
45
50
Once the individual whole field phase maps corresponding 55
to the optically differentiated wave fronts (15) are acquired,
the displacement field gradient terms are subsequently de-
coupled through the linear combination of the unwrapped
symmetric (m=±1) phase map pairs in a post processing step
as follows 60
au,(XJ, X2, t) = A {1<1>1+1) + 1<1>1-1) }
axfi 4n(1 + cos0) a.3 'fi a,, 'fi
UNWRAPPED m=±1
PHASE TERMS ADDED
(20)
65
(22)
(23)
In a similar manner, two independent measurements of
may also be obtained through lateral wave front shearing of
either the (u1 ,u3 ) or (u2 ,u3 ) beam pairs along the x2 direction
along with subsequent addition of symmetric phase terms as
follows:
(24)
(25)
The pairs of solutions expressed by (22)-(25) for the sur-
face slope terms
au, au,
- o r -
ax! ax2
do not represent redundant measurements. Instead, each pair
of solutions is uniquely obtained by an independent pair of
orthogonally oriented illuminating beams which sample the
specimen surface from different directions. It should there-
fore be possible to further combine these independent phase
solutions together in orderto achieve greateroverall measure-
ment sensitivity in cases where increased resolution is
desired. This point is further addressed in the next section
where the effective instrument sensitivity is considered.
Whole field mapping ofin-plane gradients and strain fields
is achieved through the subtraction ofsymmetric phase terms
in accordance with (21) as follows:
27. US 7,538,891 Bl
17
(26)
(27)
(28)
(29) 10
(30)
18
{slope change per fringe order} in the limit of shallow beam
angles as EJ---;.0°. A classical wave front shearing interferom-
eter, by comparison, operating on a single normally reflected
beam, generates surface slope isocontours given by
[
au,(XJ,X2,t)l AN
= -, wheref3= 1, 2
axfi 2sfi
(33)
The diffracted wave front shearing technique is therefore
more sensitive to the measurement of surface slopes than
traditional wave front shearing interferometers owing to the
presence of the 1+cos <I> factor in the denominator of (32).
where (30) represents shear strain term Yw obtained by add-
ing the displacement field cross gradient terms (28) and (29).
The following sections discuss effective instrument sensi-
tivity to the measurement of surface slopes and in-plane gra-
dients as a function of shearing distance (s13), source wave
length (A.), and diffraction angle (8).
15
The sensitivity increase results from the fact that surface
slope, as measured using the modified lateral shearing
arrangement, is obtained by combining phase information
from two independent plane wave fronts which indepen-
dently sample the specimen surface. The effect is completely
20
analogous to the manner in which the sensitivity ofa conven-
tional lateral shearing interferometer may be doubled by
inducing a second reflection at the specimen surface. Indeed,
the modified lateral shearing measurement sensitivity value
ofThe process of generating de-coupled displacement field
gradients through the linear combination of phase informa-
tion as expressed by (20) and (21) is analogous to having two 25
independent "virtual" lateral shearing interferometers work-
ing intandem, one ofwhich outputs surface slope information
and a second virtual instrument which yields in-plane dis-
placement gradients. Underthis analogy, we canpostulate the
existence ofa virtual fringe pattern for the decoupled out-of- 30
plane displacement gradient field in accordance with (20) as
follows
(31a) 35
(31b)
Virtual fringe order relationships defining isocontours of
surface slope on the specimen surface are defined by
40
au,(XJ, X2, t) 1 { A }
---'--'--;C-'---'"---'- " - N, 1 = 1, 2
(32) 45
ax; sfi 2(1 + cos0)
where N is an integer representing a 2nN "fringe shift" within 50
the virtual fringe pattern.
The effective instrument sensitivity to changes in surface
slope is seen to range from
55
{slope change per fringe order} at the impractical grazing 60
incidence case, as EJ---;.90°, to
65
{slope change per fringe order} in the limit of very shallow
diffraction angles is identical to the sensitivity of a classical
lateral wave front shearing interferometer operating on a nor-
mally reflected wave front which has suffered a double reflec-
tion at the specimen surface.
We further consider the two independent measurements of
each surface slope component, either
au, au,
- o r -
ax! ax2,
obtained through wave front shearing andphase term addition
ofthe (u1 ,u3 ) and (u2 ,u3 ) beam pairs as expressed by (22-25).
As previously suggested, we may consider adding the two
independent phase measurements together in order to double
the overall measurement sensitivity in cases where increased
resolution is desired. The effective measurement sensitivity
in this case would range from
{slope change per fringe order} at the (impractical) grazing
incidence case, where illumination angles approach 8=90°,
to
{slope change per fringeorder} in the limit of very shallow
illumination angles. In this case the sensitivity amplification
28. US 7,538,891 Bl
19
effect is analogous to the manner in which the sensitivity ofa
conventional lateral shearing interferometer may be qua-
drupled through a series of four reflections of a normally
incident beam at the specimen surface.
A similar approach is taken in order to define the effective
virtual instrument sensitivity to the measurement ofin-plane
displacement gradients. We may postulate the existence of a
virtual fringe pattern for the decoupled in-plane displacement
gradient field in accordance with (21) as follows
(34a)
(34b)
2[3= 1, 2
Virtual fringe order relationships defining isocontours of
in-plane gradients (strains) on the specimen surface are there-
fore defined by
_a_:ua'---(x-;;c1_,-=x2:__,_t) "~{-A-}N, a:= 1, 2; f3 = 1, 2
8xfi Sfi 2sm0
(35)
The effective virtual instrument sensitivity to in-plane gra-
dients (strain) therefore ranges from
{strain change per fringe order} at the (impractical) grazing
incidence case, where the illumination angles approach
8=90°, to oo in the limit of extremely shallow illumination
angles approaching 8=0°, in which case the interferometer is
rendered completely insensitive. As a point of reference,
when operating at an illumination angle of -49.4 degrees,
corresponding to the 1st order diffraction angle ofa
line
1200-
mm
20
actual practice the effective instrument resolution may be
compromised somewhat by spatial noise and the imprecise
registration of phase maps due to rigid body rotations. Care
shouldtherefore be taken to minimize these effects bothwhile
acquiring actual fringe patterns and during the post process-
ing of phase map information.
In the following sections, we further consider the effective
instrument sensitivity to the measurement of surface slopes
and in-plane gradients as a function ofshearing distance (s13),
10 source wave length (A), and specimen grating pitch (d).
In the above discussions, the effective virtual instrument
sensitivities have been considered without any reference to
the frequency (or pitch) of the specimen grating. When con-
sidering the effective instrument sensitivity as defined by (32)
15 and (35), it is important to note the grating pitch d can vary as
Aand 8 are varied in accordance with the illumination angle
condition (2). Hence one cannot arbitrarily vary A and 8
while assuming a fixed specimen pitch d.
The effective instrument sensitivity to changes in surface
20 slope (32) may be recast in terms of the specimen grating
pitch (d) through a simple substitution of the illumination
angle condition (2) to yield the general form
25
30
(36)
where j=±1,±2, ... ±n corresponds to the specific diffraction
orders employed in the diffracted wave front shearing
arrangement (typically j=±1).
The upper graph in FIG. 6A displays surface slope sensi-
35 tivity curves plotted as a function ofshearing distance s13•The
curves displayed in FIG. 6A can represent a lateral wave front
shearing interferometer used to conduct gradient mapping of
diffracted wave fronts and is useful for gauging whether the
shearing distance s13, required to achieve desired instrument
40 sensitivity, is suitably matched to the characteristic lengths
within a given experimental application. The arrow in the
figure highlights the trend ofincreased instrument sensitivity
as we shift from case 1 to case 3. The dashed black (highest)
curve corresponds to conventional wave front shearing of a
45 single normally reflected beam of wave length 633 nm. The
solid red, (middle) curve corresponds to the effective instru-
ment sensitivity of the diffracted wave front shearing tech-
nique using 1st order normally diffracted wave fronts gener-
grating with a source wavelength ofA=633 nm, the effective
instrument sensitivity is already at -76% of its theoretical 50
limiting value. Hence, it is immediately evident that there are
diminished returns from the use offiner pitch gratings requir-
ing more extreme diffraction angles.
ated by a
1200line
mm
Although the virtual in-plane gradient interferometer out-
put has no direct wave front shearing counterpart to which it 55
can be directly compared, it is of interest to note that the
effective instrument sensitivity to a unit change in slope is
equal in magnitude to the fundamental in-plane displacement
sensitivity of an in-plane moire interferometer and other dif-
fraction grating based interferometers such as the transverse 60
displacement interferometer (TDI) [21] and the variable sen-
sitivity displacement interferometer (VSDI) [22].
The sensitivity limits presented here for surface slope and
in-plane gradient measurements as captured by (32) and (35)
represent an ultimate figure of merit which may be achieved 65
through the lateral shearing ofdiffracted wave fronts and the
subsequent linear combination of phase information. In
specimen grating at A=633 nm. Using this combination of
source wave length and associated diffraction angle, the dif-
fracted wave front shearing technique is found to be ,.,].65x
more sensitive than a conventional lateral shearing interfer-
ometer applied to a single normally reflected beam at the
same wave length. Case (3) considers the situation where the
source wavelength and specimen grating pitch are both
reduced by one-half in order to hold the diffraction angle 8
constant. The resulting curve may be viewed as a practical
upper bound on the theoretical instrument sensitivity in the
limit ofa very short source wave length ofA=316.5 nm (near
ultra-violet). In this instance the effective instrument sensi-
29. US 7,538,891 Bl
21
tivity to changes in surface slope is now defectively doubled
withrespect to case (2) in accordance with (36) and 3.3x more
sensitive than a conventional lateral shearing arrangement
applied to a single normally reflected beam at the originally
considered 633 nm wave length.
Consider that the slope sensitivity curves in FIG. 6A do not
account for the possibility ofcombining all four phase maps
comprising eitherpair ofindependent surface slope solutions,
au, au,
ax! or ax2,
10
in which case the overall sensitivity in the diffracted wave 15
front shearing cases would be theoretically doubled. The
effective instrument sensitivity to in-plane displacement gra-
dients (strains) (35) may be recast in terms of the specimen
grating pitch (d) through a simple substitution of the illumi-
nation angle condition (2) to yield the general form 20
aua(XJ, X2, t) _ _1_{!!__} _ . _a - 2
. N,a:-1,2,/3-1,2
Xfi Sfi j
(37)
25
where j+±l,±2, ... ±n corresponds to the specific diffraction
orders employed in the diffracted wave front shearing
arrangement. As previously mentioned, it is customary to
work with the j=±l diffraction orders, especially when work- 30
ing with fine pitched gratings, mainly due to the fact that
higher diffraction orders may not exist at the operating wave
length. Consider that according to (2), the 90-degree grazing
incidence condition results in the limit that the grating pitch
approaches the wavelength ofthe operating light source. The 35
operating laserwavelength therefore defines the finest grating
pitch that can sustain diffraction at that wave length. In the
case of 633 nm light, a grating frequency of approximately
1580 line/mm will therefore generate the grazing incidence
angle condition. As a point ofreference, it is common practice 40
to employ a
22
ing. The curves displayed in FIG. 6A can apply to any lateral
wave front shearing interferometer used to conduct gradient
mapping ofdiffracted wave fronts and are useful for gauging
whether the shearing distance s, required to achieve desired
instrument sensitivity, is suitably matched to the characteris-
tic lengths within a given experimental application. The solid
red, (middle) curve corresponds to the effective instrument
sensitivity of the diffracted wave front shearing technique
using 1st order normally diffracted wave fronts generated by a
1200line
mm
specimen grating at A-=633 nm. The dashed violet (lower)
curve corresponds once again to the near ultra-violet case
(A-316.5 nm), where ls' order beams are diffracted by a
line
2400-
mm
specimen grating. Note as well we could have equivalently
considered employing 2nd order diffracted beams at this wave
length using a
1200line
mm
specimen grating. The near ultra-violet wavelength case is
particularly noteworthy to consider since it suggests a prac-
tical upper bound on instrument sensitivity which may be
physically achieved with the aid ofan index matching fluid in
an immersion interferometer similarto the microscopic moire
interferometer arrangement developed by Han and co-work-
ers [3].
The following sections describe effective CGS instrument
sensitivity to measurement of surface slopes and in-plane
gradients as a function of the instrument grating separation1200line
mm 45 (ll), instrument grating pitch (p), source wave length (A.), and
specimen grating pitch (d). We now consider instrument sen-
sitivity in the specific case where a CGS lateral shearing
interferometer is applied to gradient mapping of diffractedgrating at A-=633 nm, in which case the instrument is already
operating at -76% of the maximum theoretical sensitivity at
this wave length. At the opposite end ofthe visible spectrum, 50
the 413.1 nm (deep violet) Argon ion laser line requires a
grating frequency of 2421 line/mm in order to achieve the
same, impractical, grazing incidence condition. Hence,
although mathematically possible, it is physically impractical
to double the effective instrument sensitivity to the measure- 55
ment of in-plane displacement gradients by simply decreas-
ing the source wave length ofvisible light. Clearly, there are
diminished gains in sensitivity which result from the use of
finer pitch gratings requiring more extreme diffraction angles
and/or a decrease ofthe source wavelength within the visible 60
portion of the optical spectrum. Only by shifting the wave-
length from the visible end down into the near ultra violet
portion of the spectrum can a practical and significant
enhancement of sensitivity result.
The lower graph in FIG. 6A displays in-plane displacement 65
gradient sensitivity curves plotted as a function of shearing
distance s13 for two extreme cases oflateral wave front shear-
wave fronts. The effective "virtual" CGS instrument sensi-
tivities are now defined in terms of the physical pitch p and
separation ll between the pair ofparallel instrument gratings
G1 and G2 . With reference to the ray diagram in FIG. 5 the
interfering wave fronts are laterally displaced by a shearing
distance s' given by
(38)
Note that the actual lateral wave front shearing distances'
in FIG. 5 is related to the physical separation s13 between
neighboring points on the specimen surface through the cos a
correction factor. However, the cosine correction term may be
generally ignored in most CGS applications since the diffrac-
tion angles induced by the CGS instrument gratings are gen-
erally quite shallow and the cosine ofthe angle is nearly unity.
30. US 7,538,891 Bl
23
Substituting for the shearing distance s13 (38) into (36) yields
an effective CGS instrument sensitivity to changes in surface
slope given by
24
using a digital CCD camera (Uniq Vision, Inc., UP-1030)
with a resolution of 1024x1024 pixels. Implemented phase
shifting diagnostics provided an automated fringe analysis
capability which eliminated the need for any fringe counting
(39)
5 or fringe tracing. A three-step phase-shifting technique was
employed by translating one of the diffraction gratings with
respect to the otherusing a PZT actuator (Physik Instrumente,
P-840.10). The phase shifting device was precisely calibrated
in order to eliminate phase shift errors introduced PZT non-
Similarly, substitution of(38) into (37) leads to an effective
CGS instrument sensitivity to in-plane displacement gradi-
ents given by
10 linearity and other sources ofphase shift error as described by
Creath [17]. Calibration was achieved through the use of
parallel tilt fringes which were created by slightly tilting one
ofthe two instrument gratings after establishing a null fringe
condition. Once the optical configuration was precisely
(40J 15 aligned and phase diagnostics calibrated, the master grating
element was removed and replaced by a test specimen within
a miniature load frame assembly. The (undeformed) speci-
men and loading assembly were then adjusted such that the
surface ofthe specimen was made to coincide with the sameSurface slope and in-plane strain sensitivity curves derived
forj=±1 diffraction orders are plotted in FIG. 6B as a function
of the grating separation A for the same range of conditions
considered in FIG. 6A.
20 plane which was previously occupied by master grating ele-
ment.
Two sets of three phase-shifted interferograms were
recorded from each m=±1 diffraction order comprising the
(u2 ,u3 ) beam pair before any load was applied in order to
In order to demonstrate the applicability of the proposed
CGS technique to whole-field mapping of in-plane and out-
of-plane displacement gradients, a series ofexperiments were
conducted by measuring in-plane strain fields and out-of-
plane slope fields near a crack-tip under various quasi-static
loading conditions. A brittle polyester resin (Homalite-100)
was used as a model material for measuring in-plane and
out-of-plane displacement gradient fields near a notch tip.
25 establish an undeformed reference configuration. Two sets of
three phase-shifted interferograms were thenrecorded at each
load level by alternating between the two illuminating beams
shown in FIG. 2. Phase unwrapping from all acquired inter-
ferograms was then achieved by application of (17) Back-
30 ground noise due to surface imperfections within the speci-
men grating and the optical components were removed by
subtracting corresponding phase maps acquired before and
after loading. In this study, a digital image correlation proce-
dure was also applied to the modulation maps from (18),
FIGS. 7A and 7B show symmetric and asymmetric four-
point bending fracture loading configurations in measuring a
single-end-notch specimen that is machined from a Homa-
lite-100 sheet (thickness, h=4.66 mm) with a notch width of
250 fllll· A square region (10 mmx10 mm) surrounding the
notch tip was chosen as a field ofview for the measurements.
Symmetric and asymmetric loading configurations of the
four-point bending fracture tests were conducted [18, 19]. A
diffraction grating G0 of 1200 lines/mm (pitch d=0.8333 f.tm)
was bonded to the specimen surface using established grating 40
replication techniques [3].
35 taken before and after loading, in order to correct for any
rigid-body rotation which may have occurred between load
states. Phase subtraction procedures were then applied in
order to de-couple the in-plane and out-of-plane displace-
In conducting the tests, the specimen was illuminated by
two oblique, expanded, and properly collimated laser beams
45
of wavelength, A-=0.633 f.tm using the optical arrangement
depicted in FIG. 2A. The two illuminating beams with wave
vectors k1 and k2 in the x2 -x3 plane, respectively were dif-
fracted by the specimen grating and the optical configuration
was precisely adjusted such that 1st order diffracted beams,
comprising the (u2 ,u3 ) beam pair, emerged coincident and
normal to the specimen in accordance with (2). Precise align- 50
ment of the optical configuration was achieved through the
temporary establishment of moire null field fringe patterns
using the same master grating element from which the speci-
men replica grating was obtained [3]. An orthogonal (uvu3 )
beam pair was not utilized in the validation study. A CGS 55
lateral shearing interferometer was assembled using two lin-
ear Ronchi gratings G1 and G2 of with a frequency of 40
lines/mm (p=25.4 f.tm), an imaging lens L of focal length,
f=300 mm, a circular filtering apertureA (diameter, D=5 mm)
at the focal plane of the lens L, and an image plane I. (FIG. 60
2B). The optical axis ofthe interferometer was made to coin-
cide with the propagation axis defined by the normally dif-
fracted beams. An instrument grating spacing of !1.=20 mm
resulted in a lateral shearing distance of 0.5 mm which was
sufficient to conduct displacement gradient mappings of the 65
specimen surface in the targeted application. The resulting
interference fringe patterns at the image plane were recorded
ment field gradients in accordance with (20) and (21).
In order to demonstrate the accuracy and robustness ofthe
proposed optical technique, three fracture tests were con-
ducted. Tests involved static notches loadedto produce mode-
l, mode-II and mixed-mode asymptotic crack-tip fields which
can be characterized by three different values ofmode mixity
(Y=0°,45°,90°) defined as
(41)
where KI and KII correspond to mode-l and mode-II stress
intensity factors, respectively.
Four interferograms, obtained using the diffracted wave
front shearing configuration, corresponding to a symmetric
mode-I near-tip loading condition (P=1OON,Y=0°) are shown
in FIG. 8. FIGS. Sa and Sb show the fringe patterns, corre-
sponding to the m=1 and m=-1 diffraction orders respec-
tively, obtainedwith a shearing vectors along the x2 -direction
and two illuminating beams with wave vectors k1 and k2 inthe
x2 -x3 plane, respectively. Thus, the fringe patterns represent
constant contours of constant differential displacement as
described by (10) or equivalently, displacement gradient
maps that are related to the linear combinations of
31. US 7,538,891 Bl
25 26
as described by equation (11 ). The fringe patterns in FIGS. Sc
and Sd were obtained after rotating the CGS instrument grat-
ings by 90 degrees, so that the shearing vector s was aligned
with x1 -direction. Thus, the fringe patterns in FIGS. Sc and Sd
represent constant contours ofconstant differential displace- 5
ment as described by (1 0) or equivalently, displacement gra-
dient maps that are related to the linear combinations of
sample surface at the same time. Alternatively, two different
probe beams may be directed to the sample at the same with
orthogonal polarizations to avoid interference.
FIG. 12 illustrates one example apparatus that implements
a polarization coding to optically separate two different probe
beams. As illustrated, the two symmetric optical probe beams
110Aand 110B for interacting with one oftwo gratings onthe
sample surface are controlled to have orthogonal polariza-
tions, e.g., the beam 110B in the p polarization and the beam
as described by equation (11).
In addition to the CGS measurements, Moire fringes were
also easily obtained by simply removing one of the double
gratings and allowing the (u2 ,u3 ) beams to mutually interfere.
FIG. 9 shows the Moire fringes which represent contours of
constant in-plane displacement component u2 which is natu-
rally differentiated using the proposed diffracted wave front
configuration.
In order to perform quantitative phase measurements, the
three-step phase-shifting algorithm was used to unwrap the
relative phase maps before and after loading. The changes in
the relative phase maps were obtained by subtracting the
initial phase maps before loading from the "deformed" phase
maps after loading.
FIGS. 1OA and 1OB show the phase maps corresponding to
the fringes in FIGS. SA and SB respectively, and are repre-
sented as 256-grayscale images of wrapped 2n-phase maps.
Following this step, the decomposition of in-plane and out-
of-plane displacement gradient fields was achieved by sub-
tracting and adding the phase maps in FIG. 10. The resulting
phase maps, which correspond to the in-plane displacement
gradient field
and the out-of-plane displacement gradient field
1o 11OA in the s polarization. A polarization rotator or controller
can be used to achieve this polarization status for the two
beams 110A and 110B. The diffracted beam 1610 produced
by the sample grating from the probe beam 110B and the
diffracted beam 1620 produced by the same sample grating
15 from the probe beam 110Aare both directed into the shearing
device 210 at the same time and two polariers 1611 and 1612
are placed at the optical output of the shearing device 210 to
separate the sheared optical outputs in the p and s polariza-
tions. The polarizer 1611 is oriented to transmit light in the p
20 polarization while blocking light in the s polarization and the
polarizer 1612 is oriented to transmit light in the s polariza-
tion while blocking light in the p polarization. Under this
design, the sheared optical output in the p polarization origi-
nated from the diffracted probe beam 1610 and the sheared
25 optical output in the s polarization originated from the dif-
fracted probe beam 1620 are two separate beams at two
different directions and thus are imaged by the imaging lens
220 to two different locations 1631 and 1632, respectively, on
the spatial filter 1630. The spatial filter 1630 is designed to
30 have apertures at the locations 1631 and 1632 to transmit the
images onto the imaging plane where two different imaging
arrays can be used to capture the two different interferogram
images.
In the above measurements, the shearing along two
35 orthogonal directions can be achieved by either using a single
CGS shearing device or two different CGS shearing devices.
When a single CGS shearing device is used. the relative
orientation between the sample and the CGS device can be
adjusted to align the CGS device to the x1 direction for
40 shearing along the x1 direction and then align the CGS device
to the x2 direction for shearing along the x2 direction. Each of
the two gratings in the CGS device may also be configured to
having cross gratings to allow for simultaneous shearing
along two different directions.
45 FIG. 13 shows an example where two shearing interferom-
eters 120 and 120B are used to perform shearing in the two
different directions x1 and x2. A beam splitter is used to split
the diffracted probe light 103 from sample 102 into two
different beams, one entering the shearing interferometer 120
50 and another entering the shearing interferometer 120B. As
such, the shearing in both directions x1 and x2 can be per-
formed at the same time.
are displayed in FIG. 11A and FIG. 11B respectively. The
phase map shown in FIG. 11A corresponds to a phase map of
the e22 . , where each 2n-phase fringe is represents a strain
differe{;~;'('~f 8.36x10⁻⁴
. The phase map shown in FIG. 11B
represents a phase map ofsurface slope where each 2n-phase
fringe represents a slope difference of 3.85x1o-4
. The theo-
retically predicted strain and the slope contours from the 55
asymptotic analytical crack-tip KI fields in the plane-stress
condition are shown in FIGS. 11C and 11D for comparison
purposes. The general shape and orientation of the fringes
match qualitatively well with those of the strain and the sur-
face slope field from the asymptotic near-tip solution. Similar 60
results were obtained for the mixed mode and mode-II cases.
In view of the above, one implementation of a shearing
process can be performed as follows: (1) a specimen is fab-
ricated with an attached fine pitch crossed-line diffraction
grating and is used to generate coincident, normally dif-
fracted (u1 ,u3 ) and (u2 ,u3 ) beam pairs which are directed to a
lateral wave front shearing interferometer; (2) wave front
shearing ofeach individual normally diffracted beam is con-
ducted along the x1 and x2 axes; (3) a sequence of phase
shifted interferograms is acquired for each individual dif-
In order to avoid interference between diffracted beams
from different optical probe beams, the delivery ofthe differ-
ent optical probe beams can be controlled to direct one optical
probe beam to the sample surface at a time and direct different
optical probe beams to the sample surface at different times so
that two different optical probe beams are not present at the
fracted wave front using an integrated optical phase shifting
scheme; (4) a phase unwrapping algorithm is applied to each
interferogram sequence through a post processing procedure
65 in order to extract phase maps containing coupled in-plane
and out-of-plane displacement field gradient data in accor-
dance with (15); and (5) in-plane and out-ofplane differential
32. US 7,538,891 Bl
27
displacement field terms are subsequently de-coupled and
scaledthrough a linearcombination ofsymmetric phase maps
as expressed by (20, 21) in order to generate whole field plots
of surface slope and in-plane strain fields.
The ability of the extended method to accurately measure 5
non-uniform strain and surface slope field was demonstrated
by measuring the deformation fields near a notchtip subjectto
several static loading conditions. The experimental results
demonstrated that the technique is capable to accurately mea-
sure deformation fields even in the presence of moderate 10
rigid-body rotations. The new technique which bares simi-
larities to Moire interferometry can be trivially implemented
into existing moire interferometry set up as a complementary
tool in experimental stress/strain analysis.
REFERENCES
[1] Kobayashi AS. Handbook on experimental mechanics.
2nd ed. Bethel, Conn.: Society for Experimental Mechan-
ics; 1993.
[2] Cloud G L. Optical methods ofengineering analysis. New
York: Cambridge University Press; 1995.
[3] Post D, Han B, Ifju P. High sensitivitymoire: experimental
analysis for mechanics and materials. NewYork: Springer-
Verlag; 1994.
[4] B. Han and D. Post, immersion Interferometer for Micro-
scopic Moire Interferometry," Experimental Mechanics,
Vol32, No.1, pp. 38-41 (1992)
[5] J. W. Goodman, Introduction to Fourier Optics, Roberts &
Company Publishers, Greenwood Village, Colo., (2005)
[4] Rastogi P K. Digital speckle pattern interferometry and
related techniques. New York: Wiley; 2001.
[5] Bates W J.A wave front shearing interferometer. Proceed-
ings ofthe Physical Society of London 1947; 59(6):940-
950.
[6] Patorski K, Yokozeki S, Suzuki T. Collimation test by
double grating shearing interferometer. Applied Optics
1976; 15(5): 1234-1240.
[7] Shang H M, Toh S L, Chau F S, Shim V P W, Tay C J.
15
20
25
30
35
28
[14] Lee H, Rosakis A J, Freund LB. Full-field optical mea-
surement ofcurvatures in ultra-thin-film-substrate systems
inthe range ofgeometrically nonlinear deformations. Jour-
nal ofApplied Physics 2001; 89(11): 6116-6129.
[15] Park T S, Suresh S, Rosakis A J, Ryu J. Measurement of
full-field curvature and geometrical instability ofthin film-
substrate systems through CGS interferometry. Journal of
the Mechanics and Physics of Solids 2003; 51(11-12):
2191-2211.
[16] Shield T W, Kim K S. Diffraction theory of optical
interference Moire and a device for production ofvariable
virtual reference gratings-a Moire microscope. Experi-
mental Mechanics 1991; 31(2): 126-134.
[17] Creath K. Phase-measurement interferometry tech-
niques. Progress in Optics 1988; 26: 349-393.
[18] Tada H, Paris PC, Irwin GR. The stress analysis of
cracks handbook. Hellertown, Pa.: Del Research Corp;
1973.
[19] He MY, Hutchinson J W. Asymmetric four-point crack
specimen. Journal ofApplied Mechanics-Transactions of
theASME 2000; 67(1): 207-209.
[20] Malacara D., Optical Shop Testing. New York: Wiley;
1992.
[21] K.-S. Kim, R. J. Clifton, and P. Kumar, "A Combined
Normal and Transverse Displacement Interferometer with
an Application to Impact of Y-Cut Quartz," J. of Appl.
Phys., Vol48, No. 10, pp 4132-4139 (1977).
[22] H. D. Espinosa, M. Mello, andY. xu, "A Variable Sensi-
tivity Displacement Interferometer with Application to
Wave Propagation Experiments," Journal of Applied
Mechanics-Transactions oftheASME, Vol. 64, pp. 123-
131, 1997.
[23] Mello, M.; Bongtae Han; Zhaoyang Wang. "Infrared
Diffraction Interferometer for Coplanarity Measurement
of High-Density Solder Bump Pattern" Optical Engineer-
ing, Volume 43, Issue 4, April 2004. Pages 888-894.
While this specification contains many specifics, these
should not be construed as limitations on the scope of any
invention or of what may be claimed, but rather as descrip-
Locating and sizing disbonds in glassfibre-reinforced plas-
tic plates using shearography. Journal of Engineering
Materials and Technology-Transactions of the ASME
1991; 113(1): 99-103.
[8] Boone PM. Determination ofslope and strain contours by
double-exposure shearing interferometry. Experimental
Mechanics 1975; 15(8): 295-302.
40 tions of features specific to particular embodiments. Certain
features that are described in this specification in the context
ofseparate embodiments can also be implemented in combi-
nation in a single embodiment. Conversely, various features
that are described in the context ofa single embodiment can
[9] Assa A, Betser A A, Politch J. Recording slope and cur-
vature contours of flexed plates using a grating shearing
interferometer. Applied Optics 1977; 16(9): 2504-2513.
45 also be implemented in multiple embodiments separately or
in any suitable subcombination. Moreover, although features
may be described above as acting in certain combinations and
even initially claimed as such, one or more features from a
claimed combination can in some cases be excised from the
[10] Tippur H V, Krishnaswamy S, Rosakis A J. A Coherent
Gradient Sensor for crack tip deformation measure-
ments-analysis and experimental results. International
Journal of Fracture 1991; 48(3): 193-204.
50 combination, andthe claimedcombinationmay be directed to
a subcombination or variation of a subcombination.
[11] Tippur H V, Krishnaswamy S, Rosakis A J. Optical
mapping of crack tip deformations using the methods of 55
transmission and reflection Coherent Gradient Sensing-a
study of crack tip K-dominance. International Journal of
Fracture 1991; 52(2): 91-117.
[12] Rosakis A J, Two optical techniques sensitive to gradi-
ents of optical path difference: the method ofcaustics and 60
the coherent gradient sensor (CGS). In: Epstein J S, editor.
Experimental techniques in fracture, New York: VCH;
1993, p. 327-425.
[13] Rosakis A J, Singh R P, Tsuji Y, Kolawa E, Moore N R.
Full field measurements of curvature using coherent gra- 65
dient sensing: application to thin film characterization.
Thin Solid Films 1998; 325(1-2): 42-54.
Thus, particular embodiments have been described. Other
embodiments are within the scope of the following claims.
The invention claimed is:
1. A method for optically characterizing a surface, com-
prising:
providing a first optical grating and a second optical grating
on a sample surface of a sample, the first and second
optical gratings being along a first grating direction and
a second, different direction within the sample surface
and spatially overlapping with each other;
directing a plurality ofdifferent optical probe beams to the
sample surface at different incident directions, respec-
tively;
using at least one optical shearing interferometerto receive
diffracted light ofthe different optical probe beams from
the first and the second optical gratings, without inter-