SlideShare une entreprise Scribd logo
1  sur  20
Télécharger pour lire hors ligne
Applied Ecology
Practical Notebook
Zeeshan Hafeez MCF1901267
2 | P a g e
University of Education, LMC, Lahore.
M.Sc Zoology (2nd
Semester)
Subject Applied Ecology (Practical Notebook)
Submitted By HAFIZ MUHAMMAD WASEEM
ROLL NO.mcf 1901171
Submitted to Dr. Nazish Mazhar Ali
3 | P a g e
Contents
Determination of pH of Waste Water Sample .....................................................4
Determination Dissolved Oxygen within Water ...................................................5
Adaptive Features of Animals in Relation to Food and Environment..................7
Study the Plant Population Density...................................................................10
Experimental Design and Approaches to Ecological Research........................12
4 | P a g e
Practical
No.1
Determination of pH of Waste Water Sample
introduction
Water is necessary and fundamental to life. Water is a molecular
substance that has unique chemical and physical properties related to
functions in the human body . However, water itself can cause skin
irritation as demonstrated by occlusion experiments. Functional
damage of the skin is shown by increased transepidermal water loss
(TEWL). Factors that might account for the irritancy of water include
pH, hardness, osmolarity, temperature and extraction of natural
moisturizing factors in the stratum corneum . The chemical content of
water may also be another factor. Water rich in calcium salts is likely
to irritate skin more easily.
Material Required:
 Waste water collected from lake
 Acetate buffer of pH 4
 Ammonium buffer of pH 10
 A pH meter.
 Distilled water
 Sample beakers
 Tissue papers
Procedure:
1. Take the water of the dirty lake in a bottle.
2. Put the water in a sample beaker labelled as wastewater sample.
3. Put the pH meter on and the pH of the storage solution and record the pH of
7.
4. Now, put out the electrode off the storage solution and with the help of
distilled water cleaned the lower portion of the electrode and cleaned with the help
of tissue paper.
5. Now again took the electrode in the Acetate buffer and measuring the pH of
4.
6. Again, cleaned the lower portion of the electrode with the help of distilled
water and dry it with the tissue paper.
5 | P a g e
7. Now put the electrode in in the ammonium buffer and you recorded the pH
of10.
8. Now is the turn of the waste sample of the water and recorded the pH 5.50.
9. Again, rinsed the electrode with distilled water cleaned it with the paper and
again put it in the storage solution and measured the pH 7.
Result
The average pH value of water from various sources measured by pH meter and pH indicator strips
were shown in Table 1. Bottled drinking water using reverse osmosis plus ultraviolet (UV) and/or
ozone treatment to kill organisms had pH between 6.9 and 7.5. Bottled drinking water of sparkling
type which carbon dioxide gas is filled during bottling process had an approximate pH between 4.9
and 5.5.
Result: Recorded pH of waste water sample was 5.50
Conclusion
1. Normal saline, distilled water, bottled sparkling water and facial makeup removing water
had similar pH to that of normal skin of normal people. However, other factors including benefits
of mineral substances in the water in terms of bacteriostatic and anti-inflammation should be
considered in the selection of cleansing water
2. pH of Water
3. What is pH?
4. pH is a determined value based on a defined scale, similar to temperature. This means that pH of
water is not a physical parameter that can be measured as a concentration or in a quantity. Instead, it is a
figure between 0 and 14 defining how acidic or basic a body of water is along a logarithmic scale ¹. The
lower the number, the more acidic the water is. The higher the number, the more basic it is. A pH of 7 is
considered neutral. The logarithmic scale means that each number below 7 is 10 times more acidic than the
previous number when counting down. Likewise, when counting up above 7, each number is 10 times more
basic than the previous number ².
5.
6 | P a g e
6. Alkaline and Acid Lakes
7. Spread across the world are a number of lakes with unusual pH levels. Alkaline lakes, also known as
soda lakes, generally have a pH level between 9 and 12. This is often due to a high salt content (though not
every salt lake has a high pH). These lakes have high concentrations of minerals, particularly dissolved salts:
sodium, calcium, magnesium carbonates and bicarbonates ²⁸. Depending on the lake, borates, sulfates and
other elements (usually strong base ions) can also be present ²⁹. Alkaline lakes are formed when the only
outlet for water is evaporation, leaving the minerals behind to accumulate ³⁰. These minerals often form
columns of mineral deposits, known as tufa columns. Many alkaline lakes are a commercial resource for
soda ash and potash, while others are popular tourist destinations for their “magical” healing properties (due
to the mineral content).
8.
7 | P a g e
Practical
No.2
Determination Dissolved Oxygen within Water
Principal:-
The Winkler Method is a technique used to measure dissolved oxygen in
freshwater systems. The Winkler Method uses titration to determine dissolved
oxygen in the water sample. A sample bottle is filled completely with water (no air
is left to skew the results). The dissolved oxygen in the sample is then "fixed" by
adding a series of reagents that form an acid compound that is then titrated with a
neutralizing compound that results in a color change. The point of color change is
called the "endpoint," which coincides with the dissolved oxygen concentration in
the sample. Dissolved oxygen analysis is best done in the field, as the sample will
be less altered by atmospheric equilibration.
introduction
Most natural waters contain small quantities of organic compounds. Aquatic
microorganisms have evolved to use some of these compounds as food.
Microorganisms living in oxygenated waters use dissolved oxygen to
oxidatively degrade the organic compounds, releasing energy which is
used for growth and reproduction. Populations of these microorganisms
tend to increase in proportion to the amount of food available. This
microbial metabolismcreates an oxygen demand proportional to the amount
of orga
8 | P a g e
Material Required:
 Micro pipette
 Bottle
 Water
 Manganous sulphate
 Aluminum foil and a rubber
 Sulfuric acid
 Sodium thiosulfate
 Starch indicator
 Dropper
Procedure:
1. Collect water in a bottle from this below the surface of water using the
micropipette an ad 2 ML manganous sulphate to clear 300 ml BOD bottle filled with
sample water.
2. Carefully collect sample water by not adding further oxygen in it by
inserting that it below the water.
3. Carefully dispense manganous sulphate this will avoid air bubble and fix the
sample for the proceeding.
4. The precipitated aggregation of material with a cloudy appearance will
appear.
5. Fixed the sample to prevent change in dissolved oxygen content.
6. To avoid the addition of the oxygen the sample is stored using the
Aluminum foil to cover the open mouth of the bottle and fix it by using the rubber.
9 | P a g e
7. Pipette 2 ml of sulphuric acid in the sample invert carefully several times to
dissolve the floc.
8. Now, in a glass flask titrate 200 ml of sample water with a 0.025
standardize sodium thiosulphate and mixing a continuously until pale straw color
forms.
9. Add 2 ml of starch indicator solution using dropper. The solution will turn
blue.
10. Continue titration and point arise be careful stipend and you can hold a
piece of paper against the glass beaker to clearly see the endpoint.
11. The concentration of dissolved oxygen is equal to the titrant used.
Note: Each milliliter of sodium thiosulphate is equal to 1 mg/L of oxygen dissolved
in water.
Results:
A dissolved oxygen level of 6 milligram/ L is sufficient for most affected species
oxygen level below 4 milligram/L is stressful and even below 2 milligram /L will
not sport aerobic aquatic life.
 Measuring dissolved oxygen
10 | P a g
e

 Multi-parameter monitor used to record water-quality
measurements.
 Field and lab meters to measure dissolved oxygen have been
around for a long time. As this picture shows, modern meters are
small and highly electronic. They still use a probe, which is located
at the end of the cable. Dissolved oxygen is dependent on
temperature (an inverse relation), so the meter must be calibrated
properly before each use.
 Dissolved oxygen test procedure
 You can measure Dissolved Oxygen in different ways. Electronic meter is one of the
important methods. It does not measure oxygen directly, it measure the partial pressure of oxygen
in the water. Then it would convert to oxygen mass weight concentration. The BOD is another
significant method. It determines the oxygen requirements during a specified period of organic
matter degradation. The other methods are drop bottle (iodometric), a microburet, or a digital
titrator. The amount of oxygen dissolved in water is often expressed as ppm or mg/l.
11 | P a g
e
12 | P a g
e
Factors affecting dissolved oxygen in water
Several natural and man-made factors affecting dissolved oxygen in water such as temperature,
nutrient pollution, altitude, salinity, organic waste.
Photosynthesis
The photosynthesis process occurs in presence of light and chlorophyll. Therefore huge amount of
oxygen produces during day time. On the other hand the photosynthesis process terminates during
night time. But at this time the respiration process occurs and consumes oxygen. As a result DO
level higher at day time and lower at night time. Turbidity (due to suspended solids) can restrain the
sunlight to go into the water that limits the photosynthesis process.
Temperature
There is a significant relationship between water temperature and DO concentrations. Oxygen
easily dissolves in cool water. Cold water can holds more dissolved oxygen than warmer water.
Moreover the solubility of oxygen in water decreases with the increases of temperature.
Seasonal changes
Seasonal changes is the another factor that affecting dissolved oxygen concentrations in water.
During summer season the water becomes warmer. Therefore at this time water contains less DO.
Conversely the water becomes cooler at the time of winter season. So this time the water holds
more oxygen. Rainy seasons also effects on oxygen concentrations. As the rain water interact with
the atmospheric oxygen then it tends to higher the dissolved oxygen level.
Altitude
The atmospheric pressure decreases at higher altitude. When the atmospheric pressure decreases
then the solubility of oxygen in water also decreases. So the amount of oxygen decreases at higher
altitudes than at low altitudes.
Salinity
Waters with high amounts of salt holds less oxygen than fresh water. Reason, the solubility of
oxygen decreases if the salinity of the water increases. Hence the freshwater like lakes, streams, and
tap water generally contains higher concentrations of DO than the ocean. Higher suspended solids
in the water also decrease the DO.
Moving water
The ocean, rivers and streams water are moving water. When this water is moving then they contact
13 | P a g
e
with air. Oxygen concentrations are much higher in air than in water, which are about 21% and 5-
14 mg/l respectively. This huge difference of concentrations helps to dissolve the oxygen into the
water. Moreover the volume and speed of moving water can also affect on dissolved oxygen levels.
Organic waste
The water may contain a lot of organic waste including leaves, grass, dead plants or animals,
organic chemicals and sewage. Microorganisms like Bacteria decompose these materials by taking
up oxygen. Therefore the levels of dissolved oxygen drop in the water body.
Fertilizer
Fertilizer runoff from farm fields and lawns may decrease The DO. As like land plants the aquatic
plants also grow better with these nutrients. These large amounts of nutrients such as nitrate and
phosphate help to produce great quantities of algae. When these aquatic plants die, then the bacteria
decompose them by using large amounts of DO. This process is known as eutrophication. As a
result Dissolved Oxygen levels can drop too low.

14 | P a g
e
Practical No.3
Adaptive Features of Animals in Relation to Food and
Environment
Theory:
In an ecosystem, organisms interact with abiotic and living environment organism.
Some of the most important interactions among species in an ecosystem
community involve feeding. All living things need food for energy and we know
there are producers, herbivores, carnivores, top coronavirus and decomposers.
Objective:
 Determine the place of an organism in a food chain.
 Explain how and what is the sequence of energy transfer to different
communities of organisms.
Procedure:
1. Opened the online Virtual lab.
2. Shuffle the cards on the table and then placed them on the right empty
portion and clicked the icon of desired information.
3. Facts, habitat and energy source study made us able to figure out a food
chain.
4. A food web was designed as shown.
15 | P a g
e
We also observed the Producers, First-order consumer, Second-order consumer,
Third- order consumer and the Decomposers.
Observations:
1. Producer: Common Elder
Habitat:
Common header is a large shrub or small tree that is found in wooded areas, semi-
wooded areas and in open fields.
Facts:
The common elder berries can be used to make Jelly, Pies and wine. Elderberries
have been used as a remedy for upset stomach and as an eye salve.
Energy:
The common elder produces purple blackberries that serve as a food for birds and
mammals.
2. First-order Consumer: White-Tailed Deer
Habitat:
White-tailed deer live in forest and semi forested areas to United States and one
part of South America.
Fact:
It gets its name from a distinctive patch of white fur beneath its tail. When alarmed,
this year leads into the air exposing the white marking other deer in danger.
Energy:
This white-tailed deer feed on grasses, berries and nuts leaves and grains.
3. Second-order consumer: Gray Fox
Habitat:
Gray fox lives in forest and semi forested areas throughout North America.
Facts:
Gray foxes are also ka tree-foxes because they often climb trees to rest, feed and
hide from predators
16 | P a g
e
Energy:
They get energy by feeding on small mammal, birds and vegetations.
4. Third-order Consumer: Grizzly Bear
Habitat:
The grizzly bear lives near the lakes, ponds and other wetlands in forests of North
America.
Facts:
It is named from the long, silver tipped hairs on its back and shoulders that its coat
a grizzled appearance.
Energy:
They have a varied diet that include fish, birds, mammals, turtles, frogs and fruits.
5. Decomposers: Bacillus subtillis
Habitat:
It is a common soil bacterium.
Facts:
Bacillus subtilis is found everywhere including on human skin. It often
contaminates laboratory culture dishes.
Energy:
It breakdowns the organic material of soil.
17 | P a g
e
Practical
No.4
Study the Plant Population
Density
(Quadrant and Mark Recapture Method)
Materials Required:
 Thread
 Hammer
 Nails
Procedure:
1. Select a site for the study and hammer the nails on the site without
harming the vegetation.
2. Fix four nails in the form of a square.
3. Each end of the nail is tied with the help of a thread making a 1m*1m
quadrant.
4. Nine more similar quadrants are made at the site of the study.
5. The number of individuals of the species A present in the first quadrant are
counted and the data is recorded in the table.
6. The number of individuals of species A in other quadrants is also counted
and the data is recorded in the table.
7. Similarly, count the number of individuals of species B and C present in all
the quadrants and record the data in the table.
The density of the plant population is then calculated by the following equation:
Density = Total number of individuals of the species in all sampling units (S) / Total
number of sampling units studied (Q).
18 | P a g
e
Conclusion:
The population density is the highest for species A and the lowest for species C.
The density value is expressed as the number of individuals per unit area.
Mark Recapture Method
Procedure:
1. This technique is used to simulate a population estimated by a wildlife
biologist in the field.
2. The first step is to trap a random sample of animal of the species being
studied.
3. These animals are then marked in some manner appropriate to the
species and released.
4. In next step do another trapping.
5. Some animals capture d may have been marked from the first sample.
6. Using a simple ratio, a quick population estimated.
7. Petersen-Lincoln estimator of population size can be made as
follows: N=population estimate
M=number of individuals capture in 1st sample and marked N=number of
individuals captured in second sample.
M=number of n that were already marked
Assuming that marked proportion in the sample is equal to the marked proportion in
the population suggest that
N/M=n/m
To solve for N we rearrange the formula
N=nM/m
19 | P a g
e
Practical No.5
Experimental Design and Approaches to Ecological
Research
(Writing a Research Project)
The Summary:
The major steps to write an ecological research project is
1. To select a topic
2. Ask question or enquiry
3. Conduct a preliminary research
4. Gather and evaluate sources
5. Free right to build up cited page
6. Complete draft
7. Workshop draft for structure
8. Revise and refine draft
9. Finalize project for submission
Title clearly conveys the theme of the research project and the main Research
question will increase the focus of the research the explanation is to explain that
why our research is important and a brief literature review shows that you possess
relevant knowledge to answer the Research question the proposed methodology
for answering the Research question must be accurate at the time schedule for
research project is also very essential.
1. Topic:
The topic is assigned by the teacher or the teacher asked the student to think and
discuss and then decide the topic.
2. Observation:
The students gather the information by asking questions to the teachers and
researchers and the best possible way to collect the observation is to study the
already “published paper” of the researchers we can also call it as Review of
Literature.
3. Research Work:
Research work can also be classified as sampling that is the field work and the
second possible way is the laboratory work.
4. Writing a Project:
20 | P a g
e
All the gathered information from studying the research papers and from the
experimentation the information is compiled or collected, in the form of the writing
.If you are writing for an organization then the funding performer of that
organization is filled.
Submission:
The compiling for the submission of the project also has a sequence. It includes:
 Abstract
 Introduction
 Review of literature
 Methodologies
 Result
 Discussion
 And References.

Contenu connexe

Tendances

Water quality
Water qualityWater quality
Water quality
India Water Portal
 
Report on alkalinity test
Report on alkalinity testReport on alkalinity test
Report on alkalinity test
Azlan
 
Water sampling , procedure, purpose , techniques and equipments
Water sampling , procedure, purpose , techniques and equipmentsWater sampling , procedure, purpose , techniques and equipments
Water sampling , procedure, purpose , techniques and equipments
Mir Zafarullah
 

Tendances (20)

Exp 4
Exp  4Exp  4
Exp 4
 
harness of water ppt
harness of water pptharness of water ppt
harness of water ppt
 
Exp 2 (A)
Exp 2 (A)Exp 2 (A)
Exp 2 (A)
 
Do,cod,bod
Do,cod,bodDo,cod,bod
Do,cod,bod
 
Water and p h
Water and p hWater and p h
Water and p h
 
Exp 1 (B)
Exp 1 (B)Exp 1 (B)
Exp 1 (B)
 
Water quality
Water qualityWater quality
Water quality
 
Lab 4 alkalinity –acidity and determination of alkalinity in water
Lab 4 alkalinity –acidity and determination of alkalinity in waterLab 4 alkalinity –acidity and determination of alkalinity in water
Lab 4 alkalinity –acidity and determination of alkalinity in water
 
Estimation of total solids, total suspended solids and total dissolved solids...
Estimation of total solids, total suspended solids and total dissolved solids...Estimation of total solids, total suspended solids and total dissolved solids...
Estimation of total solids, total suspended solids and total dissolved solids...
 
Total dissolved solids
Total dissolved solidsTotal dissolved solids
Total dissolved solids
 
areation and types of aeration in waste water treatment
areation and types of aeration in waste water treatmentareation and types of aeration in waste water treatment
areation and types of aeration in waste water treatment
 
Water Analysis: Total Solids
Water Analysis: Total SolidsWater Analysis: Total Solids
Water Analysis: Total Solids
 
Report on alkalinity test
Report on alkalinity testReport on alkalinity test
Report on alkalinity test
 
Water sampling , procedure, purpose , techniques and equipments
Water sampling , procedure, purpose , techniques and equipmentsWater sampling , procedure, purpose , techniques and equipments
Water sampling , procedure, purpose , techniques and equipments
 
Water quality
Water qualityWater quality
Water quality
 
Determination of hardness and alkalinity of waste water
Determination of hardness and alkalinity of waste waterDetermination of hardness and alkalinity of waste water
Determination of hardness and alkalinity of waste water
 
Physical & chemical evaluation of water
Physical & chemical evaluation of water     Physical & chemical evaluation of water
Physical & chemical evaluation of water
 
Water sampling methods and tools
Water sampling methods and toolsWater sampling methods and tools
Water sampling methods and tools
 
Coagulation and flocculation in water treatment
Coagulation and flocculation in water treatmentCoagulation and flocculation in water treatment
Coagulation and flocculation in water treatment
 
Determination of alkalinity
Determination of alkalinityDetermination of alkalinity
Determination of alkalinity
 

Similaire à Determination of p h of waste water sample ..................................................... 4

A water quality field study 2010
A water quality field study 2010A water quality field study 2010
A water quality field study 2010
pauleyler
 
Denitrification Report Final (1)
Denitrification Report Final (1)Denitrification Report Final (1)
Denitrification Report Final (1)
Samantha Miller
 
WHAT’S IN YOUR WATERPreviousNextWe take for granted the water.docx
WHAT’S IN YOUR WATERPreviousNextWe take for granted the water.docxWHAT’S IN YOUR WATERPreviousNextWe take for granted the water.docx
WHAT’S IN YOUR WATERPreviousNextWe take for granted the water.docx
philipnelson29183
 
Water field study
Water field studyWater field study
Water field study
pauleyler
 
P h technical handbook
P h technical handbookP h technical handbook
P h technical handbook
Abegail Ayaso
 
Dissolved Oxygen Measurement Techniques and Aplications for the Water Quality...
Dissolved Oxygen Measurement Techniques and Aplications for the Water Quality...Dissolved Oxygen Measurement Techniques and Aplications for the Water Quality...
Dissolved Oxygen Measurement Techniques and Aplications for the Water Quality...
Valentina Giraldo
 
Physicochemical and Bacteriological Analysis of Drinking Water Samples from U...
Physicochemical and Bacteriological Analysis of Drinking Water Samples from U...Physicochemical and Bacteriological Analysis of Drinking Water Samples from U...
Physicochemical and Bacteriological Analysis of Drinking Water Samples from U...
SSR Institute of International Journal of Life Sciences
 

Similaire à Determination of p h of waste water sample ..................................................... 4 (19)

A water quality field study 2010
A water quality field study 2010A water quality field study 2010
A water quality field study 2010
 
Determination of the Ph &Turbidity Value in Betul Block Five Year
Determination of the Ph &Turbidity Value in Betul Block Five YearDetermination of the Ph &Turbidity Value in Betul Block Five Year
Determination of the Ph &Turbidity Value in Betul Block Five Year
 
Animal physiology and biochemistry lab manual
Animal physiology and biochemistry lab manualAnimal physiology and biochemistry lab manual
Animal physiology and biochemistry lab manual
 
Denitrification Report Final (1)
Denitrification Report Final (1)Denitrification Report Final (1)
Denitrification Report Final (1)
 
Dissolved oxygen and its method of determination
Dissolved oxygen and its method of determinationDissolved oxygen and its method of determination
Dissolved oxygen and its method of determination
 
Análisis del agua c
Análisis del agua cAnálisis del agua c
Análisis del agua c
 
WHAT’S IN YOUR WATERPreviousNextWe take for granted the water.docx
WHAT’S IN YOUR WATERPreviousNextWe take for granted the water.docxWHAT’S IN YOUR WATERPreviousNextWe take for granted the water.docx
WHAT’S IN YOUR WATERPreviousNextWe take for granted the water.docx
 
Water field study
Water field studyWater field study
Water field study
 
A STUDY ON OCEAN ACIDIFICATION DUE TO CARBON DIOXIDE ALONG THE COAST OF VISAK...
A STUDY ON OCEAN ACIDIFICATION DUE TO CARBON DIOXIDE ALONG THE COAST OF VISAK...A STUDY ON OCEAN ACIDIFICATION DUE TO CARBON DIOXIDE ALONG THE COAST OF VISAK...
A STUDY ON OCEAN ACIDIFICATION DUE TO CARBON DIOXIDE ALONG THE COAST OF VISAK...
 
P h technical handbook
P h technical handbookP h technical handbook
P h technical handbook
 
Laboratory manual of water supply and sewerage engineering
Laboratory manual of water supply and sewerage engineeringLaboratory manual of water supply and sewerage engineering
Laboratory manual of water supply and sewerage engineering
 
Oxigeno disuelto
Oxigeno disueltoOxigeno disuelto
Oxigeno disuelto
 
Tamizhazhagan.4
Tamizhazhagan.4Tamizhazhagan.4
Tamizhazhagan.4
 
Dissolved Oxygen Measurement Techniques and Aplications for the Water Quality...
Dissolved Oxygen Measurement Techniques and Aplications for the Water Quality...Dissolved Oxygen Measurement Techniques and Aplications for the Water Quality...
Dissolved Oxygen Measurement Techniques and Aplications for the Water Quality...
 
Water and pH lecture Note .pptx
Water and pH lecture Note .pptxWater and pH lecture Note .pptx
Water and pH lecture Note .pptx
 
Report waste water
Report waste waterReport waste water
Report waste water
 
Physicochemical and Bacteriological Analysis of Drinking Water Samples from U...
Physicochemical and Bacteriological Analysis of Drinking Water Samples from U...Physicochemical and Bacteriological Analysis of Drinking Water Samples from U...
Physicochemical and Bacteriological Analysis of Drinking Water Samples from U...
 
CHARACTERIZATION OF LEACHATE FROM MUNCIPAL LANDFILL AND ITS EFFECT ON SURROU...
 CHARACTERIZATION OF LEACHATE FROM MUNCIPAL LANDFILL AND ITS EFFECT ON SURROU... CHARACTERIZATION OF LEACHATE FROM MUNCIPAL LANDFILL AND ITS EFFECT ON SURROU...
CHARACTERIZATION OF LEACHATE FROM MUNCIPAL LANDFILL AND ITS EFFECT ON SURROU...
 
0.0 EXPERIMENT ON DETERMINATION OF DISSOLVED OXYGEN
0.0 EXPERIMENT ON DETERMINATION OF DISSOLVED OXYGEN0.0 EXPERIMENT ON DETERMINATION OF DISSOLVED OXYGEN
0.0 EXPERIMENT ON DETERMINATION OF DISSOLVED OXYGEN
 

Plus de Hafiz M Waseem

Plus de Hafiz M Waseem (20)

Biofloc Technology.pptx pangasius and tilapia fish culture
Biofloc Technology.pptx pangasius and tilapia fish cultureBiofloc Technology.pptx pangasius and tilapia fish culture
Biofloc Technology.pptx pangasius and tilapia fish culture
 
Production of live food (Aquatic micro animals)for the rearing of fish fry at...
Production of live food (Aquatic micro animals)for the rearing of fish fry at...Production of live food (Aquatic micro animals)for the rearing of fish fry at...
Production of live food (Aquatic micro animals)for the rearing of fish fry at...
 
green water production at fish hatcheries and its uses to enhance primary pro...
green water production at fish hatcheries and its uses to enhance primary pro...green water production at fish hatcheries and its uses to enhance primary pro...
green water production at fish hatcheries and its uses to enhance primary pro...
 
biofloc.pptx
biofloc.pptxbiofloc.pptx
biofloc.pptx
 
biofloc fish technology.pptx
biofloc fish technology.pptxbiofloc fish technology.pptx
biofloc fish technology.pptx
 
Wildlife,endangered species,
Wildlife,endangered species,Wildlife,endangered species,
Wildlife,endangered species,
 
Water pollution
Water pollutionWater pollution
Water pollution
 
Water cycle
Water cycleWater cycle
Water cycle
 
Water and moisture
Water and moistureWater and moisture
Water and moisture
 
Trophic levels and energy variation with increasing trophic levels.food chain...
Trophic levels and energy variation with increasing trophic levels.food chain...Trophic levels and energy variation with increasing trophic levels.food chain...
Trophic levels and energy variation with increasing trophic levels.food chain...
 
Treatment of waste water
Treatment of waste waterTreatment of waste water
Treatment of waste water
 
Sulpher cycle
Sulpher cycleSulpher cycle
Sulpher cycle
 
Soila (complete medium for life)
Soila (complete medium for life)Soila (complete medium for life)
Soila (complete medium for life)
 
Pollution and air pollution
Pollution and air pollutionPollution and air pollution
Pollution and air pollution
 
Wild life (biodiversity of pakistan )
Wild life (biodiversity of pakistan )Wild life (biodiversity of pakistan )
Wild life (biodiversity of pakistan )
 
Ozone layers
Ozone layersOzone layers
Ozone layers
 
Ecosphere(biosphere)
Ecosphere(biosphere)Ecosphere(biosphere)
Ecosphere(biosphere)
 
Mineral resources
Mineral resourcesMineral resources
Mineral resources
 
Marine ecosystem
Marine ecosystemMarine ecosystem
Marine ecosystem
 
Lithosphere
LithosphereLithosphere
Lithosphere
 

Dernier

Activity 01 - Artificial Culture (1).pdf
Activity 01 - Artificial Culture (1).pdfActivity 01 - Artificial Culture (1).pdf
Activity 01 - Artificial Culture (1).pdf
ciinovamais
 
The basics of sentences session 3pptx.pptx
The basics of sentences session 3pptx.pptxThe basics of sentences session 3pptx.pptx
The basics of sentences session 3pptx.pptx
heathfieldcps1
 
Spellings Wk 3 English CAPS CARES Please Practise
Spellings Wk 3 English CAPS CARES Please PractiseSpellings Wk 3 English CAPS CARES Please Practise
Spellings Wk 3 English CAPS CARES Please Practise
AnaAcapella
 

Dernier (20)

HMCS Max Bernays Pre-Deployment Brief (May 2024).pptx
HMCS Max Bernays Pre-Deployment Brief (May 2024).pptxHMCS Max Bernays Pre-Deployment Brief (May 2024).pptx
HMCS Max Bernays Pre-Deployment Brief (May 2024).pptx
 
Unit-IV- Pharma. Marketing Channels.pptx
Unit-IV- Pharma. Marketing Channels.pptxUnit-IV- Pharma. Marketing Channels.pptx
Unit-IV- Pharma. Marketing Channels.pptx
 
ICT Role in 21st Century Education & its Challenges.pptx
ICT Role in 21st Century Education & its Challenges.pptxICT Role in 21st Century Education & its Challenges.pptx
ICT Role in 21st Century Education & its Challenges.pptx
 
How to Create and Manage Wizard in Odoo 17
How to Create and Manage Wizard in Odoo 17How to Create and Manage Wizard in Odoo 17
How to Create and Manage Wizard in Odoo 17
 
Unit-IV; Professional Sales Representative (PSR).pptx
Unit-IV; Professional Sales Representative (PSR).pptxUnit-IV; Professional Sales Representative (PSR).pptx
Unit-IV; Professional Sales Representative (PSR).pptx
 
Unit-V; Pricing (Pharma Marketing Management).pptx
Unit-V; Pricing (Pharma Marketing Management).pptxUnit-V; Pricing (Pharma Marketing Management).pptx
Unit-V; Pricing (Pharma Marketing Management).pptx
 
Application orientated numerical on hev.ppt
Application orientated numerical on hev.pptApplication orientated numerical on hev.ppt
Application orientated numerical on hev.ppt
 
Activity 01 - Artificial Culture (1).pdf
Activity 01 - Artificial Culture (1).pdfActivity 01 - Artificial Culture (1).pdf
Activity 01 - Artificial Culture (1).pdf
 
UGC NET Paper 1 Mathematical Reasoning & Aptitude.pdf
UGC NET Paper 1 Mathematical Reasoning & Aptitude.pdfUGC NET Paper 1 Mathematical Reasoning & Aptitude.pdf
UGC NET Paper 1 Mathematical Reasoning & Aptitude.pdf
 
The basics of sentences session 3pptx.pptx
The basics of sentences session 3pptx.pptxThe basics of sentences session 3pptx.pptx
The basics of sentences session 3pptx.pptx
 
TỔNG ÔN TẬP THI VÀO LỚP 10 MÔN TIẾNG ANH NĂM HỌC 2023 - 2024 CÓ ĐÁP ÁN (NGỮ Â...
TỔNG ÔN TẬP THI VÀO LỚP 10 MÔN TIẾNG ANH NĂM HỌC 2023 - 2024 CÓ ĐÁP ÁN (NGỮ Â...TỔNG ÔN TẬP THI VÀO LỚP 10 MÔN TIẾNG ANH NĂM HỌC 2023 - 2024 CÓ ĐÁP ÁN (NGỮ Â...
TỔNG ÔN TẬP THI VÀO LỚP 10 MÔN TIẾNG ANH NĂM HỌC 2023 - 2024 CÓ ĐÁP ÁN (NGỮ Â...
 
How to Give a Domain for a Field in Odoo 17
How to Give a Domain for a Field in Odoo 17How to Give a Domain for a Field in Odoo 17
How to Give a Domain for a Field in Odoo 17
 
Holdier Curriculum Vitae (April 2024).pdf
Holdier Curriculum Vitae (April 2024).pdfHoldier Curriculum Vitae (April 2024).pdf
Holdier Curriculum Vitae (April 2024).pdf
 
Spellings Wk 3 English CAPS CARES Please Practise
Spellings Wk 3 English CAPS CARES Please PractiseSpellings Wk 3 English CAPS CARES Please Practise
Spellings Wk 3 English CAPS CARES Please Practise
 
Graduate Outcomes Presentation Slides - English
Graduate Outcomes Presentation Slides - EnglishGraduate Outcomes Presentation Slides - English
Graduate Outcomes Presentation Slides - English
 
Mehran University Newsletter Vol-X, Issue-I, 2024
Mehran University Newsletter Vol-X, Issue-I, 2024Mehran University Newsletter Vol-X, Issue-I, 2024
Mehran University Newsletter Vol-X, Issue-I, 2024
 
Accessible Digital Futures project (20/03/2024)
Accessible Digital Futures project (20/03/2024)Accessible Digital Futures project (20/03/2024)
Accessible Digital Futures project (20/03/2024)
 
On National Teacher Day, meet the 2024-25 Kenan Fellows
On National Teacher Day, meet the 2024-25 Kenan FellowsOn National Teacher Day, meet the 2024-25 Kenan Fellows
On National Teacher Day, meet the 2024-25 Kenan Fellows
 
Making communications land - Are they received and understood as intended? we...
Making communications land - Are they received and understood as intended? we...Making communications land - Are they received and understood as intended? we...
Making communications land - Are they received and understood as intended? we...
 
ICT role in 21st century education and it's challenges.
ICT role in 21st century education and it's challenges.ICT role in 21st century education and it's challenges.
ICT role in 21st century education and it's challenges.
 

Determination of p h of waste water sample ..................................................... 4

  • 2. 2 | P a g e University of Education, LMC, Lahore. M.Sc Zoology (2nd Semester) Subject Applied Ecology (Practical Notebook) Submitted By HAFIZ MUHAMMAD WASEEM ROLL NO.mcf 1901171 Submitted to Dr. Nazish Mazhar Ali
  • 3. 3 | P a g e Contents Determination of pH of Waste Water Sample .....................................................4 Determination Dissolved Oxygen within Water ...................................................5 Adaptive Features of Animals in Relation to Food and Environment..................7 Study the Plant Population Density...................................................................10 Experimental Design and Approaches to Ecological Research........................12
  • 4. 4 | P a g e Practical No.1 Determination of pH of Waste Water Sample introduction Water is necessary and fundamental to life. Water is a molecular substance that has unique chemical and physical properties related to functions in the human body . However, water itself can cause skin irritation as demonstrated by occlusion experiments. Functional damage of the skin is shown by increased transepidermal water loss (TEWL). Factors that might account for the irritancy of water include pH, hardness, osmolarity, temperature and extraction of natural moisturizing factors in the stratum corneum . The chemical content of water may also be another factor. Water rich in calcium salts is likely to irritate skin more easily. Material Required:  Waste water collected from lake  Acetate buffer of pH 4  Ammonium buffer of pH 10  A pH meter.  Distilled water  Sample beakers  Tissue papers Procedure: 1. Take the water of the dirty lake in a bottle. 2. Put the water in a sample beaker labelled as wastewater sample. 3. Put the pH meter on and the pH of the storage solution and record the pH of 7. 4. Now, put out the electrode off the storage solution and with the help of distilled water cleaned the lower portion of the electrode and cleaned with the help of tissue paper. 5. Now again took the electrode in the Acetate buffer and measuring the pH of 4. 6. Again, cleaned the lower portion of the electrode with the help of distilled water and dry it with the tissue paper.
  • 5. 5 | P a g e 7. Now put the electrode in in the ammonium buffer and you recorded the pH of10. 8. Now is the turn of the waste sample of the water and recorded the pH 5.50. 9. Again, rinsed the electrode with distilled water cleaned it with the paper and again put it in the storage solution and measured the pH 7. Result The average pH value of water from various sources measured by pH meter and pH indicator strips were shown in Table 1. Bottled drinking water using reverse osmosis plus ultraviolet (UV) and/or ozone treatment to kill organisms had pH between 6.9 and 7.5. Bottled drinking water of sparkling type which carbon dioxide gas is filled during bottling process had an approximate pH between 4.9 and 5.5. Result: Recorded pH of waste water sample was 5.50 Conclusion 1. Normal saline, distilled water, bottled sparkling water and facial makeup removing water had similar pH to that of normal skin of normal people. However, other factors including benefits of mineral substances in the water in terms of bacteriostatic and anti-inflammation should be considered in the selection of cleansing water 2. pH of Water 3. What is pH? 4. pH is a determined value based on a defined scale, similar to temperature. This means that pH of water is not a physical parameter that can be measured as a concentration or in a quantity. Instead, it is a figure between 0 and 14 defining how acidic or basic a body of water is along a logarithmic scale ¹. The lower the number, the more acidic the water is. The higher the number, the more basic it is. A pH of 7 is considered neutral. The logarithmic scale means that each number below 7 is 10 times more acidic than the previous number when counting down. Likewise, when counting up above 7, each number is 10 times more basic than the previous number ². 5.
  • 6. 6 | P a g e 6. Alkaline and Acid Lakes 7. Spread across the world are a number of lakes with unusual pH levels. Alkaline lakes, also known as soda lakes, generally have a pH level between 9 and 12. This is often due to a high salt content (though not every salt lake has a high pH). These lakes have high concentrations of minerals, particularly dissolved salts: sodium, calcium, magnesium carbonates and bicarbonates ²⁸. Depending on the lake, borates, sulfates and other elements (usually strong base ions) can also be present ²⁹. Alkaline lakes are formed when the only outlet for water is evaporation, leaving the minerals behind to accumulate ³⁰. These minerals often form columns of mineral deposits, known as tufa columns. Many alkaline lakes are a commercial resource for soda ash and potash, while others are popular tourist destinations for their “magical” healing properties (due to the mineral content). 8.
  • 7. 7 | P a g e Practical No.2 Determination Dissolved Oxygen within Water Principal:- The Winkler Method is a technique used to measure dissolved oxygen in freshwater systems. The Winkler Method uses titration to determine dissolved oxygen in the water sample. A sample bottle is filled completely with water (no air is left to skew the results). The dissolved oxygen in the sample is then "fixed" by adding a series of reagents that form an acid compound that is then titrated with a neutralizing compound that results in a color change. The point of color change is called the "endpoint," which coincides with the dissolved oxygen concentration in the sample. Dissolved oxygen analysis is best done in the field, as the sample will be less altered by atmospheric equilibration. introduction Most natural waters contain small quantities of organic compounds. Aquatic microorganisms have evolved to use some of these compounds as food. Microorganisms living in oxygenated waters use dissolved oxygen to oxidatively degrade the organic compounds, releasing energy which is used for growth and reproduction. Populations of these microorganisms tend to increase in proportion to the amount of food available. This microbial metabolismcreates an oxygen demand proportional to the amount of orga
  • 8. 8 | P a g e Material Required:  Micro pipette  Bottle  Water  Manganous sulphate  Aluminum foil and a rubber  Sulfuric acid  Sodium thiosulfate  Starch indicator  Dropper Procedure: 1. Collect water in a bottle from this below the surface of water using the micropipette an ad 2 ML manganous sulphate to clear 300 ml BOD bottle filled with sample water. 2. Carefully collect sample water by not adding further oxygen in it by inserting that it below the water. 3. Carefully dispense manganous sulphate this will avoid air bubble and fix the sample for the proceeding. 4. The precipitated aggregation of material with a cloudy appearance will appear. 5. Fixed the sample to prevent change in dissolved oxygen content. 6. To avoid the addition of the oxygen the sample is stored using the Aluminum foil to cover the open mouth of the bottle and fix it by using the rubber.
  • 9. 9 | P a g e 7. Pipette 2 ml of sulphuric acid in the sample invert carefully several times to dissolve the floc. 8. Now, in a glass flask titrate 200 ml of sample water with a 0.025 standardize sodium thiosulphate and mixing a continuously until pale straw color forms. 9. Add 2 ml of starch indicator solution using dropper. The solution will turn blue. 10. Continue titration and point arise be careful stipend and you can hold a piece of paper against the glass beaker to clearly see the endpoint. 11. The concentration of dissolved oxygen is equal to the titrant used. Note: Each milliliter of sodium thiosulphate is equal to 1 mg/L of oxygen dissolved in water. Results: A dissolved oxygen level of 6 milligram/ L is sufficient for most affected species oxygen level below 4 milligram/L is stressful and even below 2 milligram /L will not sport aerobic aquatic life.  Measuring dissolved oxygen
  • 10. 10 | P a g e   Multi-parameter monitor used to record water-quality measurements.  Field and lab meters to measure dissolved oxygen have been around for a long time. As this picture shows, modern meters are small and highly electronic. They still use a probe, which is located at the end of the cable. Dissolved oxygen is dependent on temperature (an inverse relation), so the meter must be calibrated properly before each use.  Dissolved oxygen test procedure  You can measure Dissolved Oxygen in different ways. Electronic meter is one of the important methods. It does not measure oxygen directly, it measure the partial pressure of oxygen in the water. Then it would convert to oxygen mass weight concentration. The BOD is another significant method. It determines the oxygen requirements during a specified period of organic matter degradation. The other methods are drop bottle (iodometric), a microburet, or a digital titrator. The amount of oxygen dissolved in water is often expressed as ppm or mg/l.
  • 11. 11 | P a g e
  • 12. 12 | P a g e Factors affecting dissolved oxygen in water Several natural and man-made factors affecting dissolved oxygen in water such as temperature, nutrient pollution, altitude, salinity, organic waste. Photosynthesis The photosynthesis process occurs in presence of light and chlorophyll. Therefore huge amount of oxygen produces during day time. On the other hand the photosynthesis process terminates during night time. But at this time the respiration process occurs and consumes oxygen. As a result DO level higher at day time and lower at night time. Turbidity (due to suspended solids) can restrain the sunlight to go into the water that limits the photosynthesis process. Temperature There is a significant relationship between water temperature and DO concentrations. Oxygen easily dissolves in cool water. Cold water can holds more dissolved oxygen than warmer water. Moreover the solubility of oxygen in water decreases with the increases of temperature. Seasonal changes Seasonal changes is the another factor that affecting dissolved oxygen concentrations in water. During summer season the water becomes warmer. Therefore at this time water contains less DO. Conversely the water becomes cooler at the time of winter season. So this time the water holds more oxygen. Rainy seasons also effects on oxygen concentrations. As the rain water interact with the atmospheric oxygen then it tends to higher the dissolved oxygen level. Altitude The atmospheric pressure decreases at higher altitude. When the atmospheric pressure decreases then the solubility of oxygen in water also decreases. So the amount of oxygen decreases at higher altitudes than at low altitudes. Salinity Waters with high amounts of salt holds less oxygen than fresh water. Reason, the solubility of oxygen decreases if the salinity of the water increases. Hence the freshwater like lakes, streams, and tap water generally contains higher concentrations of DO than the ocean. Higher suspended solids in the water also decrease the DO. Moving water The ocean, rivers and streams water are moving water. When this water is moving then they contact
  • 13. 13 | P a g e with air. Oxygen concentrations are much higher in air than in water, which are about 21% and 5- 14 mg/l respectively. This huge difference of concentrations helps to dissolve the oxygen into the water. Moreover the volume and speed of moving water can also affect on dissolved oxygen levels. Organic waste The water may contain a lot of organic waste including leaves, grass, dead plants or animals, organic chemicals and sewage. Microorganisms like Bacteria decompose these materials by taking up oxygen. Therefore the levels of dissolved oxygen drop in the water body. Fertilizer Fertilizer runoff from farm fields and lawns may decrease The DO. As like land plants the aquatic plants also grow better with these nutrients. These large amounts of nutrients such as nitrate and phosphate help to produce great quantities of algae. When these aquatic plants die, then the bacteria decompose them by using large amounts of DO. This process is known as eutrophication. As a result Dissolved Oxygen levels can drop too low. 
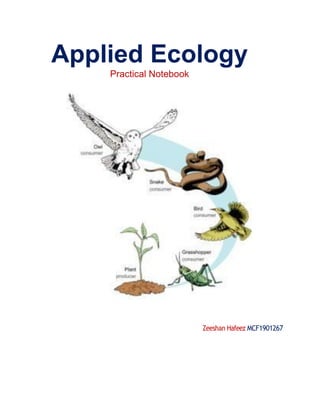
  • 14. 14 | P a g e Practical No.3 Adaptive Features of Animals in Relation to Food and Environment Theory: In an ecosystem, organisms interact with abiotic and living environment organism. Some of the most important interactions among species in an ecosystem community involve feeding. All living things need food for energy and we know there are producers, herbivores, carnivores, top coronavirus and decomposers. Objective:  Determine the place of an organism in a food chain.  Explain how and what is the sequence of energy transfer to different communities of organisms. Procedure: 1. Opened the online Virtual lab. 2. Shuffle the cards on the table and then placed them on the right empty portion and clicked the icon of desired information. 3. Facts, habitat and energy source study made us able to figure out a food chain. 4. A food web was designed as shown.
  • 15. 15 | P a g e We also observed the Producers, First-order consumer, Second-order consumer, Third- order consumer and the Decomposers. Observations: 1. Producer: Common Elder Habitat: Common header is a large shrub or small tree that is found in wooded areas, semi- wooded areas and in open fields. Facts: The common elder berries can be used to make Jelly, Pies and wine. Elderberries have been used as a remedy for upset stomach and as an eye salve. Energy: The common elder produces purple blackberries that serve as a food for birds and mammals. 2. First-order Consumer: White-Tailed Deer Habitat: White-tailed deer live in forest and semi forested areas to United States and one part of South America. Fact: It gets its name from a distinctive patch of white fur beneath its tail. When alarmed, this year leads into the air exposing the white marking other deer in danger. Energy: This white-tailed deer feed on grasses, berries and nuts leaves and grains. 3. Second-order consumer: Gray Fox Habitat: Gray fox lives in forest and semi forested areas throughout North America. Facts: Gray foxes are also ka tree-foxes because they often climb trees to rest, feed and hide from predators
  • 16. 16 | P a g e Energy: They get energy by feeding on small mammal, birds and vegetations. 4. Third-order Consumer: Grizzly Bear Habitat: The grizzly bear lives near the lakes, ponds and other wetlands in forests of North America. Facts: It is named from the long, silver tipped hairs on its back and shoulders that its coat a grizzled appearance. Energy: They have a varied diet that include fish, birds, mammals, turtles, frogs and fruits. 5. Decomposers: Bacillus subtillis Habitat: It is a common soil bacterium. Facts: Bacillus subtilis is found everywhere including on human skin. It often contaminates laboratory culture dishes. Energy: It breakdowns the organic material of soil.
  • 17. 17 | P a g e Practical No.4 Study the Plant Population Density (Quadrant and Mark Recapture Method) Materials Required:  Thread  Hammer  Nails Procedure: 1. Select a site for the study and hammer the nails on the site without harming the vegetation. 2. Fix four nails in the form of a square. 3. Each end of the nail is tied with the help of a thread making a 1m*1m quadrant. 4. Nine more similar quadrants are made at the site of the study. 5. The number of individuals of the species A present in the first quadrant are counted and the data is recorded in the table. 6. The number of individuals of species A in other quadrants is also counted and the data is recorded in the table. 7. Similarly, count the number of individuals of species B and C present in all the quadrants and record the data in the table. The density of the plant population is then calculated by the following equation: Density = Total number of individuals of the species in all sampling units (S) / Total number of sampling units studied (Q).
  • 18. 18 | P a g e Conclusion: The population density is the highest for species A and the lowest for species C. The density value is expressed as the number of individuals per unit area. Mark Recapture Method Procedure: 1. This technique is used to simulate a population estimated by a wildlife biologist in the field. 2. The first step is to trap a random sample of animal of the species being studied. 3. These animals are then marked in some manner appropriate to the species and released. 4. In next step do another trapping. 5. Some animals capture d may have been marked from the first sample. 6. Using a simple ratio, a quick population estimated. 7. Petersen-Lincoln estimator of population size can be made as follows: N=population estimate M=number of individuals capture in 1st sample and marked N=number of individuals captured in second sample. M=number of n that were already marked Assuming that marked proportion in the sample is equal to the marked proportion in the population suggest that N/M=n/m To solve for N we rearrange the formula N=nM/m
  • 19. 19 | P a g e Practical No.5 Experimental Design and Approaches to Ecological Research (Writing a Research Project) The Summary: The major steps to write an ecological research project is 1. To select a topic 2. Ask question or enquiry 3. Conduct a preliminary research 4. Gather and evaluate sources 5. Free right to build up cited page 6. Complete draft 7. Workshop draft for structure 8. Revise and refine draft 9. Finalize project for submission Title clearly conveys the theme of the research project and the main Research question will increase the focus of the research the explanation is to explain that why our research is important and a brief literature review shows that you possess relevant knowledge to answer the Research question the proposed methodology for answering the Research question must be accurate at the time schedule for research project is also very essential. 1. Topic: The topic is assigned by the teacher or the teacher asked the student to think and discuss and then decide the topic. 2. Observation: The students gather the information by asking questions to the teachers and researchers and the best possible way to collect the observation is to study the already “published paper” of the researchers we can also call it as Review of Literature. 3. Research Work: Research work can also be classified as sampling that is the field work and the second possible way is the laboratory work. 4. Writing a Project:
  • 20. 20 | P a g e All the gathered information from studying the research papers and from the experimentation the information is compiled or collected, in the form of the writing .If you are writing for an organization then the funding performer of that organization is filled. Submission: The compiling for the submission of the project also has a sequence. It includes:  Abstract  Introduction  Review of literature  Methodologies  Result  Discussion  And References.