
Recommandé
Recommandé
Contenu connexe
Similaire à State of the Construction Industry in Georgia
Similaire à State of the Construction Industry in Georgia (20)
Dernier
Dernier (20)
State of the Construction Industry in Georgia
- 1. The construction industry in the United States is the second largest industry, with only the health care industry being larger. Construction within the United States has four different sectors with their own unique qualities. While nationwide the industry was hit hard by the economic issues of late but is showing signs of recovery. However on the state level recovery has depended on the state. Four Sectors of Construction Commercial construction has been amongst the most commonly diverse sector of construction. Construction within this sector can be both public and privately funded. Projects of this type often range in size from several hundred thousand dollars, to multi-million dollars. Construction within the commercial sector include office buildings, school, and other types of building that do not fall into the residential sector of construction. Projects where people reside fall into the residential sector of the construction industry. These projects are often non-bid based projects. Owners of these types of projects usually negotiate a price with the builder in order to complete the construction. This type of construction typically has private ownership, with small amounts being owned by public interests. Industrial construction is another of the four sectors of construction. This sector has a diverse set of ownership, with often public or private ownership. Projects within this type of construction include manufacturing plants, pipelines, refineries, electrical plants, and high-tech facilities. These projects typically cost millions of dollars to complete, and are often subjected to intense regulations. Builders who bid for and complete these projects are usually specialists in this type of construction. The fourth sector of the construction industry is Heavy Civil/Highway. The owners of this type of project are typically public, and the contracts are awarded to the lowest bid. Contractors who bid on these types of projects are often required to prequalify, meaning that they have to have the bonding capacity, and technical and management abilities to take on such a project. An owner of this type of project may make a contractor submit proof of previous experience in this type of construction. Projects within this sector include waste water treatment plants, bridges, dams, canals, levees. This sector also includes highways, railroads, and tunnels.
- 2. National and State Trends in Construction National trends in construction have been begun to decrease in years following the economic troubles of the United States. Residential construction peaked in 2005, and continued to decrease through 2010. However in 2011 it is expected to show an increase. Non-residential construction has decreased since its peak in 2008, however it has not been a dramatic a decrease as residential construction has shown. At the state level in Georgia construction of non-residential projects has increased from the amounts prior to the turn of the century, but has slipped towards the end of the decade. Residential construction at the national level looking from 2003 to 2011, showed an increase in construction value from 2003 to 2005. The amount of put-in place construction in 2005 when it peaked was valued to 1.3 times the amount of construction put in place in 2003. However trends show the amount of put-in place residential construction decreasing at a steady rate from 2006 to 2010. In 2006 the year following the residential construction’s peak in 2015 saw a decrease from 655,619 million dollars to 587,390. In 2010 the amount of residential put-in place construction was valued at 251,179 million compare to the peak value in 2005 of 655,619 million (Construction Spending, 2011). However through July, 2011 the national value of put-in place residential construction is on pace to exceed that value of 2010, according to the US Census website (US Census Bureau, 2011). National trends in non-residential construction show an increase in the amount of put-in place construction from 2003 to 2008. However the amount of non-residential from 2002 to 2003 saw a small decrease. From 2003 to its peak in 2008 non-residential construction saw an increase from 425,651 million dollars to 726,840 million. From its peak in 2008 non-residential construction to 2010 saw in decrease in the amount of put-in place construction from 726,840 million to 563,014 million (Construction Spending, 2011). In 2011 current information available from the US Census website show that non-residential put-in place construction is on track to exceed the value of 2010 (US Census Bureau, 2011). National trends in non-residential put-in place construction show a steady decrease in the amount of construction, while in the State of Georgia there has been a more an increase from 1997 to 2002, and decrease in the amount of non-residential put- in place construction from 2002 to 2007. In 1997 the valued amount of non- residential construction was 7,977.765 million dollars, and increased to 18,276.571 million in 2002 (1997 Economic Census: Construction Georgia, 2001) (2002 Economic Census: Construction Georgia, 2011). From the 2002 Economic Census to 2007 Economic Census saw a decrease in the amount of put-in place commercial and industrial projects, while heavy civil increased (2007 Economic Census: Contructon Georgia, 2010). From 1997 to 2002 the US Economic Census did
- 3. not differentiate public form private owned construction projects for the State of Georgia. In the 2007 Economic Census the US Census Bureau started differentiating between private and public projects.
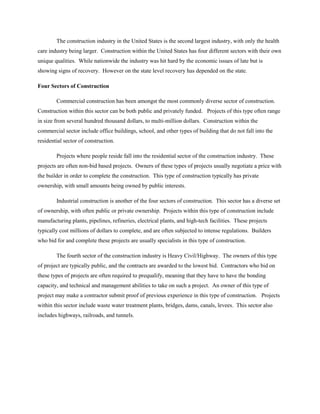
- 4. Memorandum of Content Four Sectors of Construction The four sectors of construction are residential, commercial, industrial, and heavy civil/ highway. Residential construction focuses on the construction housing for people. Commercial construction focuses on the construction of office building, schools, and other projects that don’t fall with any of the other three sectors of construction. The industrial sector of construction includes the building manufacturing plants, and other production based facilities. Heavy Civil/Highway sector of the construction includes the building of roads, bridges, and water treatment plants. While residential construction projects are typically owned by private interests; commercial, industrial, and heavy & civil projects can be owned by either public or private interests. National and State Trends National residential put-in place construction trends show as detailed by the first chart on the flowing page that the amount of construction increased from 2003 to 2005, where residential put-in place construction peaked (US Census Bureau, 2011). From 2006 to 2010 put-in place residential construction decreased as shown on the first chart on the following page. Through July 2011, the US Census Bureau shows that the amount of put-in place residential construction is on pace to exceed construction done during 2010 (Construction Spending, 2011). National non-residential put-in place construction peaked in 2008, and showed a steady decrease from 2009 to 2010. The second chart on the following page shows this increase and decrease. According to the US Census Bureau reports show that non-residential put-in place construction is on pace in 2011 to exceed that of 2010, also shown on the second chart. (Construction Spending, 2011) Put-in place construction in Georgia has shown an increase from the 1997 Economic Census to the 2002 Economic Census in non-residential put-in place construction. In the 2007 Economic Census there was a drop in put-in place construction, in commercial and industrial sectors, while heavy civil/highway has increased (2007 Economic Census: Contructon Georgia, 2010). During the 1997, and 2002 Economic Census the US Census Bureau did not differentiate public from private put-in place construction. The Census Bureau did start differentiating in 2007 from public and private, but did not disclose private industrial construction. Chart shown on second page of charts includes data from both private and public non-residential construction within the state.
- 5. Charts National Put-In Place Residential Construction Chart 700,000 600,000 Through July 2011 500,000 2010 2009 400,000 2008 2007 300,000 2006 200,000 2005 2004 100,000 2003 0 National Put-In Place Residnetial Contruction in Million of Dollars National Put-In Place Non-Residential Construction 800,000 Through July 2011 700,000 2010 600,000 2009 500,000 2008 400,000 2007 300,000 2006 2005 200,000 2004 100,000 2003 0 2002 National Put-In Place Non Residential Construction in Millions of Dollars
- 6. Georgia Non-Residential Put-In Place Construction in Thousands of Dollars 20,000,000 18,000,000 16,000,000 14,000,000 12,000,000 1997 10,000,000 2002 8,000,000 2007 6,000,000 4,000,000 2,000,000 0 Commerical Heavy and Civil Industrial Total
- 7. Works Cited 1997 Economic Census: Construction Georgia. (2001, Feburary 6). Retrieved October 8, 2011, from 1997 Economic Census: http://www.census.gov/epcd/ec97/ga/GA000_23.HTM 2002 Economic Census: Construction Georgia. (2011, July 11). Retrieved October 8, 2011, from 2002 Economic Census: http://www.census.gov/econ/census02/data/ga/GA000_23.HTM 2007 Economic Census: Contructon Georgia. (2010, October 19). Retrieved October 8, 2011, from 2007 Economic Census: http://factfinder.census.gov/servlet/IBQTable?_bm=y&-geo_id=04000US13&ds_name=EC0723SG01&-_lang=en Construction Spending. (2011, August 1). Retrieved October 9, 2011, from US Census Bureau: http://www.census.gov/const/C30/total.pdf Knutson, K., Schexnayder, C., Fiori, C., & Mayo, R. (2009). Construction Managment Fundamentals. New York: McGraw-Hill. US Census Bureau. (2011, September 1). Retrieved October 9, 2011, from Construction Spending: http://www.census.gov/const/C30/pr201107.pdf
- 8. Neal Dudash CSM 205 Fall 2011 Dr. Marshall State Report 10/11/2011