Ohop Creek Restoration Phase I & II Wildlife Survey Report
•
1 j'aime•754 vues

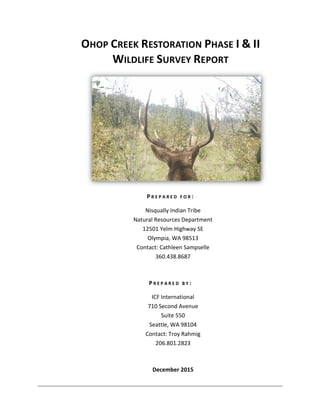
The document provides a wildlife survey report for the Ohop Creek Restoration Project Phase I & II conducted by ICF International for the Nisqually Indian Tribe Natural Resources Department between 2014-2015. The surveys found evidence that elk were the most abundant species using the restoration site, followed by deer and coyotes. Beaver activity was also documented moving southward along the restored creek channel over time. Bird nesting activity and species were additionally recorded during the spring and summer months.

Recommandé
Recommandé
Contenu connexe
Tendances
Tendances (17)
Similaire à Ohop Creek Restoration Phase I & II Wildlife Survey Report
Similaire à Ohop Creek Restoration Phase I & II Wildlife Survey Report (20)
Plus de Nisqually River Council
Plus de Nisqually River Council (20)
Dernier
Dernier (20)
Ohop Creek Restoration Phase I & II Wildlife Survey Report
- 1. OHOP CREEK RESTORATION PHASE I & II WILDLIFE SURVEY REPORT P R E P A R E D F O R : Nisqually Indian Tribe Natural Resources Department 12501 Yelm Highway SE Olympia, WA 98513 Contact: Cathleen Sampselle 360.438.8687 P R E P A R E D B Y : ICF International 710 Second Avenue Suite 550 Seattle, WA 98104 Contact: Troy Rahmig 206.801.2823 December 2015
- 2. 2 ICF
- 3. 3 ICF Nisqually Indian Tribe Natural Resources Department. 2015. Ohop Creek Restoration Phase I & II Wildlife Survey Report. December. Olympia, WA. Prepared by ICF International (ICF 00480.14.).
- 4. 4 ICF Contents Introduction............................................................................................................................................6 Goals of the Wildlife Surveys..................................................................................................................6 Existing Data and Local Knowledge........................................................................................................6 Survey Methods......................................................................................................................................7 Results and Discussion .........................................................................................................................10 Conclusions...........................................................................................................................................17 Recommendations................................................................................................................................18 Literature Cited.....................................................................................................................................19 List of Tables and Figures Table 1. Wildlife Species By Pedestrian Transect Table 2. Motion Activate Wildlife Camera Result By Species, Summer 2014 – Fall 2015 Table 3. Birds Detected at the Ohop I & II Restoration Site, Fall 2014 – Fall 2015 Table 4. Nesting Bird Activity Detected Spring and Summer 2015 All figures are located after Page 19. Figure 1. Wildlife Detections By Transect Figure 2. Beaver Activity on the Ohop Restoration Site Figure 3. Bird Nesting Activity and Behavior Appendices Appendix A. Selected Photos From Wildlife Cameras 2014 – 2015 Appendix B. As-built Planting Schematic for Ohop Restoration Project Appendix C. Bird Species Detected by Northwest Trek 2008-2012
- 5. 5 ICF
- 6. 6 ICF Introduction As part of ongoing multi-species management for the Nisqually River Basin, together with multiple partners including the Nisqually Land Trust and the South Puget Sound Salmon Enhancement Group, the Nisqually Tribe has completed Phase I & II of the Lower Ohop Restoration Project (Project). The Project completed remeander construction and replanting of 1 mile of lower Ohop Creek and the surrounding 100 acres near Eatonville, WA in 2014. Some replanting and continued maintenance of the restoration continued in 2015. Although designed for the purposes of improving salmon habitat, creek morphology, and floodplain functions, the project is expected to benefit multiple species, which will likely use the more diverse vegetation communities supported by a natural functioning stream (Gardali et al. 2006). Funding for this Wildlife Survey Report was provided by the US Fish and Wildlife Service. Goals of the Wildlife Surveys In order to document the diversity of wildlife using the Project site, systematic surveys for various wildlife species were completed between October 2014 and November 2015. This observational data was collected to not only determine how the Project site is functioning for wildlife in the early stages of restoration, but to better understand how the Project site fits into the regional picture for wildlife species. The wildlife survey effort focused on mammalian and avian species during fall, winter, spring, and summer. This one year of data collection is enough to make some anecdotal claims regarding wildlife use at the site. Many more years of data collection would need to be completed to determine how the restoration of Ohop Creek will influence changes in wildlife use patterns over time. The data collected in 2014/2015 will serve as an important baseline for any future studies. The wildlife surveys included separate efforts for the following species/groups, all of which are described in detail in later sections: A. Deer (Odocoileus hemionus) and Elk (Cervus elphus) B. Beaver (Castor canadensis) C. Migratory/Breeding Birds D. Anecdotal Wildlife Observations Existing Data and Local Knowledge All data collection efforts are made stronger when they are added to, or put in the context of, existing longer term data collection efforts. Existing wildlife observations and wildlife habitat classifications data were sought from the local and regional sources in order to provide a baseline and regional context for the information collected at the Project site. Known sources include:
- 7. 7 ICF Wildlife observations from the Northwest Trek Ohop Valley Creek Monitoring – 2008-2012 [currently available], and potentially more recent data. Washington Department of Fish and Wildlife (WDFW) Priority Habitats and Species Program; Priority habitat and species observation data. Pierce county biodiversity network; Species observations, habitat and connectivity models (Brooks et. al 2004). In addition to assimilating existing data on wildlife use in the Nisqually River Basin, other natural resource managers were contacted to determine how/or if they are monitoring wildlife on their lands and how the Lower Ohop Creek Restoration Site fits into the regional movement patterns and trends. Survey Methods The purpose of the wildlife surveys was to document the species of wildlife using the restoration site currently. Surveys began in October 2014 and were conducted on approximately a bi-monthly schedule through November 2015. There was some variability in survey schedule due to weather or the condition of the project site, as described below. Mammals Line Transects Pedestrian line transects were the most common method used for determining the presence and abundance of terrestrial mammals, especially ungulates. Walking line transects allowed observers to document animals and their sign. Like any standardized survey method where a particular location or set of locations is surveyed repeatedly it allowed for the construction of a more robust picture of animal use of an area, as opposed to a one-time survey, which may or may not detect animal presence. Pedestrian surveys were discontinued starting in about May, because grasses at the site made it impossible to detect animal sign consistently. Start and end points were chosen for line transects and each transect survey started and ended at one of the two end points (Figure 1). Transect surveys did not need to be conducted in the same direction every time, however, the direction that the transect was travelled was noted on data sheets. The direction a transect was walked was influenced by factors such as the time of the day and weather conditions to account for the location of the sun or the direction of the wind. Transect surveys were conducted at various times of day, though the majority of the surveys were conducted first thing in the morning to yield more observations, when animals are typically more active. The start and stop time of each transect were recorded as was the distance traveled along the transect. Transects were generally in a straight line between start and end points, but due to uneven terrain the surveyor may have varied from the straight line at times to navigate around trees, vegetation, or water. When an animal or animal sign was
- 8. 8 ICF observed during a transect the species, number, and male/female/young/undetermined breakdown was be recorded. Beaver Surveys Beaver surveys involved a less rigorous survey approach than those listed above and below. In this case the surveyor walked the bank of the realigned Ohop Creek, and adjacent sloughs and waterways looking for evidence of beaver. The start and stop time of the beaver survey was recorded so that a total survey effort (time) was tracked. Evidence of beaver was noted and a GPS point was taken. This allowed for the tracking of beaver activity over time. Camera Trapping Seven camera trapping stations were established on the Project site in the summer of 2014 (Figure 1). In early 2015 two more cameras were installed. At various points during the year two of the cameras were stolen. Camera 6 was stolen in the fall of 2014 and Camera 7 was stolen in the late summer of 2015. Cameras were run continuously while they were installed. The locations of the cameras are shown in Figure 1. Those camera stations were used to document mammal use of the Project area in conjunction with the survey information collected above. Camera stations provide information on nocturnal and wary species which may not be captured effectively using the above methods. In addition, images from the camera traps assisted in the identification of mammals detected from inconclusive sign such as tracks (e.g. coyote [Canis latrans] vs dog [Canis familiaris]) and scat. Camera Checks Cameras were visited about monthly. Each camera was tested to be sure that it was functioning property. Batteries were tested and replaced as needed. Once batteries were replaced the date and time were checked and reset if needed. All cameras were set to 24-hour mode and took two photos per detection. These settings were confirmed during each site visit. Any necessary resets, date, time, or otherwise, were noted in field notebooks. During each site visit the data card for each camera was changed out. Each camera has two assigned data cards (typically labeled as card A and B). The card that was removed from the camera was noted and the card that was placed in the camera was also noted. Following placement of the card and the steps outlined above, the camera was set to the “on” position, closed and left. If at any point a camera was damaged, lost, or had fallen off of the location where it was placed, this was noted. Moving Camera Locations Camera locations were moved if they were not functioning properly in the currently location, were not getting any wildlife detections, or if there seemed to be a threat of damage or theft. If a camera was moved the new location was taken using a GPS unit and the latitude and longitude of the location noted on the data sheet as well as entered into the camera (all photos are tagged with camera number and location). A photograph of the camera mounted in the new location was taken and archived. New camera locations were promptly shared with Nisqually Indian Tribe Natural Resources Department staff, who shared with crews working at the site including Nisqually Land Trust staff.
- 9. 9 ICF Analyzing Photographs All photographs were downloaded from the data cards upon returning from the site visit. All photographs were stored in a location that was backed up, in case of server failure, to prevent data loss. Photographs were catalogued by camera number and also by camera check date. Photographs were sorted into two categories, 1) No Wildlife, or 2) Wildlife Detection. Wildlife were identified to species (if possible) and the detection was tracked on a running data sheet noting wildlife detections by camera traps. In many cases there were multiple photos on the same animal or group of animals. All photos were saved for analysis. Sometimes it took the screening of several photos of the same camera event to determine how many animals were present. This was especially true of elk herds. Once the number of animals was determined the photo that best represented the camera event was saved as the record of the event. Migratory, Game, and Breeding Birds Area Searches Originally variable point count surveys were proposed as a way to determine what species of migratory birds were using the Ohop Creek Restoration Site during the nesting season. However, due to the small size of the project area point count surveys proved ineffective because of the high degree of overlap between point count locations and the potential for double counting of birds. Birds could be heard from multiple points throughout the survey and many of the birds detected were outside of the restoration project site; information that was not particularly relevant to the study. Variable point count surveys were abandoned in favor of areas search surveys (Ralph et al. 1993). Area search surveys (Ralph et al. 1993) were used to assess abundance of birds and habitat associations during the migration and non-breeding seasons, when point count surveys are less effective. A modified version of the area search technique was used to document migratory birds at the site. Essentially, while pedestrian transects were being walked for terrestrial mammals, all bird species heard or seen were recorded. Because the site is small (~100 acres) it was not practical to attempt to discern what part of the site birds were using specifically. For example, while walking a transect in the southeastern corner of the project site, a bird could be heard from locations off site, as well as locations west of the main channel – an area that would be surveyed during another pedestrian survey that same day. So it became more practical to just catalogue bird species generally without trying to make too many determinations about what types of habitat each bird was utilizing. Breeding Bird Survey Breeding, or nesting, bird surveys were also conducted during the breeding season to determine what species were utilizing the site for breeding. The methodology for these surveys was similar to other transect surveys conducted in that transects were walked throughout the site while the observer focused on finding nests and on breeding behaviors or signs of nesting by birds on site. Nests were found by actively looking into vegetation for nests, or by observing behaviors and signs of breeding by birds. These behaviors included but were not limited to,
- 10. 10 ICF territorial males and/or females, individuals returning to the same location in a tree or other vegetation bring nesting material for nests (in the nesting building stage) or food items (feeding chicks), and birds flushing from an area when the observer walked by. Each area of the site was surveyed twice during the breeding season; once in May 2015 and once in July 2015. Evidence of nesting was also documented during other transect surveys conducting in the breeding season. Results and Discussion Mammals Line Transects The only animals seen on transect surveys were coyotes (possibly the same individual on different days). No elk or deer were observed during transect surveys. However, there was lots of animal sign noted, mostly scat and occasionally tracks. Animal scat was detected on nearly every pedestrian transect. From these transects it was clear that elk was the most abundant species using the site. Deer scat was also detected, but at a much lower rate than elk. The only other species detected during pedestrian surveys was coyote. Coyotes were only detected four times and each time the detection consisted of a lone individual. Coyote scat was often seen around the site, but at lower rates that elk and deer. The results of the transect surveys are shown in Figure 1 and Table 1. Signs of elk and deer were seen all across the site, but the heaviest concentrations were in the southeast corner of the site where Highway 7 bisects the site. Elk used the southeastern part of the project site consistently throughout the year. In the late summer and early fall of 2015 higher concentrations of elk were observed in the northeastern corner of the site. During that time of year the grass was quite tall and it was evident where elk moved through the area because grass was trampled and scat was visible. In many cases it appeared that elk had bedded down on the site. The southwestern corner had very little activity as did the area west of the main channel between Highway 7 and Peterson Road. The area east of the main channel between Highway 7 and Peterson Road did have animal activity but due to the wet nature of that part of the project site, it was either mostly inaccessible, or animal sign was not easy to see because of consistent ponding. Seasonal Trends Due to changes in the amount of water that was pooled on the site during different times of year and the changes in vegetation, such as increased grass growth in the summer, which inhibited surveyors ability to detect tracks and scat, transect surveys were most reliable during the winter and spring months. Because of this variability in survey effort, motion activated cameras (discussed below) were a more reliable monitoring tool to track wildlife use through the entire year.
- 11. 11 ICF Table 1. Wildlife Species Detected By Pedestrian Transect During 2014-2015 Surveys Transect Number Species Detected Number of Detections Form of Detection 1 Beaver 1 Activity 1 Elk 1 Scat 2 Beaver 1 Animal 2 Coyote 2 Scat 2 Elk 5 Animal 2 Unknown 1 Scat 3 Coyote 1 Scat 3 Elk 5 Animal, Scat 4 Beaver 1 Activity 4 Coyote 1 Animal 4 Elk 6 Animal, Scat 5 Beaver 2 Activity 5 Elk 2 Animal, Scat 6 Beaver 3 Activity 6 Elk 9 Animal, Scat 7 Coyote 2 Animal 7 Elk 3 Animal Beaver Surveys Only one beaver was seen during all surveys. This beaver was on the west side of the bank south of Highway 7 in the summer of 2015. This detection was notable because it was actually some distance away from most of the beaver activity noted on the site. Seasonal Trends Once surveys commenced in fall 2014 it was apparent that there was some beaver activity on the north side of the project site, along the wetted area that exists between the restoration site and the private lands to the north (Figure 2). Activity was noted as trees downed by beaver or other chewing activity on trees still standing, but notably damaged. Some of the activity looked quite old. Through the winter and into the spring the beaver activity moved southward along the channel and eventually there were beaver damaged trees from the northern border of the site all the way south to Peterson Road. Then in late spring and into the summer of 2015 beaver activity was detected south of Peterson Road on the west side of the main channel, and since then the beaver activity has continued to move south; including the beaver that was sighted south of Highway 7. By fall 2015 there are many trees within the site that have been downed by beaver, most of which are still on the northern half of the site. Some of those trees were dragged into the channel and others remained on the banks.
- 12. 12 ICF Camera Trapping The results of the camera traps supports what was seen on the pedestrian surveys but provides a much more thorough accounting of wildlife activity across the site year-round. Nearly all of the animals using the site visited at night. The few exceptions were coyotes and occasionally a deer or elk just after sunrise. There were several bird detections on Camera 3 due to the fact that the camera was mounted on an old fence post and birds would often perch on the post or the nearby fence. All bird detections were during the day. Elk was by far the most detected animal on the camera traps. In part this was because they travelled in herds, and at times, 2-6 individuals were detected by a single camera. The area around Highway 7, in the southeastern part of the project site was the most heavily used. This is revealed by the number of detections at Cameras 4 and 5. Elk would likely access the site from the southeast, moving down out of the forested hills at night to feed. They would move onto the site and cross Highway 7 frequently. This create a noticeable elk trail on both sides of the highway in that location. No road kill elk were detected but it is an area of high vehicle risk. Table 2 shows a breakdown of wildlife detected at each camera. A direct comparison cannot be made between all cameras because cameras were operational for different periods of time. For example, Cameras 3, 4, and 5 were operational for the entire study and the number of detections reflects that. Camera 1 was placed during the week of July 7, 2014. It was then moved on July 24th. Both the former location and the actual location are shown on Figure 1. Cameras 1-7 were all placed in the locations shown on Figure 1 on July 24th. Cameras 1 and 2 were operational for the entire study but in the final three weeks of the study period, in late 2015, the camera cards were ejected and then not properly reinstalled by someone who had access to the site. This resulted in a few lost trap nights. However, even with out those trap nights it is obvious that there is much less animal activity around Camera 1 and about half as much around Camera 2, when compared to Cameras 3-5. Camera 6 was lost early in the study period and Camera 7 was lost during the summer of 2015, resulting in fewer trap nights for those two cameras. Cameras 8 and 9 were placed on January 8, 2015, much later in the survey period. So comparisons between camera locations is difficult, but it is possible to note some general patterns. Clearly the most heavily used part of the site was the southeastern corner and the northwestern corner. Cameras 3, 4, and 5 accounted for 75% of all animal detections on the site. The activity was corroborated by the amount of sign and tracks seen between Cameras 4 and 5. That level of activity, primarily by elk, was not observed on any other part of the site. The total number of animals detected on Camera 3 was boosted by the 45 bird detections discussed above, and the 46 coyote detections, the most on any camera. The only part of the site where deer seemed to be present with a high frequency, when compared to elk, was in the southeastern part of the site as reflected by Camera 9. This camera was only installed for several months in 2015 so that pattern possibly could change during the winter, when deer use the site less frequently. More trap days would be necessary to draw any conclusions about whether deer really are more present on that part of the site than elk.
- 13. 13 ICF Table 2. Motion-activated Wildlife Camera Summarized by Species, Fall 2014 – Fall 2015 Number of Detections By Species Camera Feral Cat Dog Coyote Deer Elk Bird Unknown Total Percent of Total 1 - - 4 3 5 1 3 16 1 2 1 - 13 1 133 - - 148 11 3 - 1 45 9 204 46 13 318 23 4 - 2 26 7 235 10 37 317 23 5 - - 12 7 345 - 32 396 29 6 - - 1 7 59 - 10 77 6 7 1 - 14 - 3 - - 18 1 8 - - 1 3 42 - 6 52 4 9 - - 3 13 7 - 2 25 2 Total 2 3 119 50 1,033 57 103 1,367 - Percent of Total <1 <1 9 4 76 4 8 - Seasonal Trends Beyond opportunistic observations by Northwest Trek, there was very little information available regarding animal use of the Ohop Creek drainage. There is clearly some seasonality to how animals use the site at present. There was much more activity detected on the camera stations during the fall and winter months than there was during the spring and early summer. During the spring elk were largely absent from the site and deer were absent altogether. By around June the elk returned in larger numbers and by July many parts of the site were used heavily. This was apparent because vegetation was trampled and there was extensive elk sign in those locations. In late spring and through the summer months, camera trapping became increasingly difficult due to the height of vegetation (mostly grasses) on the project site. Many of the cameras had to be moved up quite high on trees to be out of the vegetation. In some cases this may have resulted in missed detections of animals closer to the ground. However, in general, in locations where grasses were tall enough to make use of the cameras difficult, there was not much evidence of animal use. Perhaps the grass height was a deterrent to animal movement for part of the year. Coyotes seemed to use the site during all months, although they were detected on cameras more frequently in the fall and winter months. This could have been a result of vegetation height during the summer months.
- 14. 14 ICF Elk Hoof Disease Elk hoof disease, likely a bacterial infection, that causes deformities in the hooves of elk and shows signs of deteriation on the body, has been detected in the region. The most common way that presence of this disease is detected is through observation of limping elk. Since elk were rarely seen by observers there was limited opportunity to see limping elk. Limping cannot be detected on still photos. At times the body condition of elk can deteriorate as a result of the disease, especially if an animal has been persiting with it for a longer period of time. All of the elk observed during 2014-2015 seemed to have good body condition with no evidence of hoof disease. Additional screening of the photos could be conducted by WDFW to confirm this. Migratory, Game, and Breeding Birds Fifty five species of birds were detected on the site during the survey period. The most prevalent bird species documented year round was the song sparrow (Melospiza melodia). Red- winged blackbird (Agelaius phoeniceus), marsh wren (Cistothorus palustris), common yellowthroat (Geothlypis trichas), and cedar waxwing (Bombycilla cedrorum) were other bird species detected in high numbers. During the breeding season surveys, song sparrow, common yellowthroat, marsh wren and red-winged blackbird were the most frequently detected during May 2015. A colony of red-winged blackbirds established at the site on the east side of the channel, between Peterson Road and Highway 7, but the colony disbanded before any young could be fledged because water levels dropped in this otherwise marshy area. It is likely that the drop in water levels allowed access from land predators such as feral cats and coyotes, though this was not confirmed. A complete list of bird observed on the site and the season in which they were detected is shown in Table 3. During the July 2015 surveys, though song sparrow and common yellowthroat nesting activities were still detected, it was at a lower rate than in May. The majority of the individuals detected of those species were newly fledged juveniles. Willow flycatcher (Empidonax traillii) and cedar waxwing were the most frequent nesting species on site. Several nests of both species were found throughout the site (Figure 3). Very few marsh wren nests and no nesting red-winged blackbirds were observed during the July surveys. Additional species observed breeding or with newly fledged juveniles included marsh wren, American goldfinch (Carduelis tristis), wood duck (Aix sponsa), mallard (Anas platyrhynchos), cliff swallow (Petrochelidon pyrrhonota), yellow warbler (Setophaga petechia), and brown-headed cowbird (Molothrus ater) (fledgling observed with adult willow flycatcher). Observations of bird species made by Northwest Trek in previous years (from 2009 to 2012) were similar to observations made in 2014 and 2015. There were six species that were observed during the 2014-2015 surveys that were not seen in previous years: black-headed grosbeak (Pheucticus melanocephalus), hooded merganser (Lophodytes cucullatus), northern harrier (Circus cyaneus), sharp-shinned hawk (Accipiter striatus), and western tanager (Piranga ludoviciana). There were 40 species listed by Northwest Trek that were not observed during the 2014-2015 surveys. Northwest Trek detected a higher number of species over the years likely because of a greater survey effort during those years, both in number of visits and the number of surveyors present during each visit. A complete list of species observed by Northwest Trek is shown in Appendix C.
- 15. 15 ICF Table 3. List of Bird Species Observed During Transect and Nest Surveys Scientific Name Common Name Season Observed Migratory (M) or Year Round Resident (YR) Accipiter striatus Sharp-shinned Hawk Winter M Agelaius phoeniceus Red-winged Blackbird Fall, Winter, Spring, Summer YR Aix sponsa Wood Duck Summer YR Anas platyrhynchos Mallard Winter, Spring, Summer YR Ardea herodias Great Blue Heron Winter, Summer YR Bombycilla cedrorum Cedar Waxwing Fall, Summer YR Branta canadensis Canada Goose Fall, Summer YR Buteo jamaicensis Red-tailed Hawk Fall, Winter, Summer YR Carduelis tristis American Goldfinch Winter, Summer YR Cathartes aura Turkey Vulture Summer M Catharus ustulatus Swainson's Thrush Summer M Ceryle alcyon Belted Kingfisher Fall, Winter, Spring, Summer YR Circus cyaneus Northern Harrier Winter, Summer YR Cistothorus palustris Marsh Wren Fall, Winter, Spring, Summer YR Colaptes auratus Northern Flicker Summer YR Corvus brachyrhynchos American Crow Fall, Winter, Summer YR Corvus corax Common Raven Fall, Winter, Summer YR Cyanocitta stelleri Steller's Jay Fall, Winter YR Empidonax traillii Willow Flycatcher Summer M Falco sparverius American Kestrel Winter, Summer YR Gallinago delicata Wilson’s Snipe Fall, Winter, Spring, YR Geothlypis trichas Common Yellowthroat Spring, Summer M Haemorhous mexicanus House Finch Summer YR Haemorhous purpureus Purple Finch Summer YR Hirundo rustica Barn Swallow Summer M Ixoreus naevius Varied Thrush Winter YR Junco hyemalis Dark-eyed Junco Winter, Summer YR Lophodytes cucullatus Hooded Merganser Winter YR Melospiza melodia Song Sparrow Fall, Winter, Spring, Summer YR Mergus merganser Common Merganser Spring M Molothrus ater Brown-headed Cowbird Summer M Passerina amoena Lazuli Bunting Summer M Petrochelidon pyrrhonota Cliff Swallow Summer M Pheucticus melanocephalus Black-headed Grosbeak Spring M Poecile atricapillus Black-capped Chickadee Fall, Winter, Summer YR Picoides pubescens Downy Woodpecker Summer YR Picoides villosus Hairy Woodpecker Fall, Winter, Spring YR Pipilo maculatus Spotted Towhee Fall, Winter M Piranga ludoviciana Western Tanager Summer M Psaltriparus minimus Bushtit Summer YR Rallus limicola Virginia Rail Winter YR Selasphorus rufus Rufous Hummingbird Spring, Summer M Setophaga petechia Yellow Warbler Summer M Setophaga townsendi Townsend's Warbler Fall, Winter M Sphyrapicus ruber Red-breasted Sapsucker Fall, Summer YR Stelgidopteryx serripennis Northern Rough-winged Swallow Summer M Sturnus vulgaris *European Starling Summer YR
- 16. 16 ICF Scientific Name Common Name Season Observed Migratory (M) or Year Round Resident (YR) Tachycineta bicolor Tree Swallow Summer M Tachycineta thalassina Violet-green Swallow Summer M Thryomanes bewickii Bewick's Wren Summer YR Troglodytes troglodytes Winter Wren Winter M Turdus migratorius American Robin Fall, Winter, Spring, Summer YR Zenaida macroura Mourning Dove Summer YR Zonotrichia atricapilla Golden-crowned Sparrow Fall, Winter M Zonotrichia leucophrys White-crowned Sparrow Fall, Winter, Summer YR * Non-native Species Seasonal Trends Of the 55 bird species detected on the site from fall 2014 – fall 2015, 41 of those species were detected during the summer months, the most bird species diversity detected during the year. This is typically due to migratory species that arrive for the breeding season. Of the 41 species detected during the summer, 21 of those species were not detected during other seasons, meaning they were only using the site during the breeding season. Beyond the 41 species detected in the summer, 12 were detected in the spring, 27 were detected in the winter, and 20 were detected in the fall. Only five species were detected during all four seasons, red-winged blackbird, belted kingfisher, marsh wren, song sparrow, and American robin. Marsh wren and song sparrow were also the most common bird species detected at the site, something that would be expected of an early successional wetland habitat. The bird species present during spring/summer are likely using the site for breeding, while birds that are using the site during spring or fall are most likely migrating through. Resident bird species that were detected only during the winter are likely only using the site as winter habitat and nesting somewhere else further north. During the breeding period the species exhibiting nesting behavior (territorial singing, nest building activity, actively feeding young) most frequently were willow flycatcher and cedar waxwing, followed closely by common yellowthroat, song sparrow, and marsh wren (Table 4). Table 4. Bird Nest Locations Relative to Restoration As-Built Nest Number Species Breeding Behavior As-Built Planting Code* 1 Willow Flycatcher Territorial Singing Wet Forest 2011 (NE corner of site) 2 Cedar Waxwing Nest Forest 2010 3 Marsh Wren Territorial Singing Existing emergent wetland (NW corner of site) 4 Willow Flycatcher Territorial Singing Forest 2010 5 Unknown Nest Forest 2010 6 Common Yellowthroat Carrying Food Wet Forest 2011 (NE corner of site) 7 Cedar Waxwing Nest Wet Forest 2011 (NE corner of site) 8 Willow Flycatcher Territorial Singing Wet Forest 2011 (NE corner of site) *As shown in the figure located in Appendix B.
- 17. 17 ICF Conclusions The Ohop Creek restoration area is within the Upper Nisqually River Biodiversity Management Area (BMA) as identified in the Pierce County Biodiverstiy Network Assessment (Brooks et al. 2004). Many species were predicted to occur in that BMA and several of them were detected during the 2014-2015 surveys. Northwest Trek collected data over a longer period of time and with more observers, yielding a larger species list than the 2014-2015 surveys (Appendix C). The Northwest Trek surveys give a sense of the diversity of species that use the site, while the 2014-2015 surveys yield a better understanding of the way particular species are using the site (e.g., nesting, foraging) and the relative intensity of species use. Notably the Biodivsersity Network Assessment highlighted the importance of the area for elk due to the various stages of managed forest throughout the Upper Nisqually River BMA. The data collected as part of this report certainly supports that notion. It is difficult to draw any strong conclusions about animal use relative to the restoration project with just one year of data. However, it is evident that elk, deer, and beaver are readily using the site under the restored condition. No data was collected prior to the restoration to determine if use patterns have changed, but we strongly suspect that use patterns are the same for deer and elk. It is also likely that the patterns of use on the site is more related to adjacent land uses than the restoration site itself. With heavy elk use detected on Cameras 3, 4, and 5, but not the others it is evident that the animals are coming onto the site in those locations. Elk likely spend the day in wooded areas in the hills just southeast of the project site and then move down onto the site at night to forage. This daily use pattern was detected on the cameras but also can be seen in the well worn path the elk have created between Cameras 4 and 5 across Highway 7. Looking at the regional picture it is evident that south of the Ohop Creek restoration site to the Nisqually River and east to Highway 7 there is large expanse of mostly contiguous forest. The forest is in various stages of management, but still provide very good year-round habitat for elk. That trend extends even further south of Nisqually River, west of Alder Lake, all the way to the Lewis County line. That patch of forested habitat is likely the reason more animals are moving onto the Ohop Creek restoration site from the south than from the north. North of the site there is forested habitat but it is much more fragmented by roads and small sporadic housing developments. This creates much more of a patchwork of variable habitat quality and likely does not support the number of elk as the forested habitat to south does. Elk were never observed in the agricultural fields just north of the Ohop Creek restoration site but, depending on the crops present, it is typical for elk to use agricultural fields for foraging. It is reasonable to assume that as woody vegetation matures on the restoration site both elk and deer will gain deeper penetration into the site since there will be more cover. The bird community at the site is typical of a riparian zone in this part of Washington. Seasonal diversity changes due to the migratory nature of many birds. More species are seen in the spring and summer than in the fall and winter. It is expected that species diversity will change over time, as vegetation on the site matures. The number of species may stay relatively the same but the species may change. Once woody vegetation matures to the point that it begins to influence shrub and forb communities due to shading more tree-nesting species may be present and there may be fewer shrub nesting species. This is a typical result of succession in any natural community.
- 18. 18 ICF Recommendations At this time there are no recommendations on regarding a change in restoration activities or management of the restoration site post-installation. The site is supporting avian species typical of an early successional riparian zone, as suspected. Deer and elk are utilizing the site thoroughly and will continue to do so as the site develops. The beaver activity noted on the project site is a positive sign. In addition to the engineered woody debris installed as part of the restoration project, beaver will add necessary woody debris to the stream channel over time. We recommend continuing to monitor beaver activity to make sure that enough additional plantings can be installed to account for losses incurred by them. Due to the frequency of elk movement across Highway 7 on the southeastern part of the project site we recommend that the county place signs on the roadway alerting drivers that it is an area of high elk activity, especially at night. The highway is heavily used, including use by many trucks, and vehicle-elk interaction seems inevitable. Alerting drivers to the presence of elk will reduce the risk of collision. If future surveys were conducted on a semi-regular basis it would provide some information on how wildlife use patterns change as the restoration site matures. The easiest way to detect that would be to conduct bird surveys on a regular interval every 3-5 years. The species of birds that use the site will change more dramatically than the species of mammal, making bird use data more useful at describing the changing ecological function of the site over time. Mammal surveys will also continue to be useful especially now that some baseline information has been collected. Camera trapping is the most efficient way to collect that data consistently across the site. Since there has been some camera theft and tampering during 2015, we recommend that future camera studies occur over short durations. Cameras can be installed for a period of a few months and then removed. Camera locations can be varied so that would be thieves do not detect a pattern. This does reduce the effectiveness and power of the sampling, but that can be overcome with a larger sample size over multiple years. Finally we recommend that baseline information be collected at other sites in the Ohop Valley that will likely be restored in the future. Baseline data collection can inform how a site is restored and it can also be very useful for comparison with any data collected following restoration. As above, we recommend bird surveys and camera trapping as the most effective way to conduct that baseline survey work. One of the recommendations in the Pierce County Biodiversity Network Assessment was to include more NatureMapping style of survey work in all of the BMAs, but particularly in the Upper Nisqually River BMA. The data that has been collected by Northwest Trek since 2009 is implementing that recommendation and more intensive studies like this one will continue to fill data gaps about animal use in the region as restoration efforts continue to come to fruition.
- 19. 19 ICF Literature Cited Brooks, K., K.M. Dvornich, M. Tirhi, E. Neatherlin, M. McCalmon, and J. Jacobson. 2004. Pierce County Biodiversity Network Assessment: August, 2004. Report to Pierce County Council, Pierce County, 146 pp. Gardali, T., A.L. Holmes, S.L. Small, N. Nur, G.R.Geupel, and G.H. Golet. 2006. Abundance patterns of songbirds in restored and remnant riparian forests on the Sacramento River, California, USA. Restoration Ecology14:391-403. Ralph, C.J., G.R. Geupel, P. Pyle, T.E. Martin, and D.F. DeSante. 1993. Field methods for monitoring landbirds. USDA Forest Service Publication, PSW-GTR 144, Albany, CA. Ralph, C.J., S. Droege, and J.R. Sauer. 1995. Managing and monitoring birds using point counts: standards and applications. In C. J. Ralph, J. R. Sauer and S. Droege (Eds.), Monitoring Bird Populations by Point Counts. USDA Forest Service Publication, Gen. Tech. Rep. PSW-GTR- 149, Albany, CA . Sauer, J. R., J. E. Hines, J. E. Fallon, K. L. Pardieck, D. J. Ziolkowski, Jr., and W. A. Link. 2014. The North American Breeding Bird Survey, Results and Analysis 1966 - 2012. Version 02.19.2014 USGS Patuxent Wildlife Research Center, Laurel, MD
- 21. Path:K:Projects_1Niqually_TribeOhop_Wildlife_Surveys_00480_14mapdocFiguresFig01_Transect_Detection_Freq.mxd;User:30481;Date:1/12/2016 Figure 1. Wildlife Detection by Transect Nisqually Indian Tribe Natural Resources Department 0 0.5 1 Miles Transect Restoration Phase I/II Boundary Camera Stations !. Current !. Former ´
- 23. Path:K:Projects_1Niqually_TribeOhop_Wildlife_Surveys_00480_14mapdocFiguresFig02_Beaver_Activity.mxd;User:30481;Date:1/12/2016 Figure 2. Beaver Activity Nisqually Indian Tribe Natural Resources Department 0 0.5 1 Miles Restoration Phase I/II Boundary Beaver Activity Prior to 2015 Beaver Activity in 2015 ^_Beaver Visual in 2015 ´
- 25. Path:K:Projects_1Niqually_TribeOhop_Wildlife_Surveys_00480_14mapdocFiguresFig03_Bird_Nests.mxd;User:30481;Date:1/11/2016 Figure 3. Bird Nests and Activity Nisqually Indian Tribe Natural Resources Department 0 0.5 1 Miles Restoration Phase I/II Boundary Nest ^_ American Goldfinch ^_ Cedar Waxwing ^_ Cliff Swallow ^_ Marsh Wren ^_ Red-winged Blackbird ^_ Unknown Nesting Behavior !. American Goldfinch !. Cedar Waxwing !. Common Yellowthroat !. Mallard !. Marsh Wren !. Song Sparrow !. Willow Flycatcher !. Wood Duck !. Yellow Warbler ´
- 27. 19 ICF Appendix A Selected Photos From Wildlife Cameras
- 29. OHOP CREEK RESTORATION PHASE I & II SITE PHOTOS 1 Photograph: 1 Camera Number: 6 Photo Date: July 7, 2014 Comment: Photo depicts four elk, one male and three females Photograph: 2 Camera Number: 5 Photo Date: July 10, 2014* Comment: Photo depicts female elk *Date was set incorrectly on camera Photograph: 3 Camera Number: 6 Photo Date: July 12, 2014* Comment: Photo depicts female deer *Date was set incorrectly on camera Photograph: 4 Camera Number: 4 Photo Date: November 5, 2014* Comment: Photo depicts coyote of unknown gender *Date was set incorrectly on camera
- 30. OHOP CREEK RESTORATION PHASE I & II SITE PHOTOS 2 Photograph: 5 Camera Number: 4 Photo Date: July 21, 2014* Comment: Photo depicts female elk *Date was set incorrectly on camera Photograph: 6 Camera Number: 3 Photo Date: September 2, 2014 Comment: Photo depicts male elk Photograph: 7 Camera Number: 4 Photo Date: September 25, 2014 Comment: Photo depicts male northern flicker Photograph: 8 Camera Number: 2 Photo Date: October 5, 2014 Comment: Photo depicts three elk
- 31. OHOP CREEK RESTORATION PHASE I & II SITE PHOTOS 3 Photograph: 9 Camera Number: 2 Photo Date: November 6, 2014 Comment: Photo depicts male elk Photograph: 10 Camera Number: 2 Photo Date: November 30, 2014 Comment: Photo depicts coyote Photograph: 11 Camera Number: 5 Photo Date: December 1, 2014 Comment: Photo depicts male elk Photograph: 12 Camera Number: 2 Photo Date: December 2, 2014 Comment: Photo depicts coyote of unknown gender
- 32. OHOP CREEK RESTORATION PHASE I & II SITE PHOTOS 4 Photograph: 13 Camera Number: 4 Photo Date: January 19, 2015 Comment: Photo depicts two male elk Photograph: 14 Camera Number: 5 Photo Date: January 26, 2015 Comment: Photo depicts male elk Photograph: 15 Camera Number: 7 Photo Date: February 5, 2015 Comment: Photo depicts coyote Photograph: 16 Camera Number: 8 Photo Date: May 5, 2015 Comment: Photo depicts female deer
- 33. OHOP CREEK RESTORATION PHASE I & II SITE PHOTOS 5 Photograph: 17 Camera Number: 3 Photo Date: May 6, 2015 Comment: Photo depicts three elk, one male and two females Photograph: 18 Camera Number: 8 Photo Date: May 14, 2015 Comment: Photo depicts female deer Photograph: 19 Camera Number: 2 Photo Date: September 8, 2015 Comment: Photo depicts male elk Photograph: 20 Camera Number: 5 Photo Date: October 5, 2015 Comment: Photo depicts male elk
- 34. OHOP CREEK RESTORATION PHASE I & II SITE PHOTOS 6 Photograph: 21 Camera Number: 3 Photo Date: October 12, 2015 Comment: Photo depicts coyote of unknown gender Photograph: 22 Camera Number: 1 Photo Date: October 23, 2015 Comment: Photo depicts unknown raptor Photograph: 23 Camera Number: 1 Photo Date: November 10, 2015 Comment: Photo depicts coyote Photograph: 24 Camera Number: 3 Photo Date: November 23, 2015 Comment: Photo depicts male northern flicker
- 35. 20 ICF Appendix B Ohop Phases I & II Planting Zones and Year of Installation
- 37. Legend Scrub Shrub 2010 Wet Forest 2010 Forest 2010 Channel Buffer 2010 Scrub Shrub 2011 Wet Forest 2011 Forest 2011 Ü0 250 500125 Feet Cartography by Cathy Sampselle (NIT) Imagery: NAIP 2011 Ohop Phase I & II Planting Zones and Year of Installation
- 39. 21 ICF Appendix C Birds Detected by Northwest Trek 2008-2012
- 41. Bird Species Detected Scientific Name Common Name *Columba livia Rock Pigeon *Molothrus ater Brown‐headed Cowbird *Sturnus vulgaris European Starling Accipiter gentilis Northern Goshawk Actitis macularius Spotted Sandpiper Agelaius phoeniceus Red‐winged Blackbird †Aimophila ruficeps Rufous‐crowned Sparrow Aix sponsa Wood Duck Anas americana American Wigeon Anas platyrhynchos Mallard Aphelocoma californica Western Scrub‐Jay Ardea herodias Great Blue Heron †Artemisiospiza belli Sage Sparrow Bombycilla cedrorum Cedar Waxwing Branta canadensis Canada Goose Bubo virginianus Great Horned Owl Buteo jamaicensis Red‐tailed Hawk †Buteo swainsoni Swainson's Hawk Calypte anna Anna's Hummingbird Cardellina pusilla Wilson's Warbler Carduelis tristis American Goldfinch Cathartes aura Turkey Vulture †Catharus fuscescens Veery Catharus ustulatus Swainson's Thrush Certhia americana Brown Creeper Ceryle alcyon Belted Kingfisher Chaetura vauxi Vaux's Swift Charadrius vociferus Killdeer Cistothorus palustris Marsh Wren Colaptes auratus Northern Flicker Contopus sordidulus Western Wood‐Pewee Corvus brachyrhynchos American Crow Corvus corax Common Raven Cyanocitta cristata Blue Jay Cyanocitta stelleri Steller's Jay
- 42. Scientific Name Common Name Dryocopus pileatus Pileated Woodpecker Empidonax difficilis Pacific‐slope Flycatcher Empidonax traillii Willow Flycatcher Falco sparverius American Kestrel Gallinago delicata Wilson’s Snipe †Gavia stellata Red‐throated Loon Geothlypis trichas Common Yellowthroat Haemorhous mexicanus House Finch Haemorhous purpureus Purple Finch Haliaeetus leucocephalus Bald Eagle Hirundo rustica Barn Swallow Ixoreus naevius Varied Thrush Junco hyemalis Dark‐eyed Junco Melospiza georgiana Swamp Sparrow Melospiza melodia Song Sparrow Mergus merganser Common Merganser Oreothypis celata Orange‐crowned Warbler Passerculus sandwichensis Savannah Sparrow Passerella iliaca Fox Sparrow Passerina amoena Lazuli Bunting Petrochelidon pyrrhonota Cliff Swallow Phasianus colchicus Ring‐necked Pheasant Pica hudsonia Black‐billed Magpie Picoides pubescens Downy Woodpecker Picoides villosus Hairy Woodpecker Poecile atricapillus Black‐capped Chickadee Poecile gambeli Mountain Chickadee Pooecetes gramineus Vesper Sparrow Porzana carolina Sora Psaltriparus minimus Bushtit Rallus limicola Virginia Rail Regulus calendula Ruby‐crowned Kinglet Regulus satrapa Golden‐crowned Kinglet Riparia riparia Bank Swallow Selasphorus rufus Rufous Hummingbird Setophaga petechia Yellow Warbler
- 43. Scientific Name Common Name Sitta canadensis Red‐breasted Nuthatch Sphyrapicus ruber Red‐breasted Sapsucker †Spizella arborea American Tree Sparrow Spizella passerina Chipping Sparrow Stelgidopteryx serripennis Northern Rough‐winged Swallow Strix varia Barred Owl Tachycineta bicolor Tree Swallow Tachycineta thalassina Violet‐green Swallow Thryomanes bewickii Bewick's Wren Troglodytes aedon House Wren Troglodytes troglodytes Winter Wren Turdus migratorius American Robin Tyto alba Barn Owl Vireo gilvus Warbling Vireo Zenaida macroura Mourning Dove Zonotrichia atricapilla Golden‐crowned Sparrow Zonotrichia leucophrys White‐crowned Sparrow Legend *= Non-native species †= Possible migratory species but are outside of their typical range