1. Mapping & Natural Disaster Response
Geospatial Tools Assist in Flood Damage Assessment & Recovery
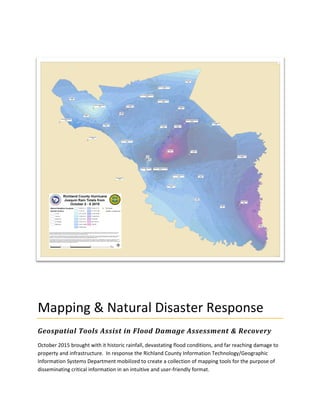
October 2015 brought with it historic rainfall, devastating flood conditions, and far reaching damage to
property and infrastructure. In response the Richland County Information Technology/Geographic
Information Systems Department mobilized to create a collection of mapping tools for the purpose of
disseminating critical information in an intuitive and user-friendly format.
2. P a g e | 1
BENEFIT/IMPORTANCE OF THIS PROJECT
1. Why was this project undertaken?
Accurate and timely information is critical in emergency response and disaster recovery.
This project, a collection of open source mapping applications and associated processes, was
undertaken to support the citizens of Richland County and the Emergency Operations Center staff in the
immediate aftermath of the historic flooding event of October 2015.
In the days and hours following this natural disaster there was a clear need for information that was
both current and easily accessible by both the public and emergency responders. Specifically, both of
these groups needed a centralized location where they could quickly access the most current
information related to flood extent and infrastructure damage.
As emergency conditions subsided, the extended recovery from flood damage began. With this phase
also came the need for current and accurate information related to flooding extent, road closures, dam
failure, property and infrastructure damage, and debris removal.
2. What is the significance of this project to your community as a whole? How does it
relate in importance to the other problems in your community?
The primary significance of the Flood Response Mapping Applications project was two-fold: critical
information was collected and critical information was published in a clear, user-friendly format.
Critical information collected
The Richland County Information Technology/Geographic Information Systems Department (IT/GIS, also
known as RC Geo) became the hub for mission critical flood-related information. Citizens and County
staff now had a point of contact to both view and convey current post flood conditions.
An email account was established specifically for the purpose of sending IT/GIS updates regarding road
and bridge closures and openings. This email address was provided to staff and citizens. Dam status was
read, via a web service, directly from DHEC. As their information was updated, the changes appeared on
IT/GIS mapping resources when they were refreshed. The Solid Waste Department Director provided
the location of debris piles in need of collection.
IT/GIS quickly established a hub system of procedures to absorb information from many sources, refine
these into usable data, conduct quality assurance, and publish results to responder and citizens. The key
to this project was programmatically culling information from authoritative and social media sources,
evaluating accuracy, and pushing data to users via direct and indirect technologies…in an efficient and
effective manner.
3. P a g e | 2
Critical information published in a clear, user-friendly format
While all of the public facing mapping applications displayed useful layers related to the flooding event,
each had a distinct focus. This provided viewers with maps tailored to a variety of needs.
The Road and Dam Status Viewer focused on road/bridge closures as well as the stability of dams within
Richland County. Road and bridge information was sourced from a variety of places including social
media, County staff (primarily Emergency Services staff), and the public.
The Flood Data Viewer also included road, bridge, and dam status information, but its focus was to
serve as a damage assessment tool for County departments to record and analyze flooding impact. In
addition to the aforementioned layers, this application also included elevation contours, imagery from
the County's Google contract, parcel and municipal boundary lines, and post flood imagery flown by
Woolpert in the heart of the area most impacted by flooding.
The Flood Inundation Tool was created by Woolpert, Inc. It displayed before/after flood imagery with a
slider that enabled direct comparison between pre and post flood water levels. The former came from
IT/GIS with assistance from Google; the latter was flown by Woolpert, Inc. on October 6, 2015. Road
closure data was incorporated from the IT/GIS cloud infrastructure. Coverage for this post flood imagery
included areas of Columbia and Forest Acres, the epicenter of flood damage.
A Debris Map was created in collaboration with Rudy Curtis, Richland County’s Solid Waste Department
Director. Mr. Curtis supplied IT/GIS with the addresses of post flood debris piles in need of pickup. These
locations were geocoded and added to a map created using Google Maps Engine. Mr. Curtis’ haulers
were then able to view debris pickup locations from mobile devices in the field.
Additional Web map applications were also created on an ad-hoc basis as requested by law
enforcement, fire department personnel, and the SC National Guard.
3. How much of the county’s population is benefited by the project? In what specific
ways are different groups of citizens within the county better off than before?
Mapping applications included in this project were created on mobile-friendly platforms and
immediately published on the front page of the IT/GIS website (www.richlandmaps.com) along with
brief descriptions to tell viewers the aim of each application and some of its key features.
Each of these applications was created using a combination of Open Source software to share
information stored in various cloud infrastructures outside of Richland County. In this way, a multitude
of flood-related information was provided, with extremely minimal costs, in a single location.
Specific benefits to the public and to County staff in the field included the ability to navigate around
known road and bridge closures, with an awareness of nearby dams and their current stability statuses.
This was helpful not only in the case of individual travel but also in the delivery of needed resources. E.g.
a truck delivering water or food items to the emergency shelters could view the status of infrastructure
between its current location and the destination in an intuitive and responsive map display.
4. P a g e | 3
The IT/GIS staff was called into the Emergency Operations Center on the day that the mapping
applications were published in order to brief one of the Fire Marshals on their location and use. These
were used to assist him and his staff in allocating their resources. With easily accessible, relevant
information available from one location, this department was able to make the most informed decisions
possible regarding their navigation throughout the County.
Beyond use by response personnel, the applications and the processes used to update information
established a two-way channel of communication between staff and citizens. Citizens conveyed
information via direct e-mail, phone calls, various social media applications, and as ‘citizen sensors’
using mobile technologies.
As the flooding receded, County staff began the process of damage assessment throughout the County.
The Flood Data Viewer provided a variety of pertinent data layers including post flood imagery,
elevation contours, property boundaries, and infrastructure statuses.
4. What degree of success did the project attain? What major objectives were
achieved?
Success in this project was evidenced in the efficiency and effectiveness of the process and applications
produced by Richland County IT/GIS. The extended reach of these efforts also provides evidence of its
success. Empirical and quantitative measures indicated significant use by staff and citizens alike.
Web metrics documenting desktop and mobile use were
significant for all applications. The use for just the Google Maps
Engine apps quadrupled during the flood event.
More importantly, the process, applications, and data were
necessary for use in the County 911 system during the event
and recovery.
In creating the data merging process and publishing
applications, the IT/GIS team transitioned from placing a single
staffer in the Emergency Operations Center (EOC) to establishing an independent location better able to
fully leverage the IT/GIS staff’s mapping and development skill set. By working from the IT/GIS Division
offices, in very close communication with EOC staff, IT/GIS was able to focus on the development and
support of geospatial tools to support flood response/emergency operations. This satellite location
approach was unofficially termed the Geo EOC.
The necessity of this project was observed as EOC staff directed rescue and recovery teams to the Geo
EOC for input as well as ad-hoc map applications.
The expeditious establishment of a data management process and creation of several web and mobile
applications met the following objectives:
5. P a g e | 4
• Create a centralized hub for the collection, verification, and dissemination of critical
information. Information included dam, bridge, and road status, flood water extent, property
damage, debris collection sites, and property appraisal.
• Exploit the functionality of social media and other technologies to coordinate the most
immediate information available.
• Collect and display the most accurate and current infrastructure status throughout the event.
Status updated many times each day and provided to staff and citizens.
• Using cloud technologies merge multiple authoritative data sources to provide a common
operating picture for authorities and citizens. Dam status was read from authoritative sources at
SC DHEC using web services. Cloud-based baseline imagery and data merged with flood imagery
for event management.
• Other major objectives achieved included keeping any and all community citizens, professionals,
first responders and volunteers updated with accurate mapping information in an easy to digest
format to accomplish their tasks during and after a natural disaster. This included items as
innocuous as having to commute to work with an unfamiliar route to locating and retrieving
people and animals in need of emergency care.
PROJECT EFFORT/DIFFICULTY
1. What did your county have to do to accomplish its objectives?
Initially, Richland County IT/GIS had to use their imagination to quickly assess team abilities and
technologies to contribute most effectively to the cause in a timely manner. Fortunately current
infrastructure and staff were uniquely structured for such an event. Priorities and work flows changed
over the course of the flood event but the diverse abilities of staff enabled quick change without
compromising results. Bypassing a traditional time consuming approach to massive printing of maps and
information was key in keeping responders and citizens updated using web and mobile applications
depicting frequently updated data.
Richland County IT/GIS had a few challenges related to this undertaking. First, the currency of
information was of paramount importance. Priority was given to taking all possible steps to ensure that
the road closure and dam status information displayed within the mapping applications was as current
as possible. Steps to achieve this included:
• Central point of contact for reporting road information – email address created and staff
member allocated as GIS contact.
• Monitoring social media channels for on-scene updated from authoritative sources and citizens.
• Obtaining and serving dam information from the source to eliminate delays in the display of the
most current information. With respect to dam status, we accomplished this task by reading
data from the authoritative source at SC DHEC using web services.
• Establish field-verification processes to include County staff from Public Works, Building
Inspections, Assessor’s Office, Fire Department, and Law Enforcement.
• Convert existing application code to meet the unique functions required during the event.
• Coordinate cloud-based data feeds to populate each application for multi-platform use.
6. P a g e | 5
2. What challenges occurred during the project? Were there any community
concerns?
One challenge that faced the IT/GIS team during this time was the combination of a tight timeline paired
with limited staff resources.
Speed was of paramount importance. Mapping resources had to be well designed, easy to use, readily
available across platforms, accessible to mobile devices, and they had to incorporate information from a
variety of sources. The need for this information, by County staff/emergency responders and the
Citizens within Richland County, was immediate.
IT/GIS is a small division made up of five full-time employees and a part-time GIS Intern. Two of these
staff members had limited availability as they rotated shifts at the Emergency Operations Center in the
immediate aftermath of the storm, transitioning to an on-call role in the days and weeks that followed.
The primary concern was delivering immediate results for the multitude of needs with a limited staff.
3. What were the nature and extent of the county government’s efforts to alleviate the
problem(s)? How difficult was it to accomplish the project’s goals and/or
objectives?
Aside from the Emergency Operations Center and other essential staff, Richland County offices were
closed during the first week of October 2015. During this time, IT/GIS employees came into the office to
work on this project.
IT/GIS staff includes two developers; both have experience utilizing Open Source technology in mapping
applications. They were absolutely critical to achieving the above goals as the IT/GIS team worked long
days to produce and publish the mapping resources.
With limited staff and neither the time nor the means to safely embark on field checks, Richland IT/GIS
was able to use a form of crowd sourcing to keep infrastructure status information current within the
map displays. Employees in other departments engaged in disaster relief throughout the County
provided IT/GIS with status information related to the roads and bridges that they encountered. Citizens
did the same. In this way, a synergistic relationship was formed and maintained: disaster recovery staff
and citizens were able to avoid known infrastructure damage, saving time and effort. They also had a
contact to which they could relay and update status information, saving time and energy on the part of
IT/GIS and improving the quality and accuracy of the applications themselves.
4. Was financing the project an obstacle? Were there any unusual factors inherent in
financing the project?
Part of the reason that this project was able to be completed so quickly in response to the flooding even
is that it involved minimal direct costs. Over the past several years, IT/GIS has migrated external web
and mobile mapping needs to an open source cloud architecture. Such infrastructure provides much
7. P a g e | 6
more flexibility, reliability, and significant cost savings as compared to the traditional systems. A
hallmark of open source cloud technologies is the ability to scale during events. The flood event proved
the promise of this point.
As for the technology used during the event, no additional costs were incurred. Upon request, Google
removed the server load limits on the Google Maps Engine platform and imagery served from Amazon
S3 cloud did not exceed any of the high-use limits.
Beyond using IT/GIS controlled-resources, a vendor supplied high-resolution flood event aerial imagery.
An unsolicited offer was extended by a Dayton, Ohio-based private engineering firm (Woolpert) to fly,
collect, process, and serve aerial imagery as soon as the clouds cleared. At no cost to the County,
Woolpert dispatched an aircraft from its Ohio headquarters, collected imagery and had it ready in the
cloud for use by our applications within a 24-hour period. They also worked with IT/GIS to produce a
before-and-after online application to depict flood damage for use by recovery teams, property
appraisers, insurance companies, and citizens.
IT/GIS staff worked primarily from the department office, sending staff to and from the Emergency
Operations Center to meet their immediate mapping needs, to stay updated on the status of emergency
response efforts, and to provide information to first responders about the online mapping applications
as they were developed and published. All staff time was accounted for and the IT/GIS team members
were given equivalent hours for use later in the year.
5. Did any agencies, citizen groups, or other organizations assist your county with this
project? Did their participation pose any particular challenges or offer any unique
contributions or benefits?
As a coordinating hub, IT/GIS staff worked directly with several outside groups to achieve its objectives.
From the private sector, the team worked with Woolpert to establish event imagery for use by all
interested parties. The only direct interaction with a state agency was with SC DHEC, through a personal
connection, to establish the web services for conveying dam status maintained by the authoritative
source. The team relied heavily on field personnel from other departments such as Building Inspections,
Public Works, Assessor’s staff, and others. The most critical interaction was with the Columbia-Richland
Fire Department personnel. Each report or status change for any infrastructure (dam, road, rail, bridge,
etc.) was field-checked by firemen prior to publication. Communication with National Guard teams was
also incorporated into updates and published to apps for their specific use. Citizens as sensors was the
most unique factor in updating all County infrastructure data.
The entire operation was unique in its development, execution, and management. However, the most
unusual aspect of the project was the incorporation of citizen sensor information. Whether geo-tagged
photos and information were submitted via email, twitter, or shared on Facebook, each submittal was
reviewed for use by the team. The monitoring of Google Traffic data was most enlightening for
identifying closed roads or bridges. The use of such technologies showed significant promise in a non-
traditional environment.
8. P a g e | 7
6. Are there any unresolved problems or other goals left to tackle?
No, there are no unresolved goals/problems related to this specific project. The immediate, emergency
status of flood recovery has past, but the effects of this historic event continue to reverberate
throughout the County. As such, the vital information contained in the post flood mapping applications
is still available through richlandmaps.com. Post flood event operations still rely on these tools and will
continue to do so for months to come.
Two of the four applications are still available online. The Road and Dam Status Viewer was taken offline
because the underlying technology, Google Maps Engine, was shut down in late January 2016. The
content displayed on this application is still available on the Flood Data Viewer at this time. The Debris
Map has also been taken offline; its objective was met as the Solid Waste Department completed their
post flood debris collection.
PROJECT ORIGINALITY/INNOVATION
1. Justify the uniqueness of this project. What makes it different from other projects
designed to achieve the same objective?
The uniqueness of this project is evident in both process and technological application. The rapid
creation of procedures for gathering, coordinating, validating, and publishing needed critical information
in an efficient and effective context was instrumental in managing the flood event. Using open source,
cloud, social media, citizen sensor and other technologies are not common in local government GIS
operations. In fact, the combination of all of these has rarely been attempted.
Reflecting on the quickly developed applications, the Flood15 application provides a "one-stop" site for
flood-related information, presenting the most up-to-date data in a clean and concise format. It is a truly
cross-organizational resource for road closure and dam status reporting. The applications incorporate
many County resources via cloud-storage as well as multiple third-party data sources in an open-source
environment. Storing county GIS datasets with a large cloud vendor helped mitigate heavy internet
traffic (ingress/egress) concerns from the application's usage, keeping any unnecessary burden off
already strained Richland County staff and server resources. Adapting data provided by participating
organizations allowed the centralization of information needed for emergency response, situational
awareness, and resident assistance.
2. Do you know of any other similar programs in South Carolina? If so, how is your
program different?
Richland County GIS was an early adopter of open-source technologies – this provides some distinction
and remains unique among local governments. Open-source development offers an enormous cost-
savings to tax-payers, avoiding the need for annual budgeting for proprietary software maintenance and
licensing. Being flexible and customizable, open-source development allows Richland County GIS to
provide public-facing applications with clean, intuitive user interfaces, specifically tooled for certain use
cases (i.e. property research, comparative sales analysis, delinquent tax property lookup, etc.).
9. P a g e | 8
3. What innovations were required in accomplishing your objectives?
In the flood event of 2015, necessity demanded innovation. Culling data from many sources is not
uncommon. However, using authoritative sources as well as citizen sensors and volunteered geographic
information via common mobile phone apps is unique.
While the web and mobile applications were effective and well-received, the innovation most worthy of
merit is that of our organizational behavior – namely, the broad-mindedness to first entertain using
open-source, followed by the courage and commitment to break from the traditional methods, develop,
and ultimately publish applications using open-source resources.
There is inherent risk in change, especially in scenarios where time is precious and results are essential,
and managing this risk requires the organization to be knowledgeable and cohesive. Adoption of open-
source technology by a local government remains rare, and as such, IT/GIS believes the success of the
web and mobile applications may bolster confidence in open-source solutions for our industry going
forward.
4. Who provided the creativity and imagination in your project?
Given his experience assisting with search and rescue operations, Richland County Geographic
Information Officer, Dr. Patrick Bresnahan, identified an immediate need for an interactive, internet-
based mapping resource to provide current, relevant data to first responders, emergency workers,
volunteers, and Richland County residents. Continuous road-closure updates and mobile device
readiness were key to his vision. In addition to providing the concept for the application, Dr. Bresnahan
selected datasets for publication and coordinated with both SCDHEC and Woolpert to facilitate
publishing their data through the application. However, creativity was the standard for IT/GIS during this
event. Each team member had to contribute elements beyond their previous experience. From
streamlining code to make adding data more efficient, to publishing and consuming web services from
numerous sources, to creating an ad-hoc quality assurance procedure for dynamic data, the entire team
had to think on their feet. All of this was done under immense pressure and without a cookbook to
deliver for disaster response and recovery.
Summary
Through innovation and collaboration, the Richland County IT/GIS team was able to quickly collect and
publish critical flood-related information pertinent to damage assessment, emergency response, and
flood recovery efforts. This was made possible by several factors: cooperation between County
Departments and external sources, the utilization of open source technologies, and a responsive
approach to the needs of both staff and citizens throughout flood recovery.
10. P a g e | 9
MAPPING APPLICATION OVERVIEW
Road and Dam Status Viewer
Focus Road/bridge closures and dam
stability
Primary Info. o Road closure status
o Bridge closure status
o Dam stability status
Flood Data Viewer
Focus Flood impact and damage assessment
Primary Info. o Road closure status
o Bridge closure status
o Dam stability status
o Woolpert post flood imagery from
epicenter of impact
o Pre flood imagery from the
County’s Google contract
o Elevation contours
o Parcel and municipal boundary
lines
Flood Inundation Tool
Focus Pre and post flood comparison
Primary Info. o Woolpert post flood imagery from
epicenter of impact
o Pre flood imagery from the
County’s Google contract
o Bridge closure status
o Road closure status
Debris Map
Focus Flood debris removal
Primary Info. Debris pile locations