SlideShare une entreprise Scribd logo
1  sur  12
Télécharger pour lire hors ligne
Ž .Advances in Environmental Research 4 2000 233᎐244
Advanced oxidation of phenolic compounds
R. Alnaizy, A. AkgermanU
Department of Chemical Engineering, Texas A&M Uni¨ersity, College Station, TX 77843, USA
Accepted 18 May 2000
Abstract
Ž .Phenol degradation with a UVrH O advanced oxidation process AOP was studied in a completely mixed, batch2 2
photolytic reactor. The UV irradiation source was a low-pressure mercury vapor lamp that was axially centered and
was immersed in the phenol solution. The effects of hydrogen peroxide dosage, initial phenol concentration,
H O rphenol molar ratio, pH, and temperature have been investigated. The experimental results indicate that there2 2
is an optimum H O rphenol molar ratio in the range of 100᎐250. A sufficient amount of hydrogen peroxide was2 2
necessary, but a very high H O concentration inhibited the photoxidation rate. The second-order reaction rate2 2
constants were inversely affected by the initial phenol concentration. No pH effect was observed in the pH range of
4᎐10. A detailed reaction mechanism was proposed. The reaction products include hydroquinones, benzoquinones,
and aliphatic carboxylic acids with up to six carbon atoms. A kinetic model, which employs the pseudo-steady state
assumption to estimate hydroxyl radical concentration and assumes constant pH was developed to predict phenol
oxidation kinetics and product distribution. ᮊ 2000 Elsevier Science Ltd. All rights reserved.
Keywords: Ultraviolet radiation; Phenol; Photolysis; Hydrogen peroxide; Photoxidation
1. Introduction
Chemical oxidation processes are widely used to
treat drinking water, wastewater, and groundwater con-
taminated with organic compounds. Direct oxidation of
aqueous solutions containing organic contaminants can
be performed under a variety of conditions ranging
from ambient conditions to supercritical water oxida-
tion at very high temperatures and pressures. Oxida-
tion at mild conditions by reactive species, such as
hydroxyl radicals generated by UV radiation in the
U
Corresponding author. Tel.: q1-978-845-3375; fax: q1-
978-845-6446.
Ž .E-mail address: a-akgerman@tamu.edu A. Akgerman .
presence of an oxidant, such as ozone or hydrogen
peroxide, is referred to as an advanced oxidation
Ž .process AOP . AOPs are attractive alternative tech-
nologies for destroying toxic organic contaminants.
AOPs are studied in different combinations; ozone
with ultraviolet radiation; ozone with hydrogen perox-
ide; ozonerhydrogen peroxide with ultraviolet radia-
tion; hydrogen peroxide with ultraviolet radiation; and
ozone at high pH. Ultraviolet photolysis combined with
Ž .hydrogen peroxide UVrH O is one of the most2 2
appropriate AOP technologies for removing toxic or-
ganics from water because it may occur in nature itself.
This process involves the production of reactive hy-
Ž ..droxyl radicals OH that are ultimately capable of
mineralizing organic contaminants. This oxidation may
Ž .occur via one of three general pathways: 1 hydrogen
1093-0191r00r$ - see front matter ᮊ 2000 Elsevier Science Ltd. All rights reserved.
Ž .PII: S 1 0 9 3 - 0 1 9 1 0 0 0 0 0 2 4 - 1
( )R. Alnaizy, A. Akgerman rAd¨ances in En¨ironmental Research 4 2000 233᎐244234
Ž . Ž .abstraction; 2 electron transfer; and 3 radical addi-
Ž .tion Masten and Davies, 1994 .
Phenols are one of the most abundant pollutants in
industrial wastewater, i.e. chemical, petrochemical,
paint, textile, pesticide plants, etc. They serve as inter-
mediates in the industrial synthesis of products as
diverse as adhesives and antiseptics. Chlorinated
phenols, which form during chlorination of water, are
Žreported to resist biodegradation La Grega et al.,
.1994 .
The objective of this study was to investigate the
feasibility of treating phenol contaminated water by the
UVrH O process. We performed direct ultraviolet2 2
photolysis, hydrogen peroxide oxidation, and ultraviolet
photolysis combined with hydrogen peroxide oxidation
of model phenol solutions. We performed experiments
at various initial phenol and H O concentrations to2 2
investigate the effects of their initial concentration on
the oxidation rates. From the observed phenol, inter-
mediates, and final product concentration time profiles,
we calculated the rate of each reaction in the proposed
mechanism. Finally, we proposed a kinetic model and
determined the reaction rate parameters for phenol
decomposition.
2. Methodology
2.1. Reactor configuration
We performed batch experiments in a 6.5-cm diame-
ter cylindrical Pyrex glass jacketed reactor with a total
volume of 310 ml. Fig. 1 is a schematic representation
of the apparatus used in this study. At the top, the
reactor had inlets for feeding reactants, and ports for
measuring temperature and withdrawing samples. The
reactor was open to air with a magnetic stirrer placed
in the bottom to provide proper mixing. The irradiation
in the photoreactor was obtained by a low-pressure
Ž .mercury lamp PCQ lamp, UVP, Inc. positioned and
immersed in the solution in the center of the reactor.
The lighted length of the lamp was 63.5 mm with a
quartz sleeve diameter of 9.5 mm. A 24᎐40 ground-glass
taper joint supported the lamp. It emits approximately
90% of its radiation at 254 nm with a 15-W power
input. Typical intensity of the lamp at 4.84 cm2
was
5400 ␮W cmy2
and its body temperature was approxi-
Ž .mately 60ЊC Table 1 . Because the light source pro-
duces heat, in order to conduct experiments at room or
controlled temperatures, the reactor was surrounded
with a cooling jacket to maintain a constant tempera-
ture. Temperature readings were taken using an Omega
digital thermometer with an extended probe that was
always immersed in the solution.
Table 1
Reactor and light source specifications
Reactor specifications
Volume 310 ml
Diameter 65 mm
Material Pyrex glass
Reflection factor 1
Light source
Lighted length 63.5 mm
Quartz diameter 9.5 mm
Ž .Radiation )90% 254 nm
Power 15 W
Body temperature 60 ЊC
2 2
Intensity at 4.84 cm 5400 ␮Wrcm
y6
UV radiation addition rate 1.516=10 Erlиs
2.2. Materials
Phenol, its expected degradation intermediates, and
final products were purchased from Sigma Chemicals
unless otherwise stated. The phenol stock solution was
prepared by adding an appropriate amount of a
reagent-grade 90-wt.% solution to deionized-distilled
water to obtain a solution of desired concentration.
Hydrogen peroxide stock solution was a reagent-grade
35-wt.% solution used as received. Intermediate ring
Ž .compounds such as 1,2-benzenediol catechol , 1,3-ben-
Ž . Ž .zenediol resorcinol , 1,4-benzenediol hydroquinone ,
Fig. 1. Schematic drawing of the apparatus used in this study.
1, reactor; 2, Hg lamp; 3, cooling jacket; 4, temperature
measuring inlet; 5, sampling point; 6, magnetic stirrer.
( )R. Alnaizy, A. Akgerman rAd¨ances in En¨ironmental Research 4 2000 233᎐244 235
and p-benzoquinone were G98% pure commercial
compounds used as received. O-Benzoquinone was un-
available commercially due to its instability. The acids
ᎏ muconic, maleic, fumaric, malonic, succinic, oxalic,
acetic, and formic ᎏ were )98% pure commercial
compounds used as received. The selected intermediate
and final organic-acid solutions were prepared by
weighing the proper amount to give the desired con-
centration in deionized distilled water. We kept these
Ž .aqueous solutions refrigerated f5ЊC and none of the
substances, except p-benzoquinone, was hydrolyzed
Žsignificantly. Solvents i.e. methanol and phosphoric
.acid were HPLC grade. The pH of aqueous solutions
was adjusted using either sodium hydroxide or hydro-
chloric acid where needed. Distilled and deionized
water, which was further purified with a Barnstead
Ultrapure mixed-bed cartridge, was used in cleaning
and experimentation. Compressed helium and nitrogen
gas with better than 99.9% purity was obtained from
Bob Smith Gas Products Company, Bryan, Texas, USA.
2.3. Experimental procedures
For a standard reaction run, 250 ml of aqueous
solution was used. It was prepared by adding a prede-
termined amount of hydrogen peroxide, as a concen-
Ž .trated solution 35 wt.% , to the contaminated water.
The initial phenol concentration was in the range of
Ž y4 y3
.40᎐500 ppm 4.3=10 ᎐5.3=10 M . High concen-
trations were good for easy detection, but they can
absorb too much of the UV radiation. The molar ratio
of H O to phenol was varied in the range of 0᎐500,2 2
which resulted in H O concentrations up to 0.5 M.2 2
The solution was stirred by a magnetic stirrer at ap-
proximately 300 rev. miny1
for 15 min to ensure suffi-
cient mixing. It was verified experimentally that hydro-
gen peroxide does not self-decay during this period.
Turning on the ultraviolet light while continuing mixing
under ambient temperature and pressure started the
reaction, then, a stopwatch was immediately started.
Ž .The reaction was carried out at neutral pH i.e. 6᎐7
except for a few runs to test for pH effects on the
reaction rates. Periodically, samples were withdrawn
Ž .2.5 ml through the sampling ports using a long hy-
podermic stainless steel needle then stored immedi-
ately in 20-ml screw-cap glass vials for analyses. Before
sampling, pH measurement was taken using a Cole
Parmer microcomputer, pH-vision model 05669-20
pH-meter, and electrode.
2.4. Analytical procedures
Ž .Total organic carbon TOC analyses were per-
formed using an OI Analytical Corporation Model 700
TOC analyzer. Reaction intermediates were identified
by a Dionex high-pressure liquid chromatograph
Ž . Ž .HPLC using two different columns Supelco . The
first column was a general classical reversed-phase,
LC-8; 25 cm by 4.6-mm i.d. filled with 5-␮m o.d. parti-
Ž .cles on a bonded support silica and had a pore size of
˚120 A. The UV detector was set at 280 nm. The best
separation was achieved with a programmed solvent
gradient as a mobile phase where the eluent was made
less polar as time progressed. It started with a
methanolrwater ratio of 1:99, with a flow rate of 1.0 ml
miny1
, then to 100% methanol in 20 min, then to the
initial ratio in 5 min. The second column was a SU-
PELCOGEL-H column for organic acids analysis. The
column was 25 cm=4.6 mm i.d., packed with sulfo-
nated polystyrene divinylbenzene spherical particles of
9-␮m diameter. The UV detector was set at 210 nm.
Separation was based on the ion exclusion method, in
which the analytes were selectively partitioned between
the resin phase and the external aqueous phase. Analy-
ses were performed at low pH with a simple isocratic
mode, where the mobile phase composition was main-
Ž .tained constant, 1% phosphoric acid H PO with a3 4
flow rate of 0.4 ml miny1
. All columns were operated
at room temperature and the injection volume was 100
␮l.
2.5. Reaction kinetics
In developing the reaction kinetics we assumed:
1. no reaction between phenol and its byproducts to
Žform higher molecular weight intermediates which
.was verified by HPLC ;
2. radiation absorption by any substance other than
hydrogen peroxide was negligible; and their oxida-
tion rates by UV radiation alone was negligible,
Žhence oxidation by UV alone was negligible. At
254 nm the extinction coefficient and quantum
yield for phenol are 516 My1
иcmy1
and 0.05
y1
Žmolecule и photon , respectively Dulin et al.,
.1986 . We neglected direct photolysis of phenol
because of its low quantum yield to hydrogen per-
oxide and due to experimental verification indicat-
.ing negligible photooxidation ;
3. organic and inorganic solutes or impurities did not
Žaffect the hydrogen peroxide photolysis rate De
.Laat et al., 1994 .
Hydrogen peroxide was always present in excess
Ž .)40:1 , therefore, the hydrogen peroxide concentra-
tion was assumed constant. The direct photolysis rate
of hydrogen peroxide is represented by
Ž yAt . Ž .r s⌽ f I 1ye 1u¨ H O H O Њ2 2 2 2
( )R. Alnaizy, A. Akgerman rAd¨ances in En¨ironmental Research 4 2000 233᎐244236
where ⌽ is the hydrogen peroxide quantum yield,H O2 2
I is the UV radiation intensity, and f is theo H O2 2
fraction of radiation that is absorbed by H O which,2 2
based on our second assumption, equals unity. The
Ž .solution total absorbance A at the UV radiationt
Ž .source wavelength ␭ is given by
Ž .A (2.303 l ␧ C 2t H O H O2 2 2 2
where A is the absorbance, ␧ and C are theH O H O2 2 2 2
molar extinction coefficient and H O concentration,2 2
respectively, and l is the effective reactor light path
Ž .annular . Table 2 shows the reported rate constants
for the most widely accepted reaction scheme of hydro-
gen peroxide photolysis. The concentrations of both
Ž . . .radicals OH and OOH were obtained using the
pseudo-steady-state hypothesis, which yields
Ž yAt .2⌽ I 1yeH O 02 2.w x Ž .OH s 3ss n
.k C qk C q k CÝ2 H O 5 OOH i i2 2
is1
and
k C C2 OH H O2 2и. Ž .HO s 42 ss k C qk C4 OOH 5 OHи
where k are reaction rate constants where hydroxyli
radicals are consumed in phenol and reaction interme-
diates and C are phenol and reaction intermediatei
concentrations.
Ž .In Eq. 3 , the numerator represents the hydrogen
peroxide direct photolysis rate, that is the OHи produc-
tion rate, and the denominator represents the hydroxyl
radicals’ consumption rate by all the identified species.
The reaction rate between species i in the postulated
mechanism and hydroxyl radicals is represented by
dCi
Ž .s k C C y k C C 5Ý Ýj j OH i i OHи иdt
j i
where
ⅷ i,j: phenol, identified intermediates and final
products;
ⅷ k : reaction rate constant where substance i isj
formed; and
ⅷ k : reaction rate constant where substance i isi
consumed.
A kinetic model was developed that describes the
kinetics of oxidizing phenol-contaminated water by
combined ultraviolet radiation and hydrogen peroxide.
The steady-state concentration of the OH. radical and
parameter estimation of the above equations were ob-
tained using the software packages Excel and Simu-
solveTM
.
3. Results and discussion
3.1. pH effects
All phenol advanced oxidation experiments were
performed in distilled water solutions. The pH of the
solution decreased from 6.5"0.5 to an average of
3.2"0.2 due to formation of acidic intermediates.
Other runs were made at higher pH, but the oxidation
Ž .rates were independent of pH. De Laat et al. 1994
showed that the efficiencies of UVrH O processes2 2
were not affected by pH below 8, although a decrease
Ž .was observed for higher pH. Lipczynska-Kochany 1993
studied phenol oxidation by the UVrH O process and2 2
observed no significant effects in the pH range from 7.0
to 9.0. On the other hand, phenol degradation and
catechol formation decreased rapidly when pH-7 and
pH)9. This observed decrease was probably due to
the fast decomposition of hydroxyl radicals and hydro-
Ž .gen peroxide at high pH Christensen et al., 1982 .
However, direct photolysis of phenol was accelerated in
alkalized solutions due to the increase in ‘phenolate
Ž .anions light absorbency’. Beltran et al. 1996 , Stefan et
Ž .al. 1996 observed that direct photolysis contributions
decreased when pH increased from 2 to 7 and then
increased to 60% at pH 12. In addition, they reported
that the initial rate of acetone removal was indepen-
dent of pH in the range of 2᎐7. At pH 10, the initial
Table 2
.Rate constants for OH formation by H O photolysis2 2
Rxn Reaction Reaction rate Source
y1 y1Ž .no. constant M иs
y6 y1.1 H O qh¨ ª2OH r s1.52=10 Mи s This work2 2 uv
7. . Ž .2 OH qH O ª OOHqH O 2.7=10 Buxton et al. 19882 2 2
. . Ž . Ž .3 OOHqH O ªOH qH OqO 0.5"0.09 Weinstein and Bielski 19792 2 2 2
5. Ž .4 2 OOHªH O qO 8.3=10 Buxton et al. 19882 2 2
9. . Ž .5 OOHqOH ªH OqO 8.0=10 Elliot and Buxton 19922 2
( )R. Alnaizy, A. Akgerman rAd¨ances in En¨ironmental Research 4 2000 233᎐244 237
Fig. 2. Phenol oxidation at various H O rphenol ratios and2 2
constant initial phenol concentration. Experimental condi-
tions: Ts27ЊC, C0
s2.23"0.3=10y3
M.Ph
rate was inhibited. This was explained in terms of
hydrogen peroxide dissociation in alkaline media. Also,
the fast reaction of hydroxyl radicals with hydrogen
peroxide was responsible for the observed decrease in
phenol destruction in acidic media. Consequently, pho-
tolysis combined with hydrogen peroxide was most ef-
fective in neutral solutions. Based on these findings
and because our runs were similarly independent of pH
Ž .within the range of 6᎐10 all subsequent runs were
Ž .performed in neutral media pH 6᎐7 .
3.2. Phenol oxidation by ultra¨iolet radiation
A few runs were performed using ultraviolet radia-
tion alone to oxidize phenol in aqueous media in the
same reactor. The results of one experiment are shown
in Fig. 2 at an initial phenol concentration of 210"10
Ž y3
.ppm 2.23=10 M at 45ЊC. Almost 25% of phenol
was oxidized in 1.5 h and more than 45% degradation
occurred over a 4-h period due to direct UV photolysis,
or hydroxyl radical attack. However, we have also
observed that oxidation by UV alone does lead to
Žformation of two or more ring compounds Alnaizy,
.1999 .
3.3. H O rphenol molar ratio effects2 2
Fig. 2 shows a few runs that were conducted at a
constant initial phenol concentration of 210"10 ppm
Ž y3
.2.23=10 M . Hydrogen peroxide doses were varied
between 5.0=10y3
and 0.5 M to determine the effects
of the H O rphenol molar ratio. We have evaluated a2 2
Ž .very wide range of H O rphenol molar ratios 2᎐500 .2 2
Hydrogen peroxide enhanced the photolytic degrada-
tion of phenol greatly relative to direct photolysis.
However, H O concentrations had two opposing ef-2 2
fects on the reaction rate. Increasing the initial hydro-
gen peroxide concentration enhanced the oxidation
process up to a certain point at which hydrogen perox-
ide started to inhibit the phenol photolytic degradation.
At higher hydrogen peroxide concentrations, Reaction
Ž . Ž .2 in the H O photolysis mechanism Table 2 be-2 2
came very important and hydrogen peroxide acted as a
free-radical scavenger itself, thereby decreasing the
hydroxyl radicals concentration.
At our operating wavelength and light intensity, we
deduced that the optimum H O rphenol molar ratio2 2
was between 100 and 250. At a H O rphenol molar2 2
ratio of 125, more than 95% of phenol was oxidized in
Ž .40 min. At higher H O rphenol ratios )300 , hydro-2 2
gen peroxide negatively affected the ultraviolet photo-
lytic process despite the higher free-radical production
Ž .rate. In agreement with Glaze et al. 1995 , Beltran et
Ž .al. 1996 a significant reduction in the degradation
rate was observed, which revealed the inhibitory effects
of excess H O .2 2
3.4. Initial phenol concentration effects
Fig. 3 shows results of other runs conducted at a
H O rphenol molar ratio of f200, at 27"2ЊC and2 2
various initial phenol concentrations. At a concentra-
Ž y4
.tion of 40 ppm 4.26=10 M , approximately 90%
oxidation was achieved in 20 min and complete oxida-
tion was achieved in less than 30 min. The photolysis
rate decreased significantly when the initial phenol
concentration was increased to approximately 500 ppm
Ž y3
.5.15=10 M ; only 14% was oxidized over a 30-min
period. Most previous authors did not investigate the
effects of initial concentration on reaction rates. Nearly
all investigators have reported a pseudo-first-order re-
Žaction rate for UVrH O oxidation Hong et al., 1966;2 2
Glaze et al., 1995; Scheck and Frimmel, 1995; Stefan et
. Ž .al., 1996 . Wei and Wan 1991 studied the photocat-
alytic oxidation of phenol in oxygenated solution with
suspensions of titanium dioxide powder. They observed
that high initial phenol concentrations had a negative
effect on the pseudo-first-order reaction rate constant.
In other words, phenol photodecomposition decreased
with increasing initial phenol concentration. They also
observed that the reduction rate of chemical oxygen
Ž .demand COD was much slower than the phenol de-
Ž .composition rate. In addition, Augugliaro et al. 1988
have reported a negative first-order reaction kinetic for
phenol photocatalytic decomposition and the initial
phenol concentration had a remarkable inhibitory ef-
fect on the apparent rate constant. Although the
pseudo-first-order reaction kinetics may give a good
approximation over a wide range of concentrations, it
does not represent the true rate, because the rate
constants depend on the initial concentration. Hence,
it was necessary to develop a model that would take
( )R. Alnaizy, A. Akgerman rAd¨ances in En¨ironmental Research 4 2000 233᎐244238
Fig. 3. Phenol oxidation at constant H O rphenol ratiof200,2 2
Ts27ЊC and various initial phenol concentration, C0
sPh
0.43᎐5.2=10y3
M.
into consideration this initial concentration depen-
dency.
3.5. Temperature effects
To determine the effect of temperature on reaction
rates, several runs were performed at temperatures
between 27 and 45ЊC. Fig. 4 shows results of two runs
conducted at a H O rphenol molar ratio of 200 and2 2
Ž y3
initial phenol concentration of f480 ppm 5.2=10
.M . As expected, heating enhanced the oxidation rate
significantly: at the higher temperature, more than
90% oxidation occurred vs. less than 30% oxidation for
the other, over the same 90-min period.
4. Reaction mechanism
We have identified the following reaction intermedi-
ates by HPLC analysis: 1,2-dihydroxybenzene
Ž . Ž .catechol , 1,3-dihydroxybenzene resorcinol , 1,4-dihy-
Fig. 4. Phenol photolytic oxidation at constant H O rphenol2 2
ratiof200, initial phenol concentration, C0
f5.2=10y3
M,Ph
and different temperatures.
Ž .droxybenzene hydroquinone , 2,5-cyclohexadiene-1,4-
dione, muconic acid, maleic acid, fumaric acid, oxalic
acid and formic acid. The difference between initial
Ž .carbon concentration ts0 and the carbon concentra-
Ž .tion at time t was assumed to be the CO concentra-2
tion. This was determined by means of TOC analysis.
Most of the products listed above are identical to those
Ž .reported by Devlin and Harris 1984 , Scheck and
Ž .Frimmel 1995 . The only carboxylic acid that was
detected over the entire reaction time was oxalic acid.
Ž .However, Devlin and Harris 1984 reported that gly-
oxal and glyoxylic acids have the same retention times
as oxalic acid and they cannot be separated by HPLC,
hence they may also have been present in the oxalic
Ž .acid amounts we determined. Ogata et al. 1983 stated
that excited molecules of organics often respond dif-
ferently than those in ground states and hence photoly-
sis is expected to proceed via a different mechanism
than wet oxidation. Nevertheless, phenol photolysis in
the presence of hydrogen peroxide followed almost the
Ž .same path as the Devlin and Harris 1984 mechanism
for aqueous phenol oxidation with dissolved oxygen.
4.1. Formation of aromatic intermediates
The breakdown of hydrogen peroxide to form hy-
droxyl radicals activates the phenol aromatic ring
through a strong resonance electron-donating effect. It
is well known that this effect is felt most strongly at the
ortho and para positions. This fact was confirmed by
our results; hydroquinone and catechol appeared in
amounts sufficient to quantify, but a very low yield of
resorcinol was detected. Resorcinol was present only in
trace amounts, F2%, and the catecholrhydroquinone
ratio was always greater than unity. Our results agree
Ž .with those of Lipczynska-Kochany 1993 who studied
flash photolysis of phenol in the presence of hydrogen
Žperoxide and concluded that ortho-hydroxylation i.e.
.catechol formation was predominant. In our study,
these dihydroxybenzenes were produced and observed
in the same product distribution under all experimental
Ž .conditions. Lipczynska-Kochany 1993 , however, re-
ported that hydroquinone was the main primary product
of phenol direct photolysis in dilute degassed aqueous
solutions. He also detected 1,2,4- and 1,2,3-trihydroxy-
Ž .benzene pyrogallol , though this further hydroxylation
reaction on the aromatic ring was of minor yield and
was not investigated. If this configuration were main-
tained in this reaction, that is preferential ortho-
hydroxylation, o-benzoquinone formation should tran-
scend p-benzoquinone concentrations. However, there
was no evidence to support this, from this work or
Ž .others, because: 1 benzoquinones, especially ortho,
are fairly unstable and are easily cleaved to form
Ž .aliphatic compounds; 2 benzoquinones and dihydroxy-
benzenes are in redox equilibrium, which may cause
( )R. Alnaizy, A. Akgerman rAd¨ances in En¨ironmental Research 4 2000 233᎐244 239
Fig. 5. Concentration histories of the aromatic intermediates
in phenol oxidation by UVrH O . Experimental conditions:2 2
C0
s 5.17 = 10y 3
M; T s 45ЊC; C s 0.245 M;Ph H2 O2
H O rphenol molar ratios47.2 2
Žshifting during sampling and HPLC analysis Scheck
. Ž .and Frimmel 1995 ; 3 as mentioned earlier, o-benzo-
quinone standards were not available commercially,
which prevented us from either confirming its presence
or following its concentration vs. time. Typical concen-
tration histories of these aromatic substances are shown
in Fig. 5.
From Fig. 5, it is clear that the ortho-hydroxylation
was preferred over the meta or para-substitution. The
catechol concentration was approximately 25 times
higher than the hydroquinone concentration at the
beginning of the reaction and resorcinol was present in
a minute amount. In all runs that utilized UV irradia-
tion combined with hydrogen peroxide, all three dihy-
dric phenols were produced. We also detected p-ben-
zoquinone in all runs except in those that were per-
formed at low initial phenol concentration. Neither
p-benzoquinone nor resorcinol was observed at low
initial phenol concentration, because of the faster reac-
Ž .tion rate at low initial phenol concentrations Fig. 3 .
At low temperatures, keeping all other parameters
constant, resorcinol was detected but not p-benzo-
quinone. This observation may indicate that p-benzo-
quinone decomposition was very rapid when sufficient
hydroxyl radicals were present, even at low tempera-
tures.
4.2. Formation of carboxylic acids
Organic acids were formed and detected as interme-
diates andror final products under all conditions. The
formation of these acids was consistent with pH changes
in all experiments. The aqueous solution initial pH was
;6.8 and within the first 30 min of irradiation, the pH
ranged between 4.3 and 4.7. Then slowly over the
reaction period, it decreased to approximately 3.2. By
means of HPLC analysis using the previously described
organic acids column, only five acidic compounds were
positively identified. Under all of the experimental con-
ditions used in this study, we detected measurable
quantities of the following acids: z,z-muconic, maleic
and its isomer fumaric, oxalic, and formic acids. The
exceptions were the runs conducted at low H O rphe-2 2
nol molar ratio and at high initial phenol concentra-
tion. At high initial phenol concentration, formic acid
was observed in a very small concentration in discrete
samples, hence, no conclusion could be made about its
presence. There were five other unknown peaks. They
must have been due to carboxylic andror aliphatic
acids because they always eluted within the first few
minutes of HPLC analysis. In addition, we know that
they were not succinic acid, malonic acid, or acetic acid
because none of the unidentified peaks matched these
acids when previously used to calibrate standards re-
tention time. Furthermore, they could not be glyoxal
and glyoxylic acids because their responses were re-
Ž .ported by Devlin and Harris 1984 to be similar to that
Ž .of oxalic acid. Scheck and Frimmel 1995 reported the
Žpresence of three muconic isomers Z, Z; E, E; and Z,
.E configurations ; we have confirmed the formation of
Ž .the first isomer Z, Z but the others were unavailable
commercially to prove their presence. The presence of
acrylic acids was unlikely because 3-carbon compound
formation was not bound to occur. Based on the acid
intermediates and products detected, hydroxyl radical
attacks on the double bonds of the unsaturated
Žmuconic acid formed maleic and fumaric acid 4-carbon
. Ž .acid as well as oxalic acid 2-carbon acid . Another
route is the cleavage of the 1,4-dihydroxybenzene dou-
ble bond after being hydroxylated to form maleic and
Ž .oxalic acid Scheck and Frimmel, 1995 . However, De-
Ž .vlin and Harris 1984 confirmed that acrylic acids were
produced but in very low concentrations under all
Ž .conditions e.g. excess oxygen or excess phenol . In any
case, these unidentified peaks were readily photoxi-
dized and they disappeared as the reaction progressed.
Consequently, their quantification was not possible and
Fig. 6. Concentration histories of the carboxylic acids, C0
sPh
1.74=10y3
M; Ts45ЊC; C s0.147 M; H O rphenolH2 O2 2 2
molar ratios84.
( )R. Alnaizy, A. Akgerman rAd¨ances in En¨ironmental Research 4 2000 233᎐244240
they were lumped into one term that we called ‘acids’
in the kinetic study.
Fig. 6 shows acid concentration histories in
UVrH O oxidation runs at 45"2ЊC. Muconic, maleic,2 2
fumaric and oxalic acids appeared within the first 10
min of reaction time whereas formic acid appeared
after approximately 30 min of reaction time had
elapsed. When the initial phenol concentration was
doubled, formic acid was not observed and it took
maleic acid almost 4 h to start disappearing, though
very slowly. This is another clear indication that the
initial phenol concentration inhibits the oxidation rate,
which we will discuss in detail in Section 5.
Oxalic acid was the main reaction product over the
entire reaction time in all runs under all conditions. On
the basis of this observation and in order to calculate
the molar concentration of the lumped-term acids in
the kinetics study, we used the molecular weight of
oxalic acid as the average molecular weight of the acids
to estimate its concentration. The steady rise and the
relatively higher concentrations of maleic and oxalic
acid over the first 4 h may confirm the hypothesis of
Ž .Scheck and Frimmel 1995 , the cleavage of the 1,4-di-
hydroxybenzene double bond after hydroxylation. They
postulated that one double bond of benzoquinone may
be hydroxylated then cleaved by the oxidation process
Ž .yielding maleic acid or its isomer fumaric acid and
oxalic acids without going through an intermediate
such as muconic acid. This observation would apply
more to p-benzoquinone, because the fumaric acid
concentration was always much less than that of its
isomer maleic acid.
( )4.3. Total organic carbon TOC history
Carbon dioxide concentrations were determined by
material balances assuming that any unaccounted for
Ž .carbon mineralizes to carbon dioxide CO . The rate2
of carbon dioxide formation was calculated by averag-
ing both readings from HPLC analysis and the TOC
analyzer, then the difference between TOC and the
carbon amount that was initially present in phenol
resulted in carbon dioxide production. Also, the carbon
Ž .in the unidentified intermediates acids was found
from the difference between the TOC readings and the
carbon that was present in phenol and known interme-
diate ring compounds. Fig. 7 shows TOC concentration
vs. time for several runs at different initial phenol
concentrations and temperature. In a typical run, ap-
proximately 10 wt.% of the initial carbon present in
phenols was converted to CO in the first hour. How-2
ever, the conversion rate can easily be enhanced by
finely tuning the reaction parameters, such as hydrogen
peroxide concentration, temperature, and UV light in-
tensity. The results of a run that was performed at 45ЊC
and a relatively low initial phenol concentration show
Fig. 7. Total organic carbon concentration profile for several
runs at different phenol initial concentrations and tempera-
tures.
almost 20 wt.% organic carbon conversion to CO . It2
took approximately 4 h of continuous irradiation in the
presence of H O to achieve 70 wt.% conversion of the2 2
Ž .organic carbons to inorganic carbons CO . The rest2
of the organic carbons were mainly found in the form
of formic and oxalic acids.
5. Kinetic model
For our kinetic study, a simplified reaction pathway
for phenol oxidation by UV radiation combined with
hydrogen peroxide is depicted in Fig. 8. In this model,
all carboxylic acids are lumped together as ‘acids’.
Furthermore, because the predominant acid was oxalic
acid, we used its molecular weight as an average to
estimate the molar concentration of the acids. In addi-
tion, we neglected Reaction 3 in the hydrogen peroxide
Ž .photolysis mechanism Table 2 , because the reported
rate constant is very low. We assumed that hydrogen
peroxide concentration remains constant since it was
very much in excess. H O decomposes by reaction 12 2
Ž .but forms by reaction 4 Fig. 8 . This assumption was
verified by the negligible change in the hydrogen perox-
Ž .ide peak area concentration as well. In the kinetics,
we assumed second order rates involving the organic
species concentration and hydrogen peroxide concen-
Ž .tration Fig. 5 . Experimental results showed that
phenol oxidation rates depended on hydrogen peroxide
concentration and the initial phenol concentration.
There was an optimum hydrogen peroxide concentra-
tion where the rate was maximum. De Laat et al.
Ž .1994 in their UVrH O oxidation study of2 2
chloroethanes in dilute-aqueous solution reported a
Ž .similar observation. Nicole et al. 1990 calculated the
reactor wall reflection factor, which varied from unity
for non-reflecting surfaces to 4.8 for aluminum-foiled
quarts reactor walls. In our study, the reactor had
( )R. Alnaizy, A. Akgerman rAd¨ances in En¨ironmental Research 4 2000 233᎐244 241
Fig. 8. A simplified reaction pathway for phenol oxidation by
UVrH O .2 2
Ž .non-reflecting walls Pyrex-glass reactor that had a
reflection factor of unity. The estimated total absor-
Ž .bance of the solution was very high A s15.7 , hencet
Ž . Ž yA
.in Eq. 3 , the term 1ye and the equation wast
reduced to
2⌽ IH O 02 2
.w x Ž .OH s 6ss n
.k C qk C q k CÝ2 H O 5 OOH i i2 2
is1
Initial concetrations of hydrogen peroxide and
phenol were known, and values of I and l wereo
Ž .measured and calculated Table 1 . Based on Baxen-
Ž .dale and Wilson 1956 , the primary quantum yield of
Ž .hydrogen peroxide ⌽ is 0.49. In the overallH O2 2
Ž .process Reactions 1᎐4 , two hydroxyl radicals are
formed per photon absorbed. Hence, the overall value
of ⌽ was taken as unity. We used the literatureH O2 2
Žvalues for the reaction constants k , k , and k Table2 4 5
.2 . Initial concentrations of the hydroxyl radical were
Ž ..assumed to be zero. The term k C in the de-5 OOH
Ž .nominator of Eq. 6 is negligible compared to the
other two terms.
Ž .Parameter estimation of the variables k is op-i
timized, based on how well the model fits a set of
experimental observations. SimuSolvTM
uses a syste-
matic and quantitative method to adjust and optimize
k values. It uses the log likelihood functions as thei
criterion and either the generalized reduced gradient
method or the Nelder᎐Mead search method to adjust
the k . Values of the hydroxyl radical concentrationi
were substituted into the above equations and concen-
trations of phenol, catechol, hydroquinone, resorcinol,
benzoquinone, acid, and CO were calculated at time t.2
5.1. Initial phenol and hydrogen peroxide
concentration effects
ŽFor a given H O concentration range ;50᎐5002 2
.mM , the degradation rate of phenol depends on its
initial concentration. At low initial phenol concentra-
tion, the reaction rate constant of phenol disappear-
Ž . 10 y1 y1
ance k qk qk f1.41=10 M s agrees well6 7 8
Ž .with Apak and Hugul 1996 who reported rate con-
stants of phenol photolysis as 1.4=1010
My1
sy1
.
However, as the phenol concentration increases, the
hydroxyl radical concentration decreases because
phenol molecules compete more efficiently with hydro-
gen peroxide molecules for the radicals. Doubling the
initial phenol concentration from 5.17=10y3
to 1.05=
10y2
M decreased the hydroxyl radical concentration
from 1.6=10y11
to 5.5=10y12
M. Hence, the pho-
toassisted oxidation rate of phenol decreases. In addi-
tion, this suggested that the generated intermediates
and the acids become increasingly important scav-
engers of hydroxyl radicals.
As mentioned before, increasing hydrogen peroxide
concentration enhances the oxidation rate up to an
optimum H O rphenol molar ratio where hydrogen2 2
peroxide starts to inhibit the degradation process.
Therefore, strictly speaking, the hydrogen peroxide
dosage does not significantly affect the reaction rate as
long as the reaction is performed within the optimized
molar ratio. Correspondingly, it is conceivable that the
kinetics of photoxidation of organics depend mainly on
the initial concentration of the parent organics.
Ž . Ž .A plot of ln k vs. ln C demonstrates the inhibi-Ph
tory effect of the initial phenol concentration on the
Ž .oxidation rates Fig. 9 . This negative dependence of
the reaction rate on initial phenol concentration is
Ž .correlated in the form of Eq. 7 .
Ž . Ž n . Ž .ln k sln a C 7i i Ph0
The above discussion is in agreement with Au-
Ž .gugliaro et al. 1988 findings that the pseudo-first-order
reaction rate constant is inversely proportional to the
Ž .initial phenol concentration. In Eq. 7 , the slope nf
Ž .y1 Fig. 9 . The linear relationship was incorporated
Ž .with Eq. 6 to give the following ordinary differential
Fig. 9. Effect of initial phenol concentration on reaction rate
constants of phenol oxidation.
( )R. Alnaizy, A. Akgerman rAd¨ances in En¨ironmental Research 4 2000 233᎐244242
equation network for the kinetic scheme shown in Fig.
8:
CdC OHPh и Ž . Ž .s k qk qk C 86 7 8 Phdt CPho
CdC OHCatechol и Ž . Ž .s k C yk C 96 Ph 9 catecholdt CPho
CdC OHResorcinol и Ž . Ž .s k C yk C 107 Ph 10 Resorcinoldt CPho
CdC OHHydroqunione и Ž .s k C yk C8 Ph 11 Hydroquinonedt CPho
Ž .11
CdC OHBenzoquinone и Žs k C11 Hydroquinonedt CPho
. Ž .yk C 1212 Benzoquinone
CdC OHAcid и Žs k C qk C9 Catechol 10 Resorcinoldt CPho
. Ž .qk C yk C 1312 Benzoquinone 13 Acid
CdC OHCO2 и Ž .s k C 1413 Aciddt CPho
The above equations were coupled with the equation
Ž .for hydroxyl radical concentration, Eq. 15 .
C s.OH ss
¡ ¦
2⌽ IH O 02 2~ ¥1
w Ž .k C q C k qk qk2 H O Ph 6 7 82 2 CPho¢ §qk C qk C k C9 Catechol 10 Resorcinol 11 Hydroquinone
xqk C qk C12 Benzoquinone 13 Acid
Ž .15
5.2. Kinetic simulation
We solved the above differential equations Eqs.
Ž . Ž . TM
8 ᎐ 15 by numerical simulations using the SimuSolv
software package. The simulation started by substitut-
ing the hydroxyl radicals steady-state concentration
Ž . Ž . Ž .C in Eqs. 8 ᎐ 14 . The initial guesses for k.OH i
values were obtained from the intercept of the plot of
Table 3
Reaction rate constants
y1 oŽ . Ž .k s Temperature Ci
27 45
6 7
k 6.51=10 1.05=106
3 5
k 8.33=10 2.24=107
6 6
k 1.27=10 2.76=108
6 6
k 3.31=10 9.53=109
4 7
k 3.83=10 1.14=1010
6 6
k 2.08=10 5.44=1011
5 7
k 1.00=10 4.07=1012
4 6
k 2.23=10 1.00=1013
Ž .rate constants vs. initial phenol concentration, Eq. 7 ,
and Fig. 9. A suitable solution for reaction rate con-
Ž .stants i.e. k through k was found based on the6 13
goodness of fit and the fitted rate constants are pre-
sented in Table 3.
The predictions of phenol, hydroquinones, benzo-
quinones, acids, and CO as a function of time are2
shown in Figs. 10 and 11 by solid curves. Phenol
Ždegradation and hydroquinones production e.g. cate-
.chol, resorcinol, and hydroquinone were measured
Žunder many different conditions e.g. temperature,
H O rphenol molar ratio, initial phenol concentration,2 2
.etc. . The predictions are excellent at most operating
conditions and detailed results and analysis can be
Ž .found in Alnaizy 1999 . The exception was the high-
temperature, low initial phenol concentration run. The
model over-predicted the reaction rate. To interpret
this, it is important to recall that the reaction at low
initial phenol concentration proceeds very fast. The
phenol concentrations predicted by the model were
lower than the observed data. At this relatively low
phenol concentration, the estimated steady-state hy-
Ž y11
droxyl radical concentration is relatively high ;10
.M , but may not actually be as high as predicted by the
model. In other words, the model over-predicted hy-
droxyl radical concentration, which in turn resulted in a
faster oxidation rate.
Predictions of the acids concentration were reason-
ably good for most reaction conditions; any deviation
from the data was due to lumping all acids together
since we could not identify all the acid products and
hence could not calibrate the HPLC analysis. The
predicted concentration of CO was significantly lower2
than the observed data. The observed values were at
least twice those calculated. This discrepancy arises
because CO concentrations were not determined very2
accurately. They were implicitly calculated as the dif-
ference between the total organic carbon reading from
the TOC analyzer and the theoretical amount of or-
ganic carbon that was present in the phenol initially.
Some of the error is also due to residual carbon dioxide
( )R. Alnaizy, A. Akgerman rAd¨ances in En¨ironmental Research 4 2000 233᎐244 243
Fig. 10. Observed and predicted concentrations of aromatic
intermediates for phenol UVrH O oxidation, experimental2 2
conditions: Ts27ЊC; C0
s1.07=10y3
M; C s0.049 M;Ph H2O2
H O rphenol molar ratios45.2 2
in the solutions analyzed, giving artificially high experi-
mental values.
6. Conclusions
Results indicate that the oxidation rate was exclu-
sively due to hydroxyl radical attack when hydrogen
peroxide was in excess. It was shown that in the pres-
ence of hydrogen peroxide, the photodegradation
process significantly increased with respect to UV radi-
ation alone. At initial phenol concentrations of approx-
imately 200 ppm, phenol completely disappeared in less
than 1 h at 27ЊC by the UVrH O process, however,2 2
only approximately 20% of phenol was mineralized to
CO and water and the rest was converted to the2
reaction intermediates. There was an optimum oxidant-
to-organics ratio for the photoxidation of organic pollu-
tants. The optimal values and corresponding molar
ratios of hydrogen peroxide to contaminant greatly
affected the oxidation rates. In addition, results show
Fig. 11. Measured and predicted concentrations of acids and
CO . Experimental conditions: Ts27ЊC; C0
s1.74=10y3
2 Ph
M; C s0.147 M; H O rphenol ratios84.H2 O2 2 2
that as the initial contaminant concentration increased,
the efficiency of the UVrH O AOP decreased.2 2
A free-radical mechanism involving hydroxyl radical
reactions with phenol was developed. The first reaction
step is the hydroxylation of the aromatic ring to yield
hydroquinones, which further oxidize by hydrogen abs-
traction to yield benzoquinones. Then, the ben-
zoquinone ring is cleaved to form muconic acids, which
decompose by .OH to form maleic, fumaric, and oxalic
acids. All intermediates formed initially are finally oxi-
dized to mainly oxalic and formic acids which are
finally destroyed after prolonged oxidation time by
conversion to water and CO . Nonetheless, the reac-2
tion time is rather long, more than 2 h, at high initial
Ž .phenol concentration )150 ppm . A kinetic model for
the advanced oxidation process using UV radiation
combined with hydrogen peroxide was developed. Un-
like most other kinetic models of UVrH O AOP, the2 2
model does not assume pseudo-first-order kinetics. The
model provides a comprehensive understanding of the
negative impact of initial phenol concentration on the
photoxidation rate. The apparent rate constants were
on the order of 107
sy1
at a temperature of 45ЊC and
106
sy1
at 27ЊC.
References
Apak, R., Hugul, M., 1996. Photoxidation of some mono-, di-,
and trichlorophenols in aqueous solution by hydrogen per-
oxiderUV combinations. J. Chem. Tech. Biotechnol. 67,
221᎐226.
Alnaizy R., 1999. Mechanism and Kinetic Study for the Hy-
droxyl Free Radical Mediated Photooxidation of Organic-
Contaminated Aqueous Solutions. PhD Dissertation. Texas
A&M University.
Augugliaro, V., Palmisano, L., Sclafani, A., Minero, C.,
Pelizzetti, E., 1988. Photocatalytic degradation of phenol in
aqueous titanium dioxide dispersions. Toxicol. Environ.
Chem. 16, 89᎐90.
Baxendale, J.H., Wilson, J.A., 1956. The photolysis of hydro-
gen peroxide at high light intensities. J. Trans. Faraday Soc.
53, 344᎐356.
Beltran, F.J., Ovejero, G., Rivas, J., 1996. Oxidation of polynu-
clear aromatic hydrocarbon in water. 3. UV radiation com-
bined with hydrogen peroxide. Ind. Eng. Chem. Res. 35,
883᎐889.
Buxton, G.V., Greenstock, C.L., Helman, W.P., Ross, A.B.,
1988. Critical review of data constants for reactions of
hydrated electrons, hydrogen atoms and hydroxyl radicals
in aqueous solutions. J. Phys. Chem. Ref. Data 17, 513᎐586.
Christensen, H., Sehested, K., Corfitzen, H., 1982. Reactions
of hydroxyl radicals with hydrogen peroxide. J. Phys. Chem.
86, 1588᎐1590.
De Laat, J., Tace, E., Dore, M., 1994. Degradation of
chloroethanes in dilute aqueous solution by HO rUV.2
Water Res. 28, 2507᎐22519.
Devlin, H.R., Harris, I.J., 1984. Mechanism of the oxidation of
aqueous phenol with dissolved oxygen. Ind. Eng. Chem.
Fundam. 23, 387᎐392.
( )R. Alnaizy, A. Akgerman rAd¨ances in En¨ironmental Research 4 2000 233᎐244244
Dulin, D., Drossman, H., Mill, T., 1986. The products and
quantum yields for photolysis of chloroaromatics in water.
Environ. Sci. Technol. 20, 72᎐77.
Elliot, A.J., Buxton, G.V., 1992. Temperature dependence of
the reaction OHqO and OHqHO in water up to2 2
200ЊC. J. Chem. Soc. Faraday Trans. 88, 2465᎐2470.
Glaze, W.H., Kang, J., Lay, Y., 1995. Advanced oxidation
processes. A kinetic model for the oxidation of 1,2-di-
bromo-3-chloropropane in water by the combination of
hydrogen peroxide and UV radiation. Ind. Eng. Chem. Res.
34, 2314᎐2323.
Hong, A., Zappi, M.E., Kuo, C.H., Hill, D., 1966. Modeling
kinetics of illuminated and dark advanced oxidation
processes. J. Environ. Eng. 5, 58᎐62.
La Grega, M.D., Buckingham, P.L., Evans, J.C., 1994. Haz-
ardous Waste Management. McGraw-Hill, New York, NY.
Lipczynska-Kochany, E., 1993. Hydrogen peroxide mediated
photodegradation of phenol as studied by a flash photoly-
sisrHPLC technique. Environ. Pollut. 61, 147᎐152.
Masten, S.J., Davies, S.H.R., 1994. The use of ozonation to
degrade organic contaminants in wastewater. Environ. Sci.
Technol. 28, 180A᎐185A.
Nicole, I., De Laat, J., Dore, M., Duguet, J.P., Bonnel, C.,
1990. Use of UV radiation in water treatment: measure-
ment of photonic flux by hydrogen peroxide actinometry.
Water Res. 24, 157᎐168.
Ogata, Y., Tomizawa, K., Furuta, K., 1983. The Chemistry of
Peroxides. John Wiley, Chichester, UK.
Scheck, C.K., Frimmel, F.H., 1995. Degradation of phenol and
salicylic acid by ultraviolet radiationrhydrogen
peroxideroxygen. Water Res. 29, 2346᎐2352.
Stefan, M.I., Hoy, A.R., Bolton, J.R., 1996. Kinetics and mech-
anism of the degradation and mineralization of acetone in
dilute aqueous solution sensitized by the UV photolysis of
hydrogen peroxide. Environ. Sci. Technol. 30, 2382᎐2390.
Wei, T.Y., Wan, C.C., 1991. Heterogeneous photocatalytic
oxidation of phenol with titanium dioxide powders. Ind.
Eng. Chem. Res. 30, 1293᎐1300.
Weinstein, J., Bielski, B.H., 1979. Kinetics of the interaction
of HO and Oy
radicals with hydrogen peroxide. The2 2
Haber᎐Weiss reaction. J. Am. Chem. Soc. 110, 58᎐62.

Contenu connexe

Tendances

Selective Oxidation of Limonene over γ-Al2O3 Supported Metal Catalyst with H2O2
Selective Oxidation of Limonene over γ-Al2O3 Supported Metal Catalyst with H2O2Selective Oxidation of Limonene over γ-Al2O3 Supported Metal Catalyst with H2O2
Selective Oxidation of Limonene over γ-Al2O3 Supported Metal Catalyst with H2O2Dr. Amarjeet Singh
 
CONVERSION OF DIMETHYL-NITROBENZENE TO DIMETHY L ANILINE, EFFECT OF SOME PROC...
CONVERSION OF DIMETHYL-NITROBENZENE TO DIMETHY L ANILINE, EFFECT OF SOME PROC...CONVERSION OF DIMETHYL-NITROBENZENE TO DIMETHY L ANILINE, EFFECT OF SOME PROC...
CONVERSION OF DIMETHYL-NITROBENZENE TO DIMETHY L ANILINE, EFFECT OF SOME PROC...Berklin
 
Homogeneous Photocatalytic Degradation of Acid Alizarin Black Using Hydrogen ...
Homogeneous Photocatalytic Degradation of Acid Alizarin Black Using Hydrogen ...Homogeneous Photocatalytic Degradation of Acid Alizarin Black Using Hydrogen ...
Homogeneous Photocatalytic Degradation of Acid Alizarin Black Using Hydrogen ...Haydar Mohammad Salim
 
Synthesis of Epoxidizedcardanol from CNSL (Vietnam) by Glacial Acetic Acid an...
Synthesis of Epoxidizedcardanol from CNSL (Vietnam) by Glacial Acetic Acid an...Synthesis of Epoxidizedcardanol from CNSL (Vietnam) by Glacial Acetic Acid an...
Synthesis of Epoxidizedcardanol from CNSL (Vietnam) by Glacial Acetic Acid an...ijtsrd
 
Oxidation of Acetaminophen by Fluidized-bed Fenton Process: Optimization usin...
Oxidation of Acetaminophen by Fluidized-bed Fenton Process: Optimization usin...Oxidation of Acetaminophen by Fluidized-bed Fenton Process: Optimization usin...
Oxidation of Acetaminophen by Fluidized-bed Fenton Process: Optimization usin...Oswar Mungkasa
 
#scichallenge2017 Photocatalytic Degradation of Synthetic Wastewaters Contain...
#scichallenge2017 Photocatalytic Degradation of Synthetic Wastewaters Contain...#scichallenge2017 Photocatalytic Degradation of Synthetic Wastewaters Contain...
#scichallenge2017 Photocatalytic Degradation of Synthetic Wastewaters Contain...Seher Elif Mekik
 
V mn-mcm-41 catalyst for the vapor phase oxidation of o-xylene
V mn-mcm-41 catalyst for the vapor phase oxidation of o-xyleneV mn-mcm-41 catalyst for the vapor phase oxidation of o-xylene
V mn-mcm-41 catalyst for the vapor phase oxidation of o-xylenesunitha81
 
F031101038043
F031101038043F031101038043
F031101038043theijes
 
Adsorption of Phenol from Aqueous Solution using Algal Biochar
Adsorption of Phenol from Aqueous Solution using Algal BiocharAdsorption of Phenol from Aqueous Solution using Algal Biochar
Adsorption of Phenol from Aqueous Solution using Algal BiocharSagar Sonkar
 
Chemical reduction technique for the synthesis of nickel nanoparticles
Chemical reduction technique for the synthesis of nickel nanoparticlesChemical reduction technique for the synthesis of nickel nanoparticles
Chemical reduction technique for the synthesis of nickel nanoparticlesIJERA Editor
 
Use of titanium dioxide photocatalysis on the remediation
Use of titanium dioxide photocatalysis on the remediationUse of titanium dioxide photocatalysis on the remediation
Use of titanium dioxide photocatalysis on the remediationBruno B Garcia
 

Tendances (14)

Fi35943952
Fi35943952Fi35943952
Fi35943952
 
Cannizaro's reaction benzaldehyde
Cannizaro's reaction benzaldehydeCannizaro's reaction benzaldehyde
Cannizaro's reaction benzaldehyde
 
Selective Oxidation of Limonene over γ-Al2O3 Supported Metal Catalyst with H2O2
Selective Oxidation of Limonene over γ-Al2O3 Supported Metal Catalyst with H2O2Selective Oxidation of Limonene over γ-Al2O3 Supported Metal Catalyst with H2O2
Selective Oxidation of Limonene over γ-Al2O3 Supported Metal Catalyst with H2O2
 
CONVERSION OF DIMETHYL-NITROBENZENE TO DIMETHY L ANILINE, EFFECT OF SOME PROC...
CONVERSION OF DIMETHYL-NITROBENZENE TO DIMETHY L ANILINE, EFFECT OF SOME PROC...CONVERSION OF DIMETHYL-NITROBENZENE TO DIMETHY L ANILINE, EFFECT OF SOME PROC...
CONVERSION OF DIMETHYL-NITROBENZENE TO DIMETHY L ANILINE, EFFECT OF SOME PROC...
 
Homogeneous Photocatalytic Degradation of Acid Alizarin Black Using Hydrogen ...
Homogeneous Photocatalytic Degradation of Acid Alizarin Black Using Hydrogen ...Homogeneous Photocatalytic Degradation of Acid Alizarin Black Using Hydrogen ...
Homogeneous Photocatalytic Degradation of Acid Alizarin Black Using Hydrogen ...
 
Synthesis of Epoxidizedcardanol from CNSL (Vietnam) by Glacial Acetic Acid an...
Synthesis of Epoxidizedcardanol from CNSL (Vietnam) by Glacial Acetic Acid an...Synthesis of Epoxidizedcardanol from CNSL (Vietnam) by Glacial Acetic Acid an...
Synthesis of Epoxidizedcardanol from CNSL (Vietnam) by Glacial Acetic Acid an...
 
Oxidation of Acetaminophen by Fluidized-bed Fenton Process: Optimization usin...
Oxidation of Acetaminophen by Fluidized-bed Fenton Process: Optimization usin...Oxidation of Acetaminophen by Fluidized-bed Fenton Process: Optimization usin...
Oxidation of Acetaminophen by Fluidized-bed Fenton Process: Optimization usin...
 
#scichallenge2017 Photocatalytic Degradation of Synthetic Wastewaters Contain...
#scichallenge2017 Photocatalytic Degradation of Synthetic Wastewaters Contain...#scichallenge2017 Photocatalytic Degradation of Synthetic Wastewaters Contain...
#scichallenge2017 Photocatalytic Degradation of Synthetic Wastewaters Contain...
 
V mn-mcm-41 catalyst for the vapor phase oxidation of o-xylene
V mn-mcm-41 catalyst for the vapor phase oxidation of o-xyleneV mn-mcm-41 catalyst for the vapor phase oxidation of o-xylene
V mn-mcm-41 catalyst for the vapor phase oxidation of o-xylene
 
IJLRET published
IJLRET publishedIJLRET published
IJLRET published
 
F031101038043
F031101038043F031101038043
F031101038043
 
Adsorption of Phenol from Aqueous Solution using Algal Biochar
Adsorption of Phenol from Aqueous Solution using Algal BiocharAdsorption of Phenol from Aqueous Solution using Algal Biochar
Adsorption of Phenol from Aqueous Solution using Algal Biochar
 
Chemical reduction technique for the synthesis of nickel nanoparticles
Chemical reduction technique for the synthesis of nickel nanoparticlesChemical reduction technique for the synthesis of nickel nanoparticles
Chemical reduction technique for the synthesis of nickel nanoparticles
 
Use of titanium dioxide photocatalysis on the remediation
Use of titanium dioxide photocatalysis on the remediationUse of titanium dioxide photocatalysis on the remediation
Use of titanium dioxide photocatalysis on the remediation
 

En vedette

Ozonation of municipal wastewater rev mar 05
Ozonation of municipal wastewater rev mar 05Ozonation of municipal wastewater rev mar 05
Ozonation of municipal wastewater rev mar 05Tst Thong
 
Doctoral Thesis Presentation
Doctoral Thesis PresentationDoctoral Thesis Presentation
Doctoral Thesis Presentationmarcelskoumal
 
Spartan Environmental Technologies Presentation
Spartan Environmental Technologies PresentationSpartan Environmental Technologies Presentation
Spartan Environmental Technologies PresentationARSacco
 
Sonophotocatalytic Degradation of Waste Water
Sonophotocatalytic Degradation of Waste WaterSonophotocatalytic Degradation of Waste Water
Sonophotocatalytic Degradation of Waste WaterTejas Deshpande
 
Advanced Oxidation Process for Industrial Water Treatment and Waste Water
Advanced Oxidation Process for  Industrial Water Treatment and Waste WaterAdvanced Oxidation Process for  Industrial Water Treatment and Waste Water
Advanced Oxidation Process for Industrial Water Treatment and Waste WaterUus Soedjak
 
advanced oxidation process
advanced oxidation processadvanced oxidation process
advanced oxidation processMahendheran Mech
 
Waste Water Treatment Process Presentation
Waste Water Treatment Process PresentationWaste Water Treatment Process Presentation
Waste Water Treatment Process PresentationAshish Kakadia
 
28737268 waste-water-treatment-ppt
28737268 waste-water-treatment-ppt28737268 waste-water-treatment-ppt
28737268 waste-water-treatment-pptabhiiii4558
 
Waste water treatment processes
Waste water treatment processesWaste water treatment processes
Waste water treatment processesAshish Agarwal
 

En vedette (15)

Advanced oxidation
Advanced oxidationAdvanced oxidation
Advanced oxidation
 
Ozonation of municipal wastewater rev mar 05
Ozonation of municipal wastewater rev mar 05Ozonation of municipal wastewater rev mar 05
Ozonation of municipal wastewater rev mar 05
 
Application Of Ozone - Hospitality
Application Of Ozone - HospitalityApplication Of Ozone - Hospitality
Application Of Ozone - Hospitality
 
Doctoral Thesis Presentation
Doctoral Thesis PresentationDoctoral Thesis Presentation
Doctoral Thesis Presentation
 
Spartan Environmental Technologies Presentation
Spartan Environmental Technologies PresentationSpartan Environmental Technologies Presentation
Spartan Environmental Technologies Presentation
 
Sonophotocatalytic Degradation of Waste Water
Sonophotocatalytic Degradation of Waste WaterSonophotocatalytic Degradation of Waste Water
Sonophotocatalytic Degradation of Waste Water
 
Advanced Oxidation Process for Industrial Water Treatment and Waste Water
Advanced Oxidation Process for  Industrial Water Treatment and Waste WaterAdvanced Oxidation Process for  Industrial Water Treatment and Waste Water
Advanced Oxidation Process for Industrial Water Treatment and Waste Water
 
L 28 disinfection
L 28 disinfectionL 28 disinfection
L 28 disinfection
 
advanced oxidation process
advanced oxidation processadvanced oxidation process
advanced oxidation process
 
Adv chem chapt 4
Adv chem chapt 4Adv chem chapt 4
Adv chem chapt 4
 
Oxidation & reduction
Oxidation & reductionOxidation & reduction
Oxidation & reduction
 
Waste Water Treatment
Waste Water TreatmentWaste Water Treatment
Waste Water Treatment
 
Waste Water Treatment Process Presentation
Waste Water Treatment Process PresentationWaste Water Treatment Process Presentation
Waste Water Treatment Process Presentation
 
28737268 waste-water-treatment-ppt
28737268 waste-water-treatment-ppt28737268 waste-water-treatment-ppt
28737268 waste-water-treatment-ppt
 
Waste water treatment processes
Waste water treatment processesWaste water treatment processes
Waste water treatment processes
 

Similaire à Advanced oxidation of phenolic compounds

JSIR 63(6) 518-521
JSIR 63(6) 518-521JSIR 63(6) 518-521
JSIR 63(6) 518-521Rashmi Naidu
 
Synthesis, Characterization and Electrical Properties of Polyaniline Doped wi...
Synthesis, Characterization and Electrical Properties of Polyaniline Doped wi...Synthesis, Characterization and Electrical Properties of Polyaniline Doped wi...
Synthesis, Characterization and Electrical Properties of Polyaniline Doped wi...IJERA Editor
 
Ultrasonic reactions [autosaved]
Ultrasonic reactions [autosaved]Ultrasonic reactions [autosaved]
Ultrasonic reactions [autosaved]MadhuraDatar
 
Photocatalytic Degradation of Meta-chlorophenol using Solar and Artificial Ra...
Photocatalytic Degradation of Meta-chlorophenol using Solar and Artificial Ra...Photocatalytic Degradation of Meta-chlorophenol using Solar and Artificial Ra...
Photocatalytic Degradation of Meta-chlorophenol using Solar and Artificial Ra...theijes
 
Effects of Acid on Chlorophyll Production of Common
Effects of Acid on Chlorophyll Production of CommonEffects of Acid on Chlorophyll Production of Common
Effects of Acid on Chlorophyll Production of CommonCorinne Breymeier
 
Arsenic removal from water using activated carbon derived from peltophorum pt...
Arsenic removal from water using activated carbon derived from peltophorum pt...Arsenic removal from water using activated carbon derived from peltophorum pt...
Arsenic removal from water using activated carbon derived from peltophorum pt...eSAT Journals
 
My work at OHSU
My work at OHSUMy work at OHSU
My work at OHSUbaumanab
 
Potential use of plantain (musa paradisiaca) wastes in the removal of lead an...
Potential use of plantain (musa paradisiaca) wastes in the removal of lead an...Potential use of plantain (musa paradisiaca) wastes in the removal of lead an...
Potential use of plantain (musa paradisiaca) wastes in the removal of lead an...ADEOLU ADEDOTUN TIMOTHY
 
Ureases mimics
Ureases mimicsUreases mimics
Ureases mimicsdony stark
 
Wcce08 Pasi Tolvanen Final
Wcce08   Pasi Tolvanen   FinalWcce08   Pasi Tolvanen   Final
Wcce08 Pasi Tolvanen Finalpasitolvanen
 
Water_Determination_by_Karl_Fischer_Titr.pdf
Water_Determination_by_Karl_Fischer_Titr.pdfWater_Determination_by_Karl_Fischer_Titr.pdf
Water_Determination_by_Karl_Fischer_Titr.pdfMunazzaSohail2
 
Flame Photometric Estimation
Flame Photometric EstimationFlame Photometric Estimation
Flame Photometric EstimationPritam Kolge
 
ijsrmjournal,+Journal+manager,+5+ijsrm.pdf
ijsrmjournal,+Journal+manager,+5+ijsrm.pdfijsrmjournal,+Journal+manager,+5+ijsrm.pdf
ijsrmjournal,+Journal+manager,+5+ijsrm.pdfMarthaPhasha
 

Similaire à Advanced oxidation of phenolic compounds (20)

JSIR 63(6) 518-521
JSIR 63(6) 518-521JSIR 63(6) 518-521
JSIR 63(6) 518-521
 
shao2003.pdf
shao2003.pdfshao2003.pdf
shao2003.pdf
 
Synthesis, Characterization and Electrical Properties of Polyaniline Doped wi...
Synthesis, Characterization and Electrical Properties of Polyaniline Doped wi...Synthesis, Characterization and Electrical Properties of Polyaniline Doped wi...
Synthesis, Characterization and Electrical Properties of Polyaniline Doped wi...
 
C05521422
C05521422C05521422
C05521422
 
Ijetr011948
Ijetr011948Ijetr011948
Ijetr011948
 
Ultrasonic reactions [autosaved]
Ultrasonic reactions [autosaved]Ultrasonic reactions [autosaved]
Ultrasonic reactions [autosaved]
 
Photocatalytic Degradation of Meta-chlorophenol using Solar and Artificial Ra...
Photocatalytic Degradation of Meta-chlorophenol using Solar and Artificial Ra...Photocatalytic Degradation of Meta-chlorophenol using Solar and Artificial Ra...
Photocatalytic Degradation of Meta-chlorophenol using Solar and Artificial Ra...
 
Effects of Acid on Chlorophyll Production of Common
Effects of Acid on Chlorophyll Production of CommonEffects of Acid on Chlorophyll Production of Common
Effects of Acid on Chlorophyll Production of Common
 
Bio treatment of wastewater atun
Bio treatment of wastewater  atunBio treatment of wastewater  atun
Bio treatment of wastewater atun
 
Arsenic removal from water using activated carbon derived from peltophorum pt...
Arsenic removal from water using activated carbon derived from peltophorum pt...Arsenic removal from water using activated carbon derived from peltophorum pt...
Arsenic removal from water using activated carbon derived from peltophorum pt...
 
Arsenic removal from water using activated carbon derived from peltophorum pt...
Arsenic removal from water using activated carbon derived from peltophorum pt...Arsenic removal from water using activated carbon derived from peltophorum pt...
Arsenic removal from water using activated carbon derived from peltophorum pt...
 
My work at OHSU
My work at OHSUMy work at OHSU
My work at OHSU
 
Mercury_JECE
Mercury_JECEMercury_JECE
Mercury_JECE
 
Potential use of plantain (musa paradisiaca) wastes in the removal of lead an...
Potential use of plantain (musa paradisiaca) wastes in the removal of lead an...Potential use of plantain (musa paradisiaca) wastes in the removal of lead an...
Potential use of plantain (musa paradisiaca) wastes in the removal of lead an...
 
Ag36194199
Ag36194199Ag36194199
Ag36194199
 
Ureases mimics
Ureases mimicsUreases mimics
Ureases mimics
 
Wcce08 Pasi Tolvanen Final
Wcce08   Pasi Tolvanen   FinalWcce08   Pasi Tolvanen   Final
Wcce08 Pasi Tolvanen Final
 
Water_Determination_by_Karl_Fischer_Titr.pdf
Water_Determination_by_Karl_Fischer_Titr.pdfWater_Determination_by_Karl_Fischer_Titr.pdf
Water_Determination_by_Karl_Fischer_Titr.pdf
 
Flame Photometric Estimation
Flame Photometric EstimationFlame Photometric Estimation
Flame Photometric Estimation
 
ijsrmjournal,+Journal+manager,+5+ijsrm.pdf
ijsrmjournal,+Journal+manager,+5+ijsrm.pdfijsrmjournal,+Journal+manager,+5+ijsrm.pdf
ijsrmjournal,+Journal+manager,+5+ijsrm.pdf
 

Advanced oxidation of phenolic compounds

  • 1. Ž .Advances in Environmental Research 4 2000 233᎐244 Advanced oxidation of phenolic compounds R. Alnaizy, A. AkgermanU Department of Chemical Engineering, Texas A&M Uni¨ersity, College Station, TX 77843, USA Accepted 18 May 2000 Abstract Ž .Phenol degradation with a UVrH O advanced oxidation process AOP was studied in a completely mixed, batch2 2 photolytic reactor. The UV irradiation source was a low-pressure mercury vapor lamp that was axially centered and was immersed in the phenol solution. The effects of hydrogen peroxide dosage, initial phenol concentration, H O rphenol molar ratio, pH, and temperature have been investigated. The experimental results indicate that there2 2 is an optimum H O rphenol molar ratio in the range of 100᎐250. A sufficient amount of hydrogen peroxide was2 2 necessary, but a very high H O concentration inhibited the photoxidation rate. The second-order reaction rate2 2 constants were inversely affected by the initial phenol concentration. No pH effect was observed in the pH range of 4᎐10. A detailed reaction mechanism was proposed. The reaction products include hydroquinones, benzoquinones, and aliphatic carboxylic acids with up to six carbon atoms. A kinetic model, which employs the pseudo-steady state assumption to estimate hydroxyl radical concentration and assumes constant pH was developed to predict phenol oxidation kinetics and product distribution. ᮊ 2000 Elsevier Science Ltd. All rights reserved. Keywords: Ultraviolet radiation; Phenol; Photolysis; Hydrogen peroxide; Photoxidation 1. Introduction Chemical oxidation processes are widely used to treat drinking water, wastewater, and groundwater con- taminated with organic compounds. Direct oxidation of aqueous solutions containing organic contaminants can be performed under a variety of conditions ranging from ambient conditions to supercritical water oxida- tion at very high temperatures and pressures. Oxida- tion at mild conditions by reactive species, such as hydroxyl radicals generated by UV radiation in the U Corresponding author. Tel.: q1-978-845-3375; fax: q1- 978-845-6446. Ž .E-mail address: a-akgerman@tamu.edu A. Akgerman . presence of an oxidant, such as ozone or hydrogen peroxide, is referred to as an advanced oxidation Ž .process AOP . AOPs are attractive alternative tech- nologies for destroying toxic organic contaminants. AOPs are studied in different combinations; ozone with ultraviolet radiation; ozone with hydrogen perox- ide; ozonerhydrogen peroxide with ultraviolet radia- tion; hydrogen peroxide with ultraviolet radiation; and ozone at high pH. Ultraviolet photolysis combined with Ž .hydrogen peroxide UVrH O is one of the most2 2 appropriate AOP technologies for removing toxic or- ganics from water because it may occur in nature itself. This process involves the production of reactive hy- Ž ..droxyl radicals OH that are ultimately capable of mineralizing organic contaminants. This oxidation may Ž .occur via one of three general pathways: 1 hydrogen 1093-0191r00r$ - see front matter ᮊ 2000 Elsevier Science Ltd. All rights reserved. Ž .PII: S 1 0 9 3 - 0 1 9 1 0 0 0 0 0 2 4 - 1
  • 2. ( )R. Alnaizy, A. Akgerman rAd¨ances in En¨ironmental Research 4 2000 233᎐244234 Ž . Ž .abstraction; 2 electron transfer; and 3 radical addi- Ž .tion Masten and Davies, 1994 . Phenols are one of the most abundant pollutants in industrial wastewater, i.e. chemical, petrochemical, paint, textile, pesticide plants, etc. They serve as inter- mediates in the industrial synthesis of products as diverse as adhesives and antiseptics. Chlorinated phenols, which form during chlorination of water, are Žreported to resist biodegradation La Grega et al., .1994 . The objective of this study was to investigate the feasibility of treating phenol contaminated water by the UVrH O process. We performed direct ultraviolet2 2 photolysis, hydrogen peroxide oxidation, and ultraviolet photolysis combined with hydrogen peroxide oxidation of model phenol solutions. We performed experiments at various initial phenol and H O concentrations to2 2 investigate the effects of their initial concentration on the oxidation rates. From the observed phenol, inter- mediates, and final product concentration time profiles, we calculated the rate of each reaction in the proposed mechanism. Finally, we proposed a kinetic model and determined the reaction rate parameters for phenol decomposition. 2. Methodology 2.1. Reactor configuration We performed batch experiments in a 6.5-cm diame- ter cylindrical Pyrex glass jacketed reactor with a total volume of 310 ml. Fig. 1 is a schematic representation of the apparatus used in this study. At the top, the reactor had inlets for feeding reactants, and ports for measuring temperature and withdrawing samples. The reactor was open to air with a magnetic stirrer placed in the bottom to provide proper mixing. The irradiation in the photoreactor was obtained by a low-pressure Ž .mercury lamp PCQ lamp, UVP, Inc. positioned and immersed in the solution in the center of the reactor. The lighted length of the lamp was 63.5 mm with a quartz sleeve diameter of 9.5 mm. A 24᎐40 ground-glass taper joint supported the lamp. It emits approximately 90% of its radiation at 254 nm with a 15-W power input. Typical intensity of the lamp at 4.84 cm2 was 5400 ␮W cmy2 and its body temperature was approxi- Ž .mately 60ЊC Table 1 . Because the light source pro- duces heat, in order to conduct experiments at room or controlled temperatures, the reactor was surrounded with a cooling jacket to maintain a constant tempera- ture. Temperature readings were taken using an Omega digital thermometer with an extended probe that was always immersed in the solution. Table 1 Reactor and light source specifications Reactor specifications Volume 310 ml Diameter 65 mm Material Pyrex glass Reflection factor 1 Light source Lighted length 63.5 mm Quartz diameter 9.5 mm Ž .Radiation )90% 254 nm Power 15 W Body temperature 60 ЊC 2 2 Intensity at 4.84 cm 5400 ␮Wrcm y6 UV radiation addition rate 1.516=10 Erlиs 2.2. Materials Phenol, its expected degradation intermediates, and final products were purchased from Sigma Chemicals unless otherwise stated. The phenol stock solution was prepared by adding an appropriate amount of a reagent-grade 90-wt.% solution to deionized-distilled water to obtain a solution of desired concentration. Hydrogen peroxide stock solution was a reagent-grade 35-wt.% solution used as received. Intermediate ring Ž .compounds such as 1,2-benzenediol catechol , 1,3-ben- Ž . Ž .zenediol resorcinol , 1,4-benzenediol hydroquinone , Fig. 1. Schematic drawing of the apparatus used in this study. 1, reactor; 2, Hg lamp; 3, cooling jacket; 4, temperature measuring inlet; 5, sampling point; 6, magnetic stirrer.
  • 3. ( )R. Alnaizy, A. Akgerman rAd¨ances in En¨ironmental Research 4 2000 233᎐244 235 and p-benzoquinone were G98% pure commercial compounds used as received. O-Benzoquinone was un- available commercially due to its instability. The acids ᎏ muconic, maleic, fumaric, malonic, succinic, oxalic, acetic, and formic ᎏ were )98% pure commercial compounds used as received. The selected intermediate and final organic-acid solutions were prepared by weighing the proper amount to give the desired con- centration in deionized distilled water. We kept these Ž .aqueous solutions refrigerated f5ЊC and none of the substances, except p-benzoquinone, was hydrolyzed Žsignificantly. Solvents i.e. methanol and phosphoric .acid were HPLC grade. The pH of aqueous solutions was adjusted using either sodium hydroxide or hydro- chloric acid where needed. Distilled and deionized water, which was further purified with a Barnstead Ultrapure mixed-bed cartridge, was used in cleaning and experimentation. Compressed helium and nitrogen gas with better than 99.9% purity was obtained from Bob Smith Gas Products Company, Bryan, Texas, USA. 2.3. Experimental procedures For a standard reaction run, 250 ml of aqueous solution was used. It was prepared by adding a prede- termined amount of hydrogen peroxide, as a concen- Ž .trated solution 35 wt.% , to the contaminated water. The initial phenol concentration was in the range of Ž y4 y3 .40᎐500 ppm 4.3=10 ᎐5.3=10 M . High concen- trations were good for easy detection, but they can absorb too much of the UV radiation. The molar ratio of H O to phenol was varied in the range of 0᎐500,2 2 which resulted in H O concentrations up to 0.5 M.2 2 The solution was stirred by a magnetic stirrer at ap- proximately 300 rev. miny1 for 15 min to ensure suffi- cient mixing. It was verified experimentally that hydro- gen peroxide does not self-decay during this period. Turning on the ultraviolet light while continuing mixing under ambient temperature and pressure started the reaction, then, a stopwatch was immediately started. Ž .The reaction was carried out at neutral pH i.e. 6᎐7 except for a few runs to test for pH effects on the reaction rates. Periodically, samples were withdrawn Ž .2.5 ml through the sampling ports using a long hy- podermic stainless steel needle then stored immedi- ately in 20-ml screw-cap glass vials for analyses. Before sampling, pH measurement was taken using a Cole Parmer microcomputer, pH-vision model 05669-20 pH-meter, and electrode. 2.4. Analytical procedures Ž .Total organic carbon TOC analyses were per- formed using an OI Analytical Corporation Model 700 TOC analyzer. Reaction intermediates were identified by a Dionex high-pressure liquid chromatograph Ž . Ž .HPLC using two different columns Supelco . The first column was a general classical reversed-phase, LC-8; 25 cm by 4.6-mm i.d. filled with 5-␮m o.d. parti- Ž .cles on a bonded support silica and had a pore size of ˚120 A. The UV detector was set at 280 nm. The best separation was achieved with a programmed solvent gradient as a mobile phase where the eluent was made less polar as time progressed. It started with a methanolrwater ratio of 1:99, with a flow rate of 1.0 ml miny1 , then to 100% methanol in 20 min, then to the initial ratio in 5 min. The second column was a SU- PELCOGEL-H column for organic acids analysis. The column was 25 cm=4.6 mm i.d., packed with sulfo- nated polystyrene divinylbenzene spherical particles of 9-␮m diameter. The UV detector was set at 210 nm. Separation was based on the ion exclusion method, in which the analytes were selectively partitioned between the resin phase and the external aqueous phase. Analy- ses were performed at low pH with a simple isocratic mode, where the mobile phase composition was main- Ž .tained constant, 1% phosphoric acid H PO with a3 4 flow rate of 0.4 ml miny1 . All columns were operated at room temperature and the injection volume was 100 ␮l. 2.5. Reaction kinetics In developing the reaction kinetics we assumed: 1. no reaction between phenol and its byproducts to Žform higher molecular weight intermediates which .was verified by HPLC ; 2. radiation absorption by any substance other than hydrogen peroxide was negligible; and their oxida- tion rates by UV radiation alone was negligible, Žhence oxidation by UV alone was negligible. At 254 nm the extinction coefficient and quantum yield for phenol are 516 My1 иcmy1 and 0.05 y1 Žmolecule и photon , respectively Dulin et al., .1986 . We neglected direct photolysis of phenol because of its low quantum yield to hydrogen per- oxide and due to experimental verification indicat- .ing negligible photooxidation ; 3. organic and inorganic solutes or impurities did not Žaffect the hydrogen peroxide photolysis rate De .Laat et al., 1994 . Hydrogen peroxide was always present in excess Ž .)40:1 , therefore, the hydrogen peroxide concentra- tion was assumed constant. The direct photolysis rate of hydrogen peroxide is represented by Ž yAt . Ž .r s⌽ f I 1ye 1u¨ H O H O Њ2 2 2 2
  • 4. ( )R. Alnaizy, A. Akgerman rAd¨ances in En¨ironmental Research 4 2000 233᎐244236 where ⌽ is the hydrogen peroxide quantum yield,H O2 2 I is the UV radiation intensity, and f is theo H O2 2 fraction of radiation that is absorbed by H O which,2 2 based on our second assumption, equals unity. The Ž .solution total absorbance A at the UV radiationt Ž .source wavelength ␭ is given by Ž .A (2.303 l ␧ C 2t H O H O2 2 2 2 where A is the absorbance, ␧ and C are theH O H O2 2 2 2 molar extinction coefficient and H O concentration,2 2 respectively, and l is the effective reactor light path Ž .annular . Table 2 shows the reported rate constants for the most widely accepted reaction scheme of hydro- gen peroxide photolysis. The concentrations of both Ž . . .radicals OH and OOH were obtained using the pseudo-steady-state hypothesis, which yields Ž yAt .2⌽ I 1yeH O 02 2.w x Ž .OH s 3ss n .k C qk C q k CÝ2 H O 5 OOH i i2 2 is1 and k C C2 OH H O2 2и. Ž .HO s 42 ss k C qk C4 OOH 5 OHи where k are reaction rate constants where hydroxyli radicals are consumed in phenol and reaction interme- diates and C are phenol and reaction intermediatei concentrations. Ž .In Eq. 3 , the numerator represents the hydrogen peroxide direct photolysis rate, that is the OHи produc- tion rate, and the denominator represents the hydroxyl radicals’ consumption rate by all the identified species. The reaction rate between species i in the postulated mechanism and hydroxyl radicals is represented by dCi Ž .s k C C y k C C 5Ý Ýj j OH i i OHи иdt j i where ⅷ i,j: phenol, identified intermediates and final products; ⅷ k : reaction rate constant where substance i isj formed; and ⅷ k : reaction rate constant where substance i isi consumed. A kinetic model was developed that describes the kinetics of oxidizing phenol-contaminated water by combined ultraviolet radiation and hydrogen peroxide. The steady-state concentration of the OH. radical and parameter estimation of the above equations were ob- tained using the software packages Excel and Simu- solveTM . 3. Results and discussion 3.1. pH effects All phenol advanced oxidation experiments were performed in distilled water solutions. The pH of the solution decreased from 6.5"0.5 to an average of 3.2"0.2 due to formation of acidic intermediates. Other runs were made at higher pH, but the oxidation Ž .rates were independent of pH. De Laat et al. 1994 showed that the efficiencies of UVrH O processes2 2 were not affected by pH below 8, although a decrease Ž .was observed for higher pH. Lipczynska-Kochany 1993 studied phenol oxidation by the UVrH O process and2 2 observed no significant effects in the pH range from 7.0 to 9.0. On the other hand, phenol degradation and catechol formation decreased rapidly when pH-7 and pH)9. This observed decrease was probably due to the fast decomposition of hydroxyl radicals and hydro- Ž .gen peroxide at high pH Christensen et al., 1982 . However, direct photolysis of phenol was accelerated in alkalized solutions due to the increase in ‘phenolate Ž .anions light absorbency’. Beltran et al. 1996 , Stefan et Ž .al. 1996 observed that direct photolysis contributions decreased when pH increased from 2 to 7 and then increased to 60% at pH 12. In addition, they reported that the initial rate of acetone removal was indepen- dent of pH in the range of 2᎐7. At pH 10, the initial Table 2 .Rate constants for OH formation by H O photolysis2 2 Rxn Reaction Reaction rate Source y1 y1Ž .no. constant M иs y6 y1.1 H O qh¨ ª2OH r s1.52=10 Mи s This work2 2 uv 7. . Ž .2 OH qH O ª OOHqH O 2.7=10 Buxton et al. 19882 2 2 . . Ž . Ž .3 OOHqH O ªOH qH OqO 0.5"0.09 Weinstein and Bielski 19792 2 2 2 5. Ž .4 2 OOHªH O qO 8.3=10 Buxton et al. 19882 2 2 9. . Ž .5 OOHqOH ªH OqO 8.0=10 Elliot and Buxton 19922 2
  • 5. ( )R. Alnaizy, A. Akgerman rAd¨ances in En¨ironmental Research 4 2000 233᎐244 237 Fig. 2. Phenol oxidation at various H O rphenol ratios and2 2 constant initial phenol concentration. Experimental condi- tions: Ts27ЊC, C0 s2.23"0.3=10y3 M.Ph rate was inhibited. This was explained in terms of hydrogen peroxide dissociation in alkaline media. Also, the fast reaction of hydroxyl radicals with hydrogen peroxide was responsible for the observed decrease in phenol destruction in acidic media. Consequently, pho- tolysis combined with hydrogen peroxide was most ef- fective in neutral solutions. Based on these findings and because our runs were similarly independent of pH Ž .within the range of 6᎐10 all subsequent runs were Ž .performed in neutral media pH 6᎐7 . 3.2. Phenol oxidation by ultra¨iolet radiation A few runs were performed using ultraviolet radia- tion alone to oxidize phenol in aqueous media in the same reactor. The results of one experiment are shown in Fig. 2 at an initial phenol concentration of 210"10 Ž y3 .ppm 2.23=10 M at 45ЊC. Almost 25% of phenol was oxidized in 1.5 h and more than 45% degradation occurred over a 4-h period due to direct UV photolysis, or hydroxyl radical attack. However, we have also observed that oxidation by UV alone does lead to Žformation of two or more ring compounds Alnaizy, .1999 . 3.3. H O rphenol molar ratio effects2 2 Fig. 2 shows a few runs that were conducted at a constant initial phenol concentration of 210"10 ppm Ž y3 .2.23=10 M . Hydrogen peroxide doses were varied between 5.0=10y3 and 0.5 M to determine the effects of the H O rphenol molar ratio. We have evaluated a2 2 Ž .very wide range of H O rphenol molar ratios 2᎐500 .2 2 Hydrogen peroxide enhanced the photolytic degrada- tion of phenol greatly relative to direct photolysis. However, H O concentrations had two opposing ef-2 2 fects on the reaction rate. Increasing the initial hydro- gen peroxide concentration enhanced the oxidation process up to a certain point at which hydrogen perox- ide started to inhibit the phenol photolytic degradation. At higher hydrogen peroxide concentrations, Reaction Ž . Ž .2 in the H O photolysis mechanism Table 2 be-2 2 came very important and hydrogen peroxide acted as a free-radical scavenger itself, thereby decreasing the hydroxyl radicals concentration. At our operating wavelength and light intensity, we deduced that the optimum H O rphenol molar ratio2 2 was between 100 and 250. At a H O rphenol molar2 2 ratio of 125, more than 95% of phenol was oxidized in Ž .40 min. At higher H O rphenol ratios )300 , hydro-2 2 gen peroxide negatively affected the ultraviolet photo- lytic process despite the higher free-radical production Ž .rate. In agreement with Glaze et al. 1995 , Beltran et Ž .al. 1996 a significant reduction in the degradation rate was observed, which revealed the inhibitory effects of excess H O .2 2 3.4. Initial phenol concentration effects Fig. 3 shows results of other runs conducted at a H O rphenol molar ratio of f200, at 27"2ЊC and2 2 various initial phenol concentrations. At a concentra- Ž y4 .tion of 40 ppm 4.26=10 M , approximately 90% oxidation was achieved in 20 min and complete oxida- tion was achieved in less than 30 min. The photolysis rate decreased significantly when the initial phenol concentration was increased to approximately 500 ppm Ž y3 .5.15=10 M ; only 14% was oxidized over a 30-min period. Most previous authors did not investigate the effects of initial concentration on reaction rates. Nearly all investigators have reported a pseudo-first-order re- Žaction rate for UVrH O oxidation Hong et al., 1966;2 2 Glaze et al., 1995; Scheck and Frimmel, 1995; Stefan et . Ž .al., 1996 . Wei and Wan 1991 studied the photocat- alytic oxidation of phenol in oxygenated solution with suspensions of titanium dioxide powder. They observed that high initial phenol concentrations had a negative effect on the pseudo-first-order reaction rate constant. In other words, phenol photodecomposition decreased with increasing initial phenol concentration. They also observed that the reduction rate of chemical oxygen Ž .demand COD was much slower than the phenol de- Ž .composition rate. In addition, Augugliaro et al. 1988 have reported a negative first-order reaction kinetic for phenol photocatalytic decomposition and the initial phenol concentration had a remarkable inhibitory ef- fect on the apparent rate constant. Although the pseudo-first-order reaction kinetics may give a good approximation over a wide range of concentrations, it does not represent the true rate, because the rate constants depend on the initial concentration. Hence, it was necessary to develop a model that would take
  • 6. ( )R. Alnaizy, A. Akgerman rAd¨ances in En¨ironmental Research 4 2000 233᎐244238 Fig. 3. Phenol oxidation at constant H O rphenol ratiof200,2 2 Ts27ЊC and various initial phenol concentration, C0 sPh 0.43᎐5.2=10y3 M. into consideration this initial concentration depen- dency. 3.5. Temperature effects To determine the effect of temperature on reaction rates, several runs were performed at temperatures between 27 and 45ЊC. Fig. 4 shows results of two runs conducted at a H O rphenol molar ratio of 200 and2 2 Ž y3 initial phenol concentration of f480 ppm 5.2=10 .M . As expected, heating enhanced the oxidation rate significantly: at the higher temperature, more than 90% oxidation occurred vs. less than 30% oxidation for the other, over the same 90-min period. 4. Reaction mechanism We have identified the following reaction intermedi- ates by HPLC analysis: 1,2-dihydroxybenzene Ž . Ž .catechol , 1,3-dihydroxybenzene resorcinol , 1,4-dihy- Fig. 4. Phenol photolytic oxidation at constant H O rphenol2 2 ratiof200, initial phenol concentration, C0 f5.2=10y3 M,Ph and different temperatures. Ž .droxybenzene hydroquinone , 2,5-cyclohexadiene-1,4- dione, muconic acid, maleic acid, fumaric acid, oxalic acid and formic acid. The difference between initial Ž .carbon concentration ts0 and the carbon concentra- Ž .tion at time t was assumed to be the CO concentra-2 tion. This was determined by means of TOC analysis. Most of the products listed above are identical to those Ž .reported by Devlin and Harris 1984 , Scheck and Ž .Frimmel 1995 . The only carboxylic acid that was detected over the entire reaction time was oxalic acid. Ž .However, Devlin and Harris 1984 reported that gly- oxal and glyoxylic acids have the same retention times as oxalic acid and they cannot be separated by HPLC, hence they may also have been present in the oxalic Ž .acid amounts we determined. Ogata et al. 1983 stated that excited molecules of organics often respond dif- ferently than those in ground states and hence photoly- sis is expected to proceed via a different mechanism than wet oxidation. Nevertheless, phenol photolysis in the presence of hydrogen peroxide followed almost the Ž .same path as the Devlin and Harris 1984 mechanism for aqueous phenol oxidation with dissolved oxygen. 4.1. Formation of aromatic intermediates The breakdown of hydrogen peroxide to form hy- droxyl radicals activates the phenol aromatic ring through a strong resonance electron-donating effect. It is well known that this effect is felt most strongly at the ortho and para positions. This fact was confirmed by our results; hydroquinone and catechol appeared in amounts sufficient to quantify, but a very low yield of resorcinol was detected. Resorcinol was present only in trace amounts, F2%, and the catecholrhydroquinone ratio was always greater than unity. Our results agree Ž .with those of Lipczynska-Kochany 1993 who studied flash photolysis of phenol in the presence of hydrogen Žperoxide and concluded that ortho-hydroxylation i.e. .catechol formation was predominant. In our study, these dihydroxybenzenes were produced and observed in the same product distribution under all experimental Ž .conditions. Lipczynska-Kochany 1993 , however, re- ported that hydroquinone was the main primary product of phenol direct photolysis in dilute degassed aqueous solutions. He also detected 1,2,4- and 1,2,3-trihydroxy- Ž .benzene pyrogallol , though this further hydroxylation reaction on the aromatic ring was of minor yield and was not investigated. If this configuration were main- tained in this reaction, that is preferential ortho- hydroxylation, o-benzoquinone formation should tran- scend p-benzoquinone concentrations. However, there was no evidence to support this, from this work or Ž .others, because: 1 benzoquinones, especially ortho, are fairly unstable and are easily cleaved to form Ž .aliphatic compounds; 2 benzoquinones and dihydroxy- benzenes are in redox equilibrium, which may cause
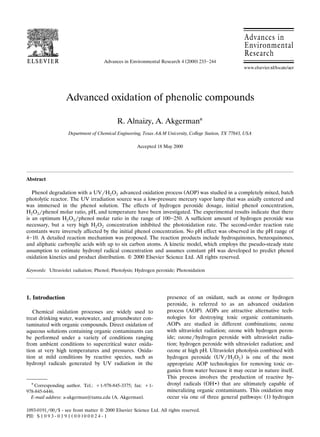
  • 7. ( )R. Alnaizy, A. Akgerman rAd¨ances in En¨ironmental Research 4 2000 233᎐244 239 Fig. 5. Concentration histories of the aromatic intermediates in phenol oxidation by UVrH O . Experimental conditions:2 2 C0 s 5.17 = 10y 3 M; T s 45ЊC; C s 0.245 M;Ph H2 O2 H O rphenol molar ratios47.2 2 Žshifting during sampling and HPLC analysis Scheck . Ž .and Frimmel 1995 ; 3 as mentioned earlier, o-benzo- quinone standards were not available commercially, which prevented us from either confirming its presence or following its concentration vs. time. Typical concen- tration histories of these aromatic substances are shown in Fig. 5. From Fig. 5, it is clear that the ortho-hydroxylation was preferred over the meta or para-substitution. The catechol concentration was approximately 25 times higher than the hydroquinone concentration at the beginning of the reaction and resorcinol was present in a minute amount. In all runs that utilized UV irradia- tion combined with hydrogen peroxide, all three dihy- dric phenols were produced. We also detected p-ben- zoquinone in all runs except in those that were per- formed at low initial phenol concentration. Neither p-benzoquinone nor resorcinol was observed at low initial phenol concentration, because of the faster reac- Ž .tion rate at low initial phenol concentrations Fig. 3 . At low temperatures, keeping all other parameters constant, resorcinol was detected but not p-benzo- quinone. This observation may indicate that p-benzo- quinone decomposition was very rapid when sufficient hydroxyl radicals were present, even at low tempera- tures. 4.2. Formation of carboxylic acids Organic acids were formed and detected as interme- diates andror final products under all conditions. The formation of these acids was consistent with pH changes in all experiments. The aqueous solution initial pH was ;6.8 and within the first 30 min of irradiation, the pH ranged between 4.3 and 4.7. Then slowly over the reaction period, it decreased to approximately 3.2. By means of HPLC analysis using the previously described organic acids column, only five acidic compounds were positively identified. Under all of the experimental con- ditions used in this study, we detected measurable quantities of the following acids: z,z-muconic, maleic and its isomer fumaric, oxalic, and formic acids. The exceptions were the runs conducted at low H O rphe-2 2 nol molar ratio and at high initial phenol concentra- tion. At high initial phenol concentration, formic acid was observed in a very small concentration in discrete samples, hence, no conclusion could be made about its presence. There were five other unknown peaks. They must have been due to carboxylic andror aliphatic acids because they always eluted within the first few minutes of HPLC analysis. In addition, we know that they were not succinic acid, malonic acid, or acetic acid because none of the unidentified peaks matched these acids when previously used to calibrate standards re- tention time. Furthermore, they could not be glyoxal and glyoxylic acids because their responses were re- Ž .ported by Devlin and Harris 1984 to be similar to that Ž .of oxalic acid. Scheck and Frimmel 1995 reported the Žpresence of three muconic isomers Z, Z; E, E; and Z, .E configurations ; we have confirmed the formation of Ž .the first isomer Z, Z but the others were unavailable commercially to prove their presence. The presence of acrylic acids was unlikely because 3-carbon compound formation was not bound to occur. Based on the acid intermediates and products detected, hydroxyl radical attacks on the double bonds of the unsaturated Žmuconic acid formed maleic and fumaric acid 4-carbon . Ž .acid as well as oxalic acid 2-carbon acid . Another route is the cleavage of the 1,4-dihydroxybenzene dou- ble bond after being hydroxylated to form maleic and Ž .oxalic acid Scheck and Frimmel, 1995 . However, De- Ž .vlin and Harris 1984 confirmed that acrylic acids were produced but in very low concentrations under all Ž .conditions e.g. excess oxygen or excess phenol . In any case, these unidentified peaks were readily photoxi- dized and they disappeared as the reaction progressed. Consequently, their quantification was not possible and Fig. 6. Concentration histories of the carboxylic acids, C0 sPh 1.74=10y3 M; Ts45ЊC; C s0.147 M; H O rphenolH2 O2 2 2 molar ratios84.
  • 8. ( )R. Alnaizy, A. Akgerman rAd¨ances in En¨ironmental Research 4 2000 233᎐244240 they were lumped into one term that we called ‘acids’ in the kinetic study. Fig. 6 shows acid concentration histories in UVrH O oxidation runs at 45"2ЊC. Muconic, maleic,2 2 fumaric and oxalic acids appeared within the first 10 min of reaction time whereas formic acid appeared after approximately 30 min of reaction time had elapsed. When the initial phenol concentration was doubled, formic acid was not observed and it took maleic acid almost 4 h to start disappearing, though very slowly. This is another clear indication that the initial phenol concentration inhibits the oxidation rate, which we will discuss in detail in Section 5. Oxalic acid was the main reaction product over the entire reaction time in all runs under all conditions. On the basis of this observation and in order to calculate the molar concentration of the lumped-term acids in the kinetics study, we used the molecular weight of oxalic acid as the average molecular weight of the acids to estimate its concentration. The steady rise and the relatively higher concentrations of maleic and oxalic acid over the first 4 h may confirm the hypothesis of Ž .Scheck and Frimmel 1995 , the cleavage of the 1,4-di- hydroxybenzene double bond after hydroxylation. They postulated that one double bond of benzoquinone may be hydroxylated then cleaved by the oxidation process Ž .yielding maleic acid or its isomer fumaric acid and oxalic acids without going through an intermediate such as muconic acid. This observation would apply more to p-benzoquinone, because the fumaric acid concentration was always much less than that of its isomer maleic acid. ( )4.3. Total organic carbon TOC history Carbon dioxide concentrations were determined by material balances assuming that any unaccounted for Ž .carbon mineralizes to carbon dioxide CO . The rate2 of carbon dioxide formation was calculated by averag- ing both readings from HPLC analysis and the TOC analyzer, then the difference between TOC and the carbon amount that was initially present in phenol resulted in carbon dioxide production. Also, the carbon Ž .in the unidentified intermediates acids was found from the difference between the TOC readings and the carbon that was present in phenol and known interme- diate ring compounds. Fig. 7 shows TOC concentration vs. time for several runs at different initial phenol concentrations and temperature. In a typical run, ap- proximately 10 wt.% of the initial carbon present in phenols was converted to CO in the first hour. How-2 ever, the conversion rate can easily be enhanced by finely tuning the reaction parameters, such as hydrogen peroxide concentration, temperature, and UV light in- tensity. The results of a run that was performed at 45ЊC and a relatively low initial phenol concentration show Fig. 7. Total organic carbon concentration profile for several runs at different phenol initial concentrations and tempera- tures. almost 20 wt.% organic carbon conversion to CO . It2 took approximately 4 h of continuous irradiation in the presence of H O to achieve 70 wt.% conversion of the2 2 Ž .organic carbons to inorganic carbons CO . The rest2 of the organic carbons were mainly found in the form of formic and oxalic acids. 5. Kinetic model For our kinetic study, a simplified reaction pathway for phenol oxidation by UV radiation combined with hydrogen peroxide is depicted in Fig. 8. In this model, all carboxylic acids are lumped together as ‘acids’. Furthermore, because the predominant acid was oxalic acid, we used its molecular weight as an average to estimate the molar concentration of the acids. In addi- tion, we neglected Reaction 3 in the hydrogen peroxide Ž .photolysis mechanism Table 2 , because the reported rate constant is very low. We assumed that hydrogen peroxide concentration remains constant since it was very much in excess. H O decomposes by reaction 12 2 Ž .but forms by reaction 4 Fig. 8 . This assumption was verified by the negligible change in the hydrogen perox- Ž .ide peak area concentration as well. In the kinetics, we assumed second order rates involving the organic species concentration and hydrogen peroxide concen- Ž .tration Fig. 5 . Experimental results showed that phenol oxidation rates depended on hydrogen peroxide concentration and the initial phenol concentration. There was an optimum hydrogen peroxide concentra- tion where the rate was maximum. De Laat et al. Ž .1994 in their UVrH O oxidation study of2 2 chloroethanes in dilute-aqueous solution reported a Ž .similar observation. Nicole et al. 1990 calculated the reactor wall reflection factor, which varied from unity for non-reflecting surfaces to 4.8 for aluminum-foiled quarts reactor walls. In our study, the reactor had
  • 9. ( )R. Alnaizy, A. Akgerman rAd¨ances in En¨ironmental Research 4 2000 233᎐244 241 Fig. 8. A simplified reaction pathway for phenol oxidation by UVrH O .2 2 Ž .non-reflecting walls Pyrex-glass reactor that had a reflection factor of unity. The estimated total absor- Ž .bance of the solution was very high A s15.7 , hencet Ž . Ž yA .in Eq. 3 , the term 1ye and the equation wast reduced to 2⌽ IH O 02 2 .w x Ž .OH s 6ss n .k C qk C q k CÝ2 H O 5 OOH i i2 2 is1 Initial concetrations of hydrogen peroxide and phenol were known, and values of I and l wereo Ž .measured and calculated Table 1 . Based on Baxen- Ž .dale and Wilson 1956 , the primary quantum yield of Ž .hydrogen peroxide ⌽ is 0.49. In the overallH O2 2 Ž .process Reactions 1᎐4 , two hydroxyl radicals are formed per photon absorbed. Hence, the overall value of ⌽ was taken as unity. We used the literatureH O2 2 Žvalues for the reaction constants k , k , and k Table2 4 5 .2 . Initial concentrations of the hydroxyl radical were Ž ..assumed to be zero. The term k C in the de-5 OOH Ž .nominator of Eq. 6 is negligible compared to the other two terms. Ž .Parameter estimation of the variables k is op-i timized, based on how well the model fits a set of experimental observations. SimuSolvTM uses a syste- matic and quantitative method to adjust and optimize k values. It uses the log likelihood functions as thei criterion and either the generalized reduced gradient method or the Nelder᎐Mead search method to adjust the k . Values of the hydroxyl radical concentrationi were substituted into the above equations and concen- trations of phenol, catechol, hydroquinone, resorcinol, benzoquinone, acid, and CO were calculated at time t.2 5.1. Initial phenol and hydrogen peroxide concentration effects ŽFor a given H O concentration range ;50᎐5002 2 .mM , the degradation rate of phenol depends on its initial concentration. At low initial phenol concentra- tion, the reaction rate constant of phenol disappear- Ž . 10 y1 y1 ance k qk qk f1.41=10 M s agrees well6 7 8 Ž .with Apak and Hugul 1996 who reported rate con- stants of phenol photolysis as 1.4=1010 My1 sy1 . However, as the phenol concentration increases, the hydroxyl radical concentration decreases because phenol molecules compete more efficiently with hydro- gen peroxide molecules for the radicals. Doubling the initial phenol concentration from 5.17=10y3 to 1.05= 10y2 M decreased the hydroxyl radical concentration from 1.6=10y11 to 5.5=10y12 M. Hence, the pho- toassisted oxidation rate of phenol decreases. In addi- tion, this suggested that the generated intermediates and the acids become increasingly important scav- engers of hydroxyl radicals. As mentioned before, increasing hydrogen peroxide concentration enhances the oxidation rate up to an optimum H O rphenol molar ratio where hydrogen2 2 peroxide starts to inhibit the degradation process. Therefore, strictly speaking, the hydrogen peroxide dosage does not significantly affect the reaction rate as long as the reaction is performed within the optimized molar ratio. Correspondingly, it is conceivable that the kinetics of photoxidation of organics depend mainly on the initial concentration of the parent organics. Ž . Ž .A plot of ln k vs. ln C demonstrates the inhibi-Ph tory effect of the initial phenol concentration on the Ž .oxidation rates Fig. 9 . This negative dependence of the reaction rate on initial phenol concentration is Ž .correlated in the form of Eq. 7 . Ž . Ž n . Ž .ln k sln a C 7i i Ph0 The above discussion is in agreement with Au- Ž .gugliaro et al. 1988 findings that the pseudo-first-order reaction rate constant is inversely proportional to the Ž .initial phenol concentration. In Eq. 7 , the slope nf Ž .y1 Fig. 9 . The linear relationship was incorporated Ž .with Eq. 6 to give the following ordinary differential Fig. 9. Effect of initial phenol concentration on reaction rate constants of phenol oxidation.
  • 10. ( )R. Alnaizy, A. Akgerman rAd¨ances in En¨ironmental Research 4 2000 233᎐244242 equation network for the kinetic scheme shown in Fig. 8: CdC OHPh и Ž . Ž .s k qk qk C 86 7 8 Phdt CPho CdC OHCatechol и Ž . Ž .s k C yk C 96 Ph 9 catecholdt CPho CdC OHResorcinol и Ž . Ž .s k C yk C 107 Ph 10 Resorcinoldt CPho CdC OHHydroqunione и Ž .s k C yk C8 Ph 11 Hydroquinonedt CPho Ž .11 CdC OHBenzoquinone и Žs k C11 Hydroquinonedt CPho . Ž .yk C 1212 Benzoquinone CdC OHAcid и Žs k C qk C9 Catechol 10 Resorcinoldt CPho . Ž .qk C yk C 1312 Benzoquinone 13 Acid CdC OHCO2 и Ž .s k C 1413 Aciddt CPho The above equations were coupled with the equation Ž .for hydroxyl radical concentration, Eq. 15 . C s.OH ss ¡ ¦ 2⌽ IH O 02 2~ ¥1 w Ž .k C q C k qk qk2 H O Ph 6 7 82 2 CPho¢ §qk C qk C k C9 Catechol 10 Resorcinol 11 Hydroquinone xqk C qk C12 Benzoquinone 13 Acid Ž .15 5.2. Kinetic simulation We solved the above differential equations Eqs. Ž . Ž . TM 8 ᎐ 15 by numerical simulations using the SimuSolv software package. The simulation started by substitut- ing the hydroxyl radicals steady-state concentration Ž . Ž . Ž .C in Eqs. 8 ᎐ 14 . The initial guesses for k.OH i values were obtained from the intercept of the plot of Table 3 Reaction rate constants y1 oŽ . Ž .k s Temperature Ci 27 45 6 7 k 6.51=10 1.05=106 3 5 k 8.33=10 2.24=107 6 6 k 1.27=10 2.76=108 6 6 k 3.31=10 9.53=109 4 7 k 3.83=10 1.14=1010 6 6 k 2.08=10 5.44=1011 5 7 k 1.00=10 4.07=1012 4 6 k 2.23=10 1.00=1013 Ž .rate constants vs. initial phenol concentration, Eq. 7 , and Fig. 9. A suitable solution for reaction rate con- Ž .stants i.e. k through k was found based on the6 13 goodness of fit and the fitted rate constants are pre- sented in Table 3. The predictions of phenol, hydroquinones, benzo- quinones, acids, and CO as a function of time are2 shown in Figs. 10 and 11 by solid curves. Phenol Ždegradation and hydroquinones production e.g. cate- .chol, resorcinol, and hydroquinone were measured Žunder many different conditions e.g. temperature, H O rphenol molar ratio, initial phenol concentration,2 2 .etc. . The predictions are excellent at most operating conditions and detailed results and analysis can be Ž .found in Alnaizy 1999 . The exception was the high- temperature, low initial phenol concentration run. The model over-predicted the reaction rate. To interpret this, it is important to recall that the reaction at low initial phenol concentration proceeds very fast. The phenol concentrations predicted by the model were lower than the observed data. At this relatively low phenol concentration, the estimated steady-state hy- Ž y11 droxyl radical concentration is relatively high ;10 .M , but may not actually be as high as predicted by the model. In other words, the model over-predicted hy- droxyl radical concentration, which in turn resulted in a faster oxidation rate. Predictions of the acids concentration were reason- ably good for most reaction conditions; any deviation from the data was due to lumping all acids together since we could not identify all the acid products and hence could not calibrate the HPLC analysis. The predicted concentration of CO was significantly lower2 than the observed data. The observed values were at least twice those calculated. This discrepancy arises because CO concentrations were not determined very2 accurately. They were implicitly calculated as the dif- ference between the total organic carbon reading from the TOC analyzer and the theoretical amount of or- ganic carbon that was present in the phenol initially. Some of the error is also due to residual carbon dioxide
  • 11. ( )R. Alnaizy, A. Akgerman rAd¨ances in En¨ironmental Research 4 2000 233᎐244 243 Fig. 10. Observed and predicted concentrations of aromatic intermediates for phenol UVrH O oxidation, experimental2 2 conditions: Ts27ЊC; C0 s1.07=10y3 M; C s0.049 M;Ph H2O2 H O rphenol molar ratios45.2 2 in the solutions analyzed, giving artificially high experi- mental values. 6. Conclusions Results indicate that the oxidation rate was exclu- sively due to hydroxyl radical attack when hydrogen peroxide was in excess. It was shown that in the pres- ence of hydrogen peroxide, the photodegradation process significantly increased with respect to UV radi- ation alone. At initial phenol concentrations of approx- imately 200 ppm, phenol completely disappeared in less than 1 h at 27ЊC by the UVrH O process, however,2 2 only approximately 20% of phenol was mineralized to CO and water and the rest was converted to the2 reaction intermediates. There was an optimum oxidant- to-organics ratio for the photoxidation of organic pollu- tants. The optimal values and corresponding molar ratios of hydrogen peroxide to contaminant greatly affected the oxidation rates. In addition, results show Fig. 11. Measured and predicted concentrations of acids and CO . Experimental conditions: Ts27ЊC; C0 s1.74=10y3 2 Ph M; C s0.147 M; H O rphenol ratios84.H2 O2 2 2 that as the initial contaminant concentration increased, the efficiency of the UVrH O AOP decreased.2 2 A free-radical mechanism involving hydroxyl radical reactions with phenol was developed. The first reaction step is the hydroxylation of the aromatic ring to yield hydroquinones, which further oxidize by hydrogen abs- traction to yield benzoquinones. Then, the ben- zoquinone ring is cleaved to form muconic acids, which decompose by .OH to form maleic, fumaric, and oxalic acids. All intermediates formed initially are finally oxi- dized to mainly oxalic and formic acids which are finally destroyed after prolonged oxidation time by conversion to water and CO . Nonetheless, the reac-2 tion time is rather long, more than 2 h, at high initial Ž .phenol concentration )150 ppm . A kinetic model for the advanced oxidation process using UV radiation combined with hydrogen peroxide was developed. Un- like most other kinetic models of UVrH O AOP, the2 2 model does not assume pseudo-first-order kinetics. The model provides a comprehensive understanding of the negative impact of initial phenol concentration on the photoxidation rate. The apparent rate constants were on the order of 107 sy1 at a temperature of 45ЊC and 106 sy1 at 27ЊC. References Apak, R., Hugul, M., 1996. Photoxidation of some mono-, di-, and trichlorophenols in aqueous solution by hydrogen per- oxiderUV combinations. J. Chem. Tech. Biotechnol. 67, 221᎐226. Alnaizy R., 1999. Mechanism and Kinetic Study for the Hy- droxyl Free Radical Mediated Photooxidation of Organic- Contaminated Aqueous Solutions. PhD Dissertation. Texas A&M University. Augugliaro, V., Palmisano, L., Sclafani, A., Minero, C., Pelizzetti, E., 1988. Photocatalytic degradation of phenol in aqueous titanium dioxide dispersions. Toxicol. Environ. Chem. 16, 89᎐90. Baxendale, J.H., Wilson, J.A., 1956. The photolysis of hydro- gen peroxide at high light intensities. J. Trans. Faraday Soc. 53, 344᎐356. Beltran, F.J., Ovejero, G., Rivas, J., 1996. Oxidation of polynu- clear aromatic hydrocarbon in water. 3. UV radiation com- bined with hydrogen peroxide. Ind. Eng. Chem. Res. 35, 883᎐889. Buxton, G.V., Greenstock, C.L., Helman, W.P., Ross, A.B., 1988. Critical review of data constants for reactions of hydrated electrons, hydrogen atoms and hydroxyl radicals in aqueous solutions. J. Phys. Chem. Ref. Data 17, 513᎐586. Christensen, H., Sehested, K., Corfitzen, H., 1982. Reactions of hydroxyl radicals with hydrogen peroxide. J. Phys. Chem. 86, 1588᎐1590. De Laat, J., Tace, E., Dore, M., 1994. Degradation of chloroethanes in dilute aqueous solution by HO rUV.2 Water Res. 28, 2507᎐22519. Devlin, H.R., Harris, I.J., 1984. Mechanism of the oxidation of aqueous phenol with dissolved oxygen. Ind. Eng. Chem. Fundam. 23, 387᎐392.
  • 12. ( )R. Alnaizy, A. Akgerman rAd¨ances in En¨ironmental Research 4 2000 233᎐244244 Dulin, D., Drossman, H., Mill, T., 1986. The products and quantum yields for photolysis of chloroaromatics in water. Environ. Sci. Technol. 20, 72᎐77. Elliot, A.J., Buxton, G.V., 1992. Temperature dependence of the reaction OHqO and OHqHO in water up to2 2 200ЊC. J. Chem. Soc. Faraday Trans. 88, 2465᎐2470. Glaze, W.H., Kang, J., Lay, Y., 1995. Advanced oxidation processes. A kinetic model for the oxidation of 1,2-di- bromo-3-chloropropane in water by the combination of hydrogen peroxide and UV radiation. Ind. Eng. Chem. Res. 34, 2314᎐2323. Hong, A., Zappi, M.E., Kuo, C.H., Hill, D., 1966. Modeling kinetics of illuminated and dark advanced oxidation processes. J. Environ. Eng. 5, 58᎐62. La Grega, M.D., Buckingham, P.L., Evans, J.C., 1994. Haz- ardous Waste Management. McGraw-Hill, New York, NY. Lipczynska-Kochany, E., 1993. Hydrogen peroxide mediated photodegradation of phenol as studied by a flash photoly- sisrHPLC technique. Environ. Pollut. 61, 147᎐152. Masten, S.J., Davies, S.H.R., 1994. The use of ozonation to degrade organic contaminants in wastewater. Environ. Sci. Technol. 28, 180A᎐185A. Nicole, I., De Laat, J., Dore, M., Duguet, J.P., Bonnel, C., 1990. Use of UV radiation in water treatment: measure- ment of photonic flux by hydrogen peroxide actinometry. Water Res. 24, 157᎐168. Ogata, Y., Tomizawa, K., Furuta, K., 1983. The Chemistry of Peroxides. John Wiley, Chichester, UK. Scheck, C.K., Frimmel, F.H., 1995. Degradation of phenol and salicylic acid by ultraviolet radiationrhydrogen peroxideroxygen. Water Res. 29, 2346᎐2352. Stefan, M.I., Hoy, A.R., Bolton, J.R., 1996. Kinetics and mech- anism of the degradation and mineralization of acetone in dilute aqueous solution sensitized by the UV photolysis of hydrogen peroxide. Environ. Sci. Technol. 30, 2382᎐2390. Wei, T.Y., Wan, C.C., 1991. Heterogeneous photocatalytic oxidation of phenol with titanium dioxide powders. Ind. Eng. Chem. Res. 30, 1293᎐1300. Weinstein, J., Bielski, B.H., 1979. Kinetics of the interaction of HO and Oy radicals with hydrogen peroxide. The2 2 Haber᎐Weiss reaction. J. Am. Chem. Soc. 110, 58᎐62.