Teklabz schematics generator

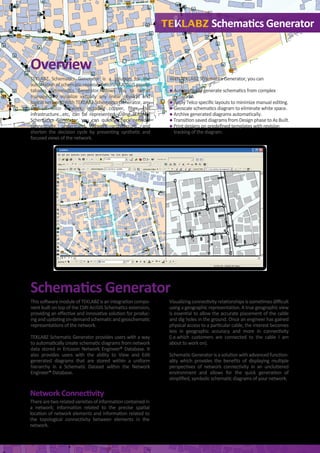
TEKLABZ Schematics Generator is a solution for the telecom network relationships representations used by the different departments. Schematics Generator allows you to better manage and visualize virtually or linear physical and logical networks. With Schematics Generator, any kind of telco network can be represented. Using Schematics Generator, you can quickly check network connectivity, understand network architecture, this speeding up the decision cycle by presenting synthetic and focused views of the network. With TEKLABZ Schematics Generator, you can: 1. Automatically generate schematics from complex networks. 2. Apply Telco specific layouts to minimize manual editing and better elements arrangement. 3. Manage schematic diagrams Geo-scale. 4. Archive generated diagrams automatically. 5. Transition of save diagrams from Design phase to As-Built. 6. Prepare and Print schematic diagrams designs using pre-defined templates with revision tracking.

Recommandé
Recommandé
Contenu connexe
Tendances
Tendances (8)
Similaire à Teklabz schematics generator
Similaire à Teklabz schematics generator (20)
Dernier
Dernier (20)
Teklabz schematics generator
- 1. Overview TEKLABZ Schematics Generator is a solution for the automationofschematicrepresentationsofArcGISgeoda- tabases. Schematics Generator allows you to better manage and visualize virtually any linear physical and logical network. With TEKLABZ Schematics Generator, any kind of telco network, including copper, fiber, civil infrastructure…etc, can be represented. Using TEKLABZ Schematics Generator, you can quickly check network connectivity, understand network architecture, and shorten the decision cycle by presenting synthetic and focused views of the network. This software module of TEKLABZ is an integration compo- nent built on top of the ESRI ArcGIS Schematics extension, providing an effective and innovative solution for produc- ingandupdatingon-demandschematicandgeoschematic representations of the network. TEKLABZ Schematic Generator provides users with a way to automatically create schematic diagrams from network data stored in Ericsson Network Engineer® Database. It also provides users with the ability to View and Edit generated diagrams that are stored within a uniform hierarchy in a Schematic Dataset within the Network Engineer® Database. With TEKLABZ Schematics Generator, you can ● Automatically generate schematics from complex networks. ● Apply Telco specific layouts to minimize manual editing. ● Geoscale schematics diagram to eliminate white space. ● Archive generated diagrams automatically. ● Transition saved diagrams from Design phase to As Built. ● Print designs on predefined templates with revision tracking of the diagram. Therearetworelatedvarietiesofinformationcontainedin a network; information related to the precise spatial location of network elements and information related to the topological connectivity between elements in the network. Visualizingconnectivityrelationshipsissometimesdifficult using a geographic representation. A true geographic view is essential to allow the accurate placement of the cable and dig holes in the ground. Once an engineer has gained physical access to a particular cable, the interest becomes less in geographic accuracy and more in connectivity (i.e.which customers are connected to the cable I am about to work on). Schematic Generator is a solution with advanced function- ality which provides the benefits of displaying multiple perspectives of network connectivity in an uncluttered environment and allows for the quick generation of simplified, symbolic schematic diagrams of your network. Schematics Generator Schematics Generator Network Connectivity
- 2. TEKLABZ Schematic Generator solution illustrates network connectivity through a predefined labeling and symbolic system, in a defined space and without scaling constraints, to help establish the quality and compliance of network data and enhance network analysis. The schematic Generator supports multiple views of network data connectivity, simultaneous representa- tion of geographic and topological relationships, standardized diagram layouts and symbols- allowing for a consistent library of schematic diagrams- custom features selection, diagram editing, archiving, printing and labeling. Telco Schematics Diagram Types Each of the six schematic types provided by the Schematic Generator shows certain details to serve a specific purpose after user selection of data in ArcMap either by attributes, location, tracing or manual selection. Conduit System: - This diagram type shows automatically generated geo-schematic layout of a selected set of the infrastruc- ture network. This diagram type produces schematic diagrams outlining network designs involving Manholes/Handholes, Conduits and Ducts. Schematics Generator Schematics Illustrations
- 3. Conduit System with Cable: - This diagram type produces schematic diagrams outlining network designs involving Manholes/Handholes, Conduits and Ducts as well as the cables passing within conduits cross section views. FTTH Diagram: - This is a special case of the Site Connectivity diagram which deals with the different FTTH network compo- nents. Schematics Generator
- 4. Single Line: - A high level layout of the Telco network connectivity between cables, splices and equipment, along with their associated structures. Site Connectivity: - A low level network connectivity layout down to the port/strand level between equipment, cables and splice closures within a selected area. Copper Distribution Diagram: This diagram type produces schematic diagrams outlining network designs involving Cables, Splices, Equipment and attachments. This diagram will mainly be used for any copper distribution networks between Cabinets and their related Distribution Points. Schematics Generator
- 5. Before running the separation task (three Transmedia lines are collapsed on top of each other) After running the separation task (three Transmedia lines are separated away from each other) SingleLineLayout: Thislayoutextendsthefunctionality of the smart tree layout. It will always try to find a Central Office or a Cabinet (if a CO is not found) and sets it as the tree root and then applies the smart tree layout. It also automatically rotates Equipment/Structure symbols to be perpendicular to the incoming transmedia. Site Connectivity Layout: This layout task exposes several properties helping in automatically laying out the diagram elements, those properties can be accessed by activating the Properties command. Network Geo-Scale Layout: The Network Geo-Scale layout algorithm is used to scale the area that a diagram occupies while maintaining the relative geographic positions of its elements. This is useful for saving space when trying to print large diagram into smaller paper sizes. This layout works best with diagrams containing long lines without much information around them (e.g. long distance cables). Custom Telco Layout Algorithms In addition to "Out of the box" layouts that are provided by Arc Schematics, TEKLABZ have developed special algorithm layouts specificforTelcostosortthelayoutofsomediagramsandautomaticallyplacediagramelementsinareadableandpresentable format. These layouts are: Conduit Cross Section Views Layout: This layout is mainly used for Conduit System Diagram (CSD) and Conduit System with Cable Diagram (CSWC) to provide several options for automatically placing Span Cross Section views near their respective spans, as well as other layout functions tailored towards Structure symbols rotation. The layout properties allow the users to define a number of parameters to control the size and distance of the view away from the span. Cable Arrangements Layout: This layout task will be one of the main layout tasks used with the Conduit System with Cable Diagram and the Copper Distribution Diagram; it provides several options for automatically arranging equipment nodes inside structure containers as well as separate overlapping cables along with other layout functions tailored towards rotating splice closure symbolsandequipmentsymbols.Thislayouttaskexposes properties helping in fine tuning the distances for moving cable links. Schematics Generator
- 6. There are two types of scaling: Absolute scaling which unifies the lengths of the links within the diagram and Relative scaling which applies a ratio/percentage to the diagram The Geo-Scale layout algorithm can be applied on sub network of with the diagram. This technique is very useful indiagramswherethereisacrowdedareaandseveralnot so crowded areas. The sub-network scaling could be used to scale the not-so-crowded areas while keeping the crowded areas unchanged. Refinement Tools Diagram Transition The schematics solution by default saves the diagrams you generate automatically under the correct folder by figuring out from the diagram elements the corresponding value of the governorate name, exchange code and cabinet number. A diagram usually goes through several revisions in terms of fixes to the original data it was generated from as well as the manual edits for the diagram. As long as the diagram is still in the fixes/edits phase, it will be placed in the ‘Current’ sub-folder of its respec- tive location under the governorate, exchange code and cabinet number with the ability to export to multiple file formats. When the design data is finalized and the diagram edits are complete, it is transitioned to ‘In Place’ state indicating that the schematic has been finalized and the network it was generated from is in fact in place. Standardize Diagram Scale This option will allow to uniformly scaling all diagram elements and labels with respect to diagram’s map scale. This is useful when printing schematic diagrams, as it will ensure that all the diagram symbols and labels are the same regardless of what scale the diagram is set at. Archiving System and Tracking Changes Inadditionto"Outofthebox"layoutsthatareprovidedbyArcTEKLABZSchematicsGeneratorcomeswithanorganizedarchiv- ing which is configured to save and archive each diagram into a defined folder hierarchy and a standardized name. This eases the saving process on the user as all folder names, and diagrams are automatically calculated when saving. The archieving system keeps track of diagram historical changes which will be used to embed revision history into the generated diagram output. Schematics Generator
- 7. Managing Schematics Label Each schematic element within the Schematic dataset has been configured with a custom behavior that will allow for managing the labels associated with that element. Label management options defined by this custombehaviorallowsfor:Managingthevisibilityofthe Advanced Trace Tools The tool provides a high level tracing through tracing multiple equipment, transmedia, and/or splices to provide a wider range of selection options than that supported by the COTS Network Engineer. The Splice Closure Trace functionality traces all transme- dia connected to a selected splice closure from the splice closure to all other termination points. The Structure Trace function traces all transmedia connected to a subset of equipment within a selected structure from the equipment to all other termination points. TheTransmediaTracefunctiontracesaselectedtransme- dia (by tracing all transmedia units within the selected transmedia) to its termination point. Schematics Generator 58 Prince Shaker Bin Zayd, Floor 1, Suite 4 P.O.Box 942417 Amman 11194 Jordan t.: +962 (0)6 565 5310 f.: +962 (0)6 565 5311 JORDAN Eastren Ring Road, Exit 16 P.O.Box 272227 Riyadh 111352 K.S.A t.: +966 (0)1 498 3333 f.: +966 (0)1 498 3131 KSA info@teklabz.com sales@teklabz.com INFO TEKLABZ Schematics Generator is a copyright of Technology Labs for Software Industry Ltd. ArcGIS Schematics® is a product owned by ESRI Ericsson Network Engineer is a product owned by Ericsson Restore Original View Scale This option will allow restoring all elements sizes to the standard size defined by the user. This option comes in handy when changes are made around the sizes for a number of the diagram elements and there is a need to reset the changes back to the original scale. Generate Diagram Layout Page This tool allows for generating diagram layouts for printing onto paper or exporting for archiving purposes. The diagram layout will contain the diagram itself as well as the symbol legend and the diagram meta-data which is automaticallygatheredfrominformationrecordedduring the time the diagram was generated. label (show / hide) and Managing the rotation of the labels.