Who benefits from grammar schools? A case study of Buckinghamshire, England
•
2 j'aime•1,260 vues

This is a DRAFT paper and should not be quoted from without the permission of the author. A revised version (but producing substantively similar results) is due for publication in the Oxford Review of Education in April 2013.

Recommandé
Recommandé
Contenu connexe
Tendances
Tendances (19)
Similaire à Who benefits from grammar schools? A case study of Buckinghamshire, England
Similaire à Who benefits from grammar schools? A case study of Buckinghamshire, England (20)
Plus de Rich Harris
Plus de Rich Harris (20)
Dernier
Dernier (20)
Who benefits from grammar schools? A case study of Buckinghamshire, England
- 1. DRAFT PAPER. NOT FOR PUBLICATION, REPRODUCTION OR CITATION. Who benefits from grammar schools? A case study of Buckinghamshire, England Richard Harris and Samuel Rose, School of Geographical Sciences, University of Bristol, University Road, Bristol. BS8 1SS. e-mail: rich.harris@bris.ac.uk 1
- 2. Who benefits from grammar schools? A case study of Buckinghamshire, England Abstract With education policies in England expanding the range of secondary school types available, some commentators have sought to defend and promote the historically older selective system where those pupils who pass an entrance exam are taught in separate schools from others. They do so arguing that selective schools produce higher learning outcomes and aid social mobility by giving some pupils from poorer households an educational opportunity they could not otherwise access. Such a view is contentious; the selective system can also be viewed as socially divisive with no decisive evidence of its educational benefits. However, the evidence tends to be dated, a commentary on the past. Instead, this paper focuses on an education authority where, unusually, the selective system remains. It looks at education data to consider the prevalence of free school meal (FSM) eligible pupils in selective schools, to match pupils of similar prior ability, and to consider whether those who went on to attend a selective school achieved greater success at age sixteen examination. Comparison is also made with outcomes in a neighbouring authority that does not operate a selective system. The results suggest that although pupils in selective schools appear to have greater examination success, this ‘value-added’ comes at a cost to those not in the schools. In addition, the low prevalence of FSM eligible pupils casts doubt on the ability of selective schools to aid social mobility. Key words: education policy, grammar schools, free school meals, Buckinghamshire, selection 2
- 3. Who benefits from grammar schools? A case study of Buckinghamshire In the fifties, a golden age of opportunity, almost 40% of those born to parents in the lowest social income groups grew up to join higher earners. By 1970 and ever since, only one-third achieved this. It cannot be a coincidence that, in between, Harold Wilson’s government abolished grammar schools (Hastings, 2009). 1. Introduction For the last two decades, education policy within England has encouraged a move from a predominantly comprehensive system governed by local authorities to a much more complex system of multiple school types with various subject specialisms and greater private sector, charitable and parental involvement. Given this diversification some commentators have argued in favour of (a return to) an academically selective system whereby the highest attaining pupils – those that pass a set of entrance exams – are taught in separate schools from others. They do so arguing not only for the educational benefits of such a system but also with appeal to social mobility, or rather the apparent lack of it in recent decades. Their claim is that the selecting schools (called grammar schools) allowed the most academically able pupils from the lowest income groups the life chances to move from those groups to other professions instead. Without those schools, it is claimed, the opportunity for social mobility is curtailed. It is, however, a contentious claim that stands (deliberately) against one of the primary reasons most grammar schools were abolished: because they were 3
- 4. seen as elitist, perpetuating social class divides and limiting the educational prospects of the greater number of pupils who did not attend those schools. Whilst various perspectives could be taken for or against grammar schools, many of which would be ideologically and politically informed, what is important is to establish the validity of the argument: do grammar schools improve learning outcomes and do they do so to the benefit of pupils from lower, today, income households? To consider it, the paper focuses on one of the few authorities in England where a selective system of education has been maintained fully: Buckinghamshire, a county adjacent to and to the North West of Greater London. To enter a selective (grammar) school there, a pupil must take a set of entrance examinations in their final year of primary schooling. The best performing pupils will then be offered a place. These examinations, known colloquially as the ‘eleven-plus’, are separate from and taken earlier than the nationally standardised tests of attainment known as the Key Stage 2 tests (KS2) that pupils take shortly before leaving primary school (the Key Stages being periods of education within schools). A data matching methodology is adopted, using data from the National Pupil Database of pupils in state funded schools (see http://www.bris.ac.uk/cmpo/plug/). Balanced samples of pupils of near equal prior attainment at Key Stage 2 are constructed, amongst whom half entered a selective school, half did not. The probability that the pupils achieved five GCSEs at grades A to C is then modelled (with or without English and mathematics). In this way, the paper estimates the average effect of being in a selective school in 4
- 5. Buckinghamshire on the probability of success at the GCSE level. (GCSE is a General Certificate of Secondary Education, usually taken as age sixteen at the end of Key Stage 4). Additional comparisons are made of the selective system of Buckinghamshire with the neighbouring but non-selective authority of Oxfordshire. The results suggest that attendance at a selective school in Buckinghamshire increases the prospect of passing five GCSEs at grades A to C. However, the educational gains to those attending a selective school appear to come at a cost to those unable to do so. In addition, the number of pupils from low income households seems too few to claim that the group benefits from the selective system. The paper begins with a brief history of compulsory secondary education in England and the UK, and a review of previous studies of the social and educational effects of grammar schools. 2. From selective to comprehensive (and back again?) Throughout the 1960s and 1970s, changes were made to the British secondary school system, introducing comprehensive schools as a replacement for the tripartite system of the 1944 Education Act. That Act, also known as the Butler Act, created a national secondary education system of state-funded secondary schools, within which higher and lower academically attaining students were separated into grammar, secondary modern, and technical schools at age eleven (Kerckhoff et al, 1996). (Many grammar schools pre-dated this Act and many were private institutions offering state-supported places to 5
- 6. academically eligible pupils). Under the Butler reforms, the highest attaining quarter or so of children would attend a grammar school, having taken and passed the eleven-plus. Grammar schools would also be the primary route into university education (Pischke and Manning, 2006). Other pupils who failed or did not take the entrance examination would attend a secondary modern or technical college, with less focus on academic achievement and a greater focus on vocational training as preparation to enter work at age fifteen (later sixteen, when the period of compulsory education was extended). Growing dissatisfaction with the tripartite system stemmed from concern that it unfairly determined the life course of pupils based on, essentially, a one shot set of examinations at age eleven. Increasingly the eleven-plus was viewed as an unfair and inaccurate measure of a child’s potential, with studies claiming that even accurate tests misclassified ten per cent of the population (Yates and Pidgeon, 1957). Unequal resource allocations and the resultant inequality of opportunity were questioned, with secondary moderns and technical colleges generally viewed as having less qualified teachers and poorer facilities when compared to grammar schools (Weeks, 1986). Grammar schools were perceived as elitist, not only academically but also in regard to the social background of their intakes, reinforcing class divides (Ford, 1969). There was growing demand for higher-level qualifications to be offered in secondary moderns (Kerckhoff et al, 1996). As one Minister for State at the (then) Department for Education and Science in the Labour Government of the late 1960s has written: The Butler Act took the concept of an academically segregated education system as far as it could go, and did so with dedication and 6
- 7. determination. The technical stream never really got off the ground. Parents preferred their children to go to a grammar school if he or she passed the eleven-plus, and without the necessary pubic support, the money that technical schools needed for qualified teachers and good equipment was not forthcoming. Underlying the stinginess was the old cultural distinction, moulded by the great public schools and the ancient universities that technical and vocational achievements were simply not on a par with the elegance of classical scholarship. […] The eleven-plus system was too rigid to allow for variations in children’s intellectual development, and this was its other great flaw. In theory a child who did well could transfer from a secondary modern to a grammar school. In practice less than 2 per cent of children even did so (Williams, 2010: 52). An alternative system, gaining support during the 1950s and 60s, was a comprehensive system – schools to which all pupils would be admitted (but within which pupils might nevertheless be streamed by ability). This would abandon the eleven-plus exam and even-out the distribution of school resources, motivated by the belief that everyone was of equal worth and equally deserving of help towards personal growth (Kerckhoff et al, 1996). Instead of differentiation between schools, assessments by teachers could be used to move students between higher and lower academic classes within schools (Stevens, 1980). It was hoped that continuous and evolving teacher assessment would 7
- 8. discover the true ability of pupils more effectively than the eleven-plus (Weeks, 1986). The introduction of a comprehensive system was politicised by the Labour party adopting it as a policy initiative in the 1960s (The Labour Party, 1965). His wife reports that the late Labour secretary of state for education, Tony Crossland, wanted to “destroy every fucking grammar school in England” (Collins, 2012: 48). By 1968 there were 748 comprehensives, though a large proportion of students still attended other schools (Benn, 1972). This led Labour to promise legislative action to force the remaining LEAs into comprehensive systems in 1969. However, this centralised approach united conservatives against the bill. Having won the 1970 election, the Conservative Government’s Secretary of Education and Science, Margret Thatcher, withdrew previous policy guidance, though the momentum was such that a considerable number of comprehensives were nevertheless created. After the 1976 election, Labour again tried to force change but Thatcher’s government in 1979 blocked it, repealing previous education acts and removing comprehensive education as a national policy. Since then, local interests rather than government pressure have dictated educational policy (Pischke and Manning, 2006). The legacy of these swings in policy has been a patchwork of educational systems in England. Currently, the vast majority of schools are comprehensive but there remain 164 state-funded grammar schools in all regions of the country, except the North East (see Crooke et al, 1999 and http://bit.ly/eGWGJf). More recently, legislation beginning with the Conservative government’s 1988 Education Act and extended under both New Labour (1997-2010) and the 8
- 9. current Coalition government has acted to increase the complexity of the education system with an expanding array of school types now present, including community schools, trusts, academies, federations, faith schools, specialist schools and, most recently, free schools. The motivation for this change has been the desire to restructure the sector to promote choice and competition, to attract private and third-sector funding and expertise, to shift decision-making, governance and budget management away from local education authorities to schools and parents, and (it is hoped) to raise standards. The Coalition have altered Labour’s flagship Academy program, originally a targeted programme for investment in schools located in the most deprived neighbourhoods, to instead be a means to grant greater freedom and independence for the highest performing schools (those with the best inspection reports); permitting those schools to opt out from the budgetary control of the local education authority (The Conservatives, 2010). Academy status also gives a school the ability to set its own admissions criteria, including the possibility of selecting some pupils based on aptitude for a particular subject. Education policy no longer advocates a single type of school as comprehensively suitable for all pupils. Quite the reverse: it seeks to diversify provision. However, it is never the case that a pupil or their parent can expect a right of admission into any school they choose. The reason is that many of the most popular schools are over-subscribed; their supply of places exceeds demand for them. When this happens, admissions criteria must be used, often giving preference to pupils who live nearest the school (a criterion used for most 9
- 10. schools), to those who have affiliation to a particular faith group (used for faith schools) and/or who can demonstrate the require aptitude (some academies). To some commentators what recent policies amount to is an attempt to reintroduce or increase selective admissions (Galindo-Rueda and Vignoles, 2005b). Yet to others, notably in some parts of the more right-wing media, they stop short of what would be perceived as more socially desirable: an explicit return to the grammar school system. 3. Previous studies The arguments advanced in favour of grammar schools are not just that they produce higher educational outcomes but – critically – they do so for academically able pupils from socially disadvantaged backgrounds, providing those pupils with increased opportunities and prospects for life. The issue is one of social mobility, with the accusation that the general abandonment of grammar schools has made it harder for the less privileged to find a social ladder our of that disadvantage. For example, the Daily Telegraph newspaper recently criticised David Cameron for lacking “the will to admit that grammar schools did more for working-class children than a thousand free school meals” (Randall, 2009). In a television documentary (Posh and Posher: Why Public School Boys Run Britain, first broadcast on BBC2 in January 2011), the broadcaster and political commentator Andrew Neal argued that with the (near) demise of grammar schools, a largely private school educated generation is dominating politics. (Half of the Coalition Cabinet ministers attended a private, fee-charging school, compared to seven per cent of all pupils in the UK). Alleged poorer 10
- 11. teaching, a diminished learning ethos, and lower teaching expectations within comprehensives have been cited as reasons why social mobility has reduced (though, whether it has, it itself disputed: Goldthorpe and Jackson, 2007; Goldthorpe and Mills, 2008; Gorard, 2008). However, the empirical evidence is mixed as to whether grammar schools do indeed improve learning outcomes, and whether they do so for those from less advantaged backgrounds, thereby offering the prospect of greater social mobility. Steedman (1980) presented one of the first attempts to evaluate statistically aspects of educational progress in selective and non-selective secondary schools in England. Her research used the National Child Development Study, a longitudinal dataset of individuals born between 3rd and 9th March 1958, with data sweep questionnaires at ages 0, 7, 11, 16, 20, 23, and 33 focusing on education, employment, family, and health matters (Crooke et al, 1999). Steedman’s work used the age sixteen sweep to find that pupils who entered comprehensive schools aged eleven were disadvantaged in regard to their reading and mathematics abilities, and tended to be from lower social economic status groups. Using multivariate analysis to account for this disadvantage, Steedman showed the rates pupils advanced in selective and comprehensive systems were not statistically different. Subsequent extensions of the study struggled to draw conclusions for more specific subgroups of pupils due to the small number of pupils in each category (Steedman, 1983). Marks et al. (1983) used examination results for comprehensive and selective schools in England to study differences at the aggregate level of the local education authority. Using multiple regression analysis to control for socio- 11
- 12. economic status and non-British ethnicities, they concluded that comprehensives underperformed relative to grammar schools. Their study received criticism from other authors for not adequately controlling for the social class intakes of the schools in each authority and ignoring measures of social advantage (Clifford and Heath, 1984). The results of a follow-up study (Marks and Pomian-Szrednicki, 1985) mirrored the original, showing that pupils in selective schools attain more and higher passes than those in comprehensives. Gray et al (1983) carried out a postal survey of pupil leavers in Scotland to then consider the differences between local authorities without grammar schools and those where such schools were still active. They found comprehensive systems had a levelling effect on attainment, raising fewer pupils to the highest levels but raising the average attainment. They also found lower levels of social class inequality in the authorities with a comprehensive system. Building on the study, McPherson and Willms (1987) concluded that once comprehensive schools had been established in Scotland, they contributed to a rise in educational achievement and diminished the influence of social class factors in education. Instead of drawing inferences from aggregate data, Kerckhoff et al (1996) returned to using the National Child Development Study (NCDS) and individual level multiple regression analysis to compare students in comprehensive and selective systems. Accounting for socio-economic status (SES) and prior academic achievement they found that the highest ability students performed at higher levels in selective systems and low ability students performed better in 12
- 13. comprehensive systems. However, for most students the type of school has little effect. Galindo-Rueda and Vignole’s (2005a) used cogitative ability as a proxy for academic potential with the NCDS dataset and accounted for pupil, school, and community factors. They claimed comprehensive schools reduced the gap in educational achievement between the most able and least able students but on average most pupils in the selective system do better than those in mixed ability schools. Crucially, the SES of the pupil is a key determinant of learning outcomes, with the housing markets or ‘selection by mortgage’ usurping the eleven-plus examination as a determinant of educational success. Boliver and Swift (2011) also use the NCDS data; to investigate how schooling systems affected class and income mobility. They used Propensity Score Matching (PSM) to match pupils in a selective system with pupils with similar characteristics in a comprehensive system. They concluded that going to a grammar school did not make children from lower SES backgrounds more likely to be upwardly mobile in terms of income or class. Indeed, as a whole, the selective system does not yield any mobility advantage to children of poorer backgrounds. Any assistance to children of lower SES attending grammar schools is cancelled by the hindrance to those remaining at secondary moderns. An alternative to using either local authority aggregated data or the NCDS data is Jesson’s (2000) use of data from a National Data Collection Exercise conducted on behalf of the (then) Department for Education and Employment in the mid 1990s to compare the value-added of selective and comprehensive systems. Jesson concludes that there is no support for the claim that selective 13
- 14. education systems provide better GCSE examination performance than comprehensives. In fact, he goes as far to say that comprehensives are delivering education that is as good as selective systems, if not better, and that those selective systems with the majority of pupils in secondary moderns perform less well overall. In summary, the notion that selective systems of education produce better learning outcomes is disputed. Moreover, even if grammar schools do raise educational success, at heart is the issue of for whom those learning outcomes are realised. Whilst grammar schools may lead to higher attainment for pupils who are successful in entering them, the concern is that this comes at the price of depressing the average attainment for other pupils. In other words, the value- added for some pupils comes at a loss to others, amongst whom lower income groups will be disproportionately present. Whether this is true or not, the overwhelming majority of studies are reliant either on aggregate data, not on actual individual learning outcomes, or on data that were collected during the 1960s and 1970s. There is therefore opportunity to update our understanding of the effects of a selective system to consider the present day. 4. A case study of Buckinghamshire The argument favouring a selective system benefits from two conditions being demonstrated empirically. First, that there is a value-added learning outcome for an academically able pupil attending a grammar school over and above what would occur if that pupil had attended a comprehensive school. Such an effect could be due more to, say, 14
- 15. differential resourcing than the benefit of being in some ‘higher level’ learning community (more wealthy parent associations affording great facilities and opportunities for the children, for example). However, if there is no evidence of improved outcomes then there is no obvious basis to claim grammar schools enhance learning. Second, that academically able pupils from more deprived or socially excluded backgrounds have no lower propensity to be admitted to a selective school than equally able pupils from more advantaged backgrounds. Finding this to be true is not itself a defence of grammar schools necessarily. It could be argued that a better ideal is for the proportion of pupils in selective schools who are from more disadvantaged backgrounds to be equal to the proportion of all such pupils in the school age population. Nevertheless, if it were found that even the most academically able pupils from the least wealthy backgrounds are under-represented amongst those who attend grammar schools then the claim that such schools foster social mobility would be disputed. Our study looks at whether these conditions are met in one of the few British authorities still operating a grammar school system: Buckinghamshire. It considers the educational attainment of 11 746 pupils who took their GCSE (Key Stage 4) examinations in any one of the academic years 2006-7, 2007-8 or 2008- 9. These are pupils who attended any one of 32 secondary modern or grammar schools in Buckinghamshire but not either of two non-selective faith schools (which are omitted from the analysis as unusual in Buckinghamshire). Pupils with a statement of educational need also are omitted, as are pupils who did not stay in the same school from the first year of secondary education to the taking 15
- 16. of their GCSE exams. The study, therefore, is of all pupils that entered any one of the most typical school types in Buckinghamshire, stayed in that school throughout their period of compulsory secondary education, and did not have any distinct educational need. Of the 32 schools, thirteen are academically selective, as Table 1 records. The mean prior attainment score of pupils in those selective schools is 1.365 standard deviations greater than the mean for non-selecting schools. Prior attainment here is measured by the combined Key Stage 2 tests (taken prior to leaving primary school but after the eleven-plus for those who sit the latter), scaled to give a mean of zero and a standard deviation of one across all the 11 746 pupils. (The combined score is a summary of three separate measures of attainment in science, mathematics and English: see Figure 1 below). Table 1 also shows that the proportion of pupils passing any five GCSE examinations with a grade C or above is 1.507 times greater in the selective schools relative to the non-selecting ones. This difference in attainment increases when those who have passed with both mathematics and English is considered. The proportion in selective schools is 1.988 times greater. Both measures of attainment by GCSE are crude measures of academic success but widely used and published in ‘league tables’ of school performance. 16
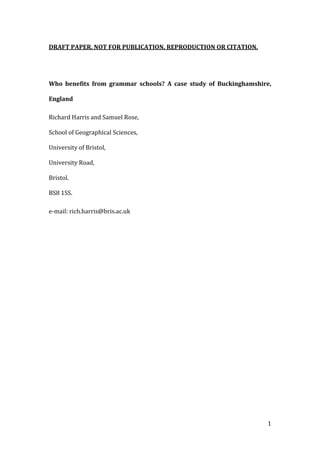
- 17. Non-selecting Selective schools schools Number of pupils 6723 5023 Number of schools 19 13 Mean prior attainment score: KS2 combined scores -0.584 0.781 (95% confidence interval) (-0.605, -0.563) (0.766, 0.796) Proportion of pupils attaining any 5 GCSEs 0.661 0.996 at grade A to C Proportion of pupils attaining 5 GCSEs at A to C, 0.499 0.992 including English and Maths Proportion of pupils free school meal eligible 0.075 0.010 Table 1. Showing the numbers of pupils in non-selecting and selective secondary schools in the Buckinghamshire data sample, their mean prior attainment score, the proportion passing five GCSEs at grade A to C (any GCSEs and inclusive of English and maths), and the proportion eligible for free school meals. Of course, the better average GCSE performance of pupils in selective schools is not surprising given they recruit pupils of higher average prior attainment, a consequence of having entrance exams. Another consequence of this selection process is that they recruit few pupils that are eligible for free school meals, an indicator of the pupil living in a lower income household. Of the 11 746 Buckinghamshire pupils, 555 are FSM eligible and, of those, only 48 attend a selective school (less than ten per cent). That is because those pupils face an educational barrier to entry: the average prior attainment (KS2) score of the FSM eligible pupils is -0.275 standard deviations below the mean, compared to an average of 0.516 above for a pupil who isn’t eligible (a difference that gives a two-sample t score of 21.9, significant at a 99.9 per cent confidence). Despite the selection process, there is some overlap in the prior attainment scores of those who did relatively well and went to a selective school and those who did comparably well but went to a non-selecting school. Figure 1 reveals 17
- 18. this graphically, showing density estimations of the distributions of the prior attainment scores for entrants into the two types of Buckinghamshire school in our data. Four measures of prior attainment are shown: Key Stage 2 performance in English; KS2 in mathematics; KS2 in science; and then the same combined score used in Table 1. On all these metrics, the mean prior attainment is greater for pupils in selective schools (and always significantly so at a 99.9 per cent confidence) but there is some degree of overlap nevertheless. Figure 1. Showing the distribution of the Key Stage 2 results for pupils in Buckinghamshire schools. The mean attainment for selecting and non-selecting 18
- 19. schools is shown as a circle. There are always significant differences between the two but a degree of overlap remains. Data matching The overlaps in attainment shown in Figure 1 can be exploited to create a balanced sample of pupils amongst whom half attended a selective school and half a non-selecting school. A subset of data is taken of pupils found in the overlap between the minimum combined KS2 result of a pupil in a selective school and the maximum result of a pupil in a non-selecting school. Having done so, pupils in the one type of school are paired individually with a pupil in the other type, where the match seeks to minimise the differences in their scores on the three remaining metrics, prior attainment in English, mathematics and science. In total, 3438 pupils are matched in this way (giving 1719 pairs). The Pearson correlation between the English scores of the pupils in selective schools and their pair in non-selecting schools is r = 0.994. The correlation for the mathematics scores is r = 0.989, and for the science scores it is r = 0.991. The mean and median difference in attainment averaged across the three metrics is 0.046 and 0.033 standard deviations, respectively, and the maximum difference permitted (by choice) was set to an average of 0.250. Checking against their combined Key Stage 2 result, no significant difference is found for the two groups. Both have a mean between 0.330 and 0.332, a median between 0.354 and 0.359, a standard deviation between 0.437 and 0.439, a minimum score between -1.72 and -1.77, and a maximum between 2.50 and 2.60. The two groups of pupils are very closely balanced in regard to their attainment on 19
- 20. departure from primary school but one group attends a selective school, and the other does not. Data modelling Having matched the data, logistic regression is used to model the probability the pupils in the balanced sample successfully passed five GCSEs at grade A to C (first for any five GCSEs and then inclusive of English and maths), conditional on the pupils’ prior attainment and personal characteristics. The observed (not modelled) proportion of pupils achieving any five GCSEs at grade A to C is high for both groups but higher for selective schools at p = 0.992, compared to p = 0.902 for non-selecting schools, giving odds ratios of success of 131 and 9.23, respectively. (The odds ratio is p / (1 – p) and is high because few of the pupils, especially in the selective schools, do not achieve at the level). The proportion passing five GCSEs at grade A to C with English and maths also is greater for selective schools than non-selecting ones: p = 0.981 Vs p = 0.814, giving odds ratios of 52.7 and 4.39. These differences lead to modelled probabilities of success that are significantly greater for pupils in selective schools at a 99.9 per cent confidence: see Table 2. The odds ratio of success in passing any five GCSEs at grade A to C is 13.5 times greater for pupils in selective schools, versus pupils who are not; 12.1 times greater when English and maths are included. This, to emphasise, is not because the pupils in the data sample who are in the selective schools have higher prior attainment. They do not. They are matched to pupils of near equal prior attainment in non-selecting schools. The model also includes the pupils’ combined Key Stage 2 as a predictive 20
- 21. variable, with pupils with a higher combined test score on leaving primary school more probably achieving the five GCSEs at grades A to C, true whether or not English and maths are included. Looking at Table 2, whilst prior attainment is a determinant of success at GCSE, there is no evidence that it has greater or lesser effect dependent upon the school type (the interaction term yields no significant effect). Being in a selective school raises the probability of success, as does higher prior attainment but there is no joint effect. The model shows that female pupils will more probably achieve the five GCSEs at grades A to C. The odds ratio of success is 1.74 times greater for females than for males to pass any five GCSEs at grade A to C, and 1.63 greater when English and maths are included. There is no evidence that older pupils in the sample do better than other pupils, at least, not over-and-above what is expected given their prior attainment. (Older pupils, those born in September or October, have a higher average prior attainment with a mean combined score of 0.402, significantly greater than the mean for younger pupils of 0.316: t = 4.46, p < 0.001). With the exception of Pakistani pupils for whom the greater probability of success with English and maths is significant, there is no evidence that the probabilities vary by ethnicity. However, with 83.2 per cent of the sample classed as White British, the number of pupils in other ethnic groups is low: 97 Indians, 127 Pakistani, 22 Black Caribbean and 333 of various other minority groups (wherein the number of any specific group is few). 21
- 22. The national trend for increased examination success is reflected in the achievements of the Buckinghamshire pupils. The probability of success rose in the year 2008 compared to 2007, rising again in 2009 (although the increase in 2008 of passing with English and maths is not significant). Within the sample, the reduced probability of success at achieving any five GCSEs at grade A to C is of borderline significance for FSM pupils (but nevertheless not significant at any conventional level of confidence). There are, however, only 92 FSM eligible pupils in the matched data. Of these, just 24 (26.1%) attend a selective school. The expected value is 50 per cent (because half the pupils in the matched data set are in selective schools). This, using a binomial test, is a significant difference, at a 99.9 per cent confidence. Because there are so few FSM eligible pupils in selective schools the otherwise potentially interesting interaction term giving the joint effect of both FSM eligibility and being in a selective school in GCSE success is omitted. Table 3 repeats the regression analysis but now weighting the sample observations from 0.197 to 1.18 where the weight is linearly proportional to how closely each observation is matched to its pair and where the sum of weights is equal to the total number of observations in the matched sample (3438). The results are substantively the same as for the unweighted regression but weighting gives a slightly better model fit (the AIC value is less) and there is now a significant negative effect associated with FSM eligibility on successfully passing any five GCSEs at grade A to C. 22
- 23. Any five GCSEs Five include English and maths Estimate s.e. z value P (> |z|) Estimate s.e. z value P (> |z|) (Intercept) 1.313 0.151 8.697 <0.001 * 0.633 0.124 5.119 <0.001 * In a selective school 2.605 0.300 8.669 <0.001 * (13.5) 2.491 0.199 12.491 <0.001 * (12.1) FSM eligible -0.670 0.379 -1.766 0.077 -0.298 0.330 -0.905 0.365 Female 0.556 0.170 3.278 0.001 * (1.74) 0.489 0.126 3.879 <0.001 * (1.63) Oldest in class -0.172 0.204 -0.841 0.400 -0.244 0.154 -1.583 0.113 Indian 0.954 1.038 0.919 0.358 0.730 0.629 1.161 0.246 Pakistani 0.828 0.529 1.565 0.118 0.984 0.426 2.311 0.021 * (2.68) Black Caribbean -0.291 0.824 -0.353 0.724 0.434 0.813 0.534 0.594 Other ethnicity (except White British) -0.431 0.266 -1.620 0.105 -0.391 0.207 -1.885 0.059 Prior attainment: Combined KS2 score 2.042 0.202 10.123 <0.001 * 1.915 0.165 11.614 <0.001 * GCSE year: 2008 (Vs 2007) 0.447 0.186 2.405 0.016 * (1.56) 0.171 0.140 1.223 0.221 GCSE year: 2009 (Vs 2007) 1.000 0.230 4.343 <0.001 * (2.72) 0.818 0.171 4.787 <0.001 * (2.27) Combined KS2 score Selective school 0.011 0.548 0.021 0.983 0.259 0.393 0.659 0.510 (AIC) 1116 1767 Table 2. Logistic regression modelling the probability of passing five GCSEs at grade A to C (any GCSE or with English and mathematics), dependent on the characteristics of the pupils and whether the school is selective, relative to not being so. The pupils in the selective schools have a greater probability of success. (*Significant at 95% confidence or above. The odds ratio also is given for significant binary variables) 23
- 24. Any five GCSEs Five include English and maths Estimate s.e. z value P (> |z|) Estimate s.e. z value P (> |z|) (Intercept) 1.298 0.152 8.530 <0.001 * 0.632 0.125 5.065 <0.001 * In a selective school 2.613 0.304 8.602 <0.001 * (13.6) 2.446 0.198 12.366 <0.001 * (11.5) FSM eligible -0.747 0.382 -1.957 0.050 * (2.11)-1 -0.387 0.331 -1.170 0.242 Female 0.541 0.171 3.170 0.002 * (1.72) 0.491 0.127 3.856 0.000 * (1.47) Oldest in class -0.171 0.206 -0.831 0.406 -0.263 0.155 -1.699 0.089 Indian 1.589 1.377 1.154 0.249 0.885 0.655 1.351 0.177 Pakistani 1.105 0.579 1.909 0.056 1.152 0.449 2.567 0.010 * (3.16) Black Caribbean -0.322 0.815 -0.396 0.692 0.405 0.804 0.504 0.614 Other ethnicity (except White British) -0.435 0.268 -1.625 0.104 -0.332 0.211 -1.570 0.116 Combined KS2 score 2.100 0.205 10.254 <0.001 * 2.000 0.167 11.948 <0.001 * GCSE year: 2008 (Vs 2007) 0.499 0.187 2.664 0.008 0.173 0.140 1.231 0.218 GCSE year: 2009 (Vs 2007) 1.024 0.236 4.336 0.000 * (2.78) 0.842 0.176 4.785 0.000 * (2.32) Combined KS2 score Selective school -0.095 0.582 -0.164 0.870 0.159 0.402 0.397 0.692 (AIC) 1070 1701 Table 3. Repeating the analysis of Table 2 but weighting according to how closely each pupil is matched to her or his pair. The results are substantively the same but FSM eligibility now has a significant negative effect on success. (*Significant at 95% confidence or above. The odds ratio also is given for significant binary variables) 24
- 25. Considering FSM eligible pupils further, there are 444 FSM such pupils that have a Key Stage 2 combined prior attainment score within the overlap of scores for pupils in selective schools and those of pupils in non-selecting schools. Not all of these 444 are in the matched sample; indeed, most aren’t. That is because, within the overlap, the FSM pupils have lower prior attainment on average, making them harder to match: -0.545 for English at KS2 versus 0.139 (for ineligible pupils); -0.465 Vs 0.142 for mathematics; and -0.504 Vs 0.153 for science. An apparent consequence of their lower attainment is that of the 444 FSM eligible pupils, only 10.8 per cent attend a selective school. In contrast, of the 10 636 ineligible pupils within the same overlap, 46.7 per cent attend a selective school, meaning they are four times more likely to do so. However, the difference is only partly explained by the higher prior attainment of the students not eligible for free school meals. Figure 2 gives the proportion of students that went to a selective school given their combined KS2 score result and whether they are FSM eligible or not. The range of scores is from the minimum of any pupil attending a selective school to the maximum for a FSM eligible pupil. Even given the error bars (which are greater for the FSM eligible pupils because they are fewer in number) the trend is of a decreased likelihood to attend a selective school amongst FSM eligible pupils when compared to ineligible pupils of comparable prior attainment. This unevenness is a concern, not least because FSM eligible pupils who do attend a selective school appear to benefit from it insofar as a greater proportion achieves success at GCSE than do FSM eligible students who are in the non- selecting schools. Within the matched data sample, p = 0.958 of FSM eligible 25
- 26. pupils in selective schools achieved any five GCSES at grade A to C, versus p = 0.838 for the eligible pupils in non-selecting schools. With English and maths included, the values are p = 0.958 Vs p = 0.779. These values for the FSM eligible pupils in selective schools are comparable though lower than the proportions for the matched pupils who also are in selective schools but not eligible for free school meals. For this group the proportions are p = 0.993 for any five GCSEs and p = 0.982 for with English and maths. Figure 2. Showing the proportion of pupils who attended a selective school given their combined KS2 score. The 95 per cent confidence interval also is shown. The 26
- 27. class breaks are those found using the Jenks (natural breaks) classification of the combined KS2 score distribution for the free school meal eligible pupils. 5. Discussion and comparison with Oxfordshire The results of our data analysis suggest two conclusions. First, that there are educational barriers to entry into Buckinghamshire’s grammar schools for pupils from lower income households insofar as that is evidenced by eligibility for a free school meal (and without a statement of educational need), and by the prevalence of this group in the grammar schools relative to other pupils. Second, that there is an educational advantage bestowed on those who attend a selective school in Buckinghamshire (FSM eligible or otherwise) relative to those who do not, insofar as that advantage is measured by increased probability of attaining five GCSEs (inclusive or not of English and mathematics) at grade A to C, controlling for prior achievement at Key Stage 2. What is not known is how the difference in attainment is created. It could be that the selective system acts to raise (to give value-added to) the educational achievements of those pupils in the selective schools. Alternatively, it could be that the prospects of pupils who are not in selective schools are curtailed. To address whether the selective system comes at a cost to some pupils, two further data matchings are undertaken. The first is of the Buckinghamshire pupils who attended a selective school with pupils of similar prior attainment in the neighbouring authority of Oxfordshire, which does not operate a selective system. In total, 6988 pupils are matched in this way and closely so. The 27
- 28. correlations for the pairs of KS2 scores in English, mathematics and science are r = 0.993, r = 0.998 and r = 0.989, respectively. The second is of Buckinghamshire pupils who did not attend a selective school but who had a combined Key Stage 2 score greater than the minimum amongst those who did attend a selective school, also matched to pupils of similar prior attainment in Oxfordshire. Again, the pupils closely are matched. The correlations in their KS2 English, mathematics and science scores are all r = 0.993. In total, 11 326 pupils are matched. Having made the matches, the probability of success at GCSE is modelled in the same way as previously (and with weighting) but now comparing pupils in a selective system with pupils in a neighbouring non-selective one. Tables 4 and 5 give the results. They show that the probability of passing any five GCSEs at grades A to C is significantly greater for the sample of pupils in Buckinghamshire’s selective schools than for pupils of similar prior attainment in Oxfordshire (Table 4). However, this apparent value-added of the selective system appears to come at a cost to those pupils who might have, in principle, attended a selective school in Buckinghamshire but actually went to a non- selecting one. Those pupils do significantly less well (in Buckinghamshire’s schools) than do pupils of similar prior attainment in Oxfordshire (Table 5). Looking at the odds ratios, it may be argued that the increased prospect of success in Buckinghamshire’s selective schools is greater than the diminished prospect in its non-selecting schools, the selective system therefore yielding a net gain. But, whatever the merits of such an argument, it remains a system of winners and losers. 28
- 29. Any five GCSEs Five include English and maths Estimate s.e. z value P (> |z|) Estimate s.e. z value P (> |z|) (Intercept) 0.012 0.200 0.061 0.951 -0.754 0.174 -4.347 <0.001 * In a Bucks school (Vs Oxford) 2.607 0.427 6.104 <0.001 * (13.6) 2.427 0.308 7.893 <0.001 * (11.3) FSM eligible -1.093 0.416 -2.626 0.009 * (2.98)-1 -1.171 0.348 -3.365 0.001 * (3.22)-1 Female 0.597 0.173 3.448 0.001 * (1.82) 0.543 0.131 4.148 <0.001 * (1.72) Oldest in class -0.147 0.221 -0.666 0.506 -0.277 0.164 -1.682 0.093 Pakistani 0.613 0.857 0.716 0.474 1.022 0.677 1.509 0.131 Combined KS2 score 3.265 0.229 14.241 <0.001 * 3.567 0.197 18.144 <0.001 * GCSE year: 2008 (Vs 2007) 0.524 0.187 2.808 0.005 * (1.69) 0.137 0.139 0.984 0.325 GCSE year: 2009 (Vs 2007) 0.977 0.250 3.915 0.000 * (2.66) 0.924 0.195 4.746 <0.001 * (2.52) Bucks school Combined KS2 score -0.671 0.560 -1.197 0.231 -0.547 0.419 -1.305 0.192 (AIC) 1184 1829 Table 4. Logistic regression modelling the probability of passing five GCSEs at grade A to C, comparing pupils in Buckinghamshire’s selective schools with pupils of similar prior attainment in Oxfordshire’s school. The pupils in the Buckinghamshire schools have a greater probability of success. (*Significant at 95% confidence or above. The odds ratio also is given for significant binary variables) 29
- 30. Any five GCSEs Five include English and maths Estimate s.e. z value P (> |z|) Estimate s.e. z value P (> |z|) (Intercept) 0.313 0.053 5.932 <0.001 * -0.521 0.052 -9.943 <0.001 * In a Bucks school (Vs Oxford) -0.167 0.049 -3.401 0.001 * (1.18) -1 -0.194 0.048 -4.078 <0.001 * (1.21) -1 FSM eligible -0.734 0.102 -7.223 <0.001 * (2.08)-1 -0.703 0.105 -6.665 <0.001 * (2.02)-1 Female 0.502 0.049 10.303 <0.001 * (1.65) 0.516 0.046 11.252 <0.001 * (1.67) Oldest in class -0.212 0.066 -3.219 0.001 * (1.24) -1 -0.280 0.062 -4.544 <0.001 * (1.32) -1 Pakistani 0.985 0.141 7.009 <0.001 * (2.68) 1.161 0.134 8.650 <0.001 * (3.19) Combined KS2 score 2.421 0.078 30.928 <0.001 * 2.858 0.079 36.199 <0.001 * GCSE year: 2008 (Vs 2007) 0.518 0.057 9.107 <0.001 * (1.68) 0.344 0.054 6.363 <0.001 * (1.41) GCSE year: 2009 (Vs 2007) 0.984 0.062 15.858 <0.001 * (2.67) 0.859 0.058 14.761 <0.001 * (2.36) Bucks school Combined KS2 score -0.223 0.106 -2.106 0.035 * -0.397 0.105 -3.801 <0.001 * (AIC) 10180 11234 Table 5. As for Table 4 but now comparing pupils who did not attend a selective school in Buckinghamshire (but might have given their Key Stage 2 attainment) with pupils of similar prior attainment in Oxfordshire’s school. The pupils in the Buckinghamshire schools have a lesser probability of success. (*Significant at 95% confidence or above. The odds ratio also is given for significant binary variables) 30
- 31. Our findings, therefore, are mixed. Consistent with previous studies, there is evidence to suggest that selective schools are of educational benefit to those who are able to attend them. Yet, those who were unable to attend (but, in principle, could have given their prior attainment scores) would do better, on average, in a comprehensive system. FSM eligible pupils are under-represented in the grammar schools, even when those pupils had prior attainment scores that exceeded those of other pupils in the selective schools. We suggested that two conditions should be demonstrated to give support for a selective system. Of these, the first – a value-added learning outcome – appears to exist but at a cost to others not in the selective schools. The second – that academically able pupils from more deprived backgrounds should have no lower propensity to be admitted to a selective school – does not. 6. Conclusions This paper has used learning records of pupils in Buckinghamshire to consider the arguments sometimes advanced in favour of a selective system of education. It suggests that grammar schools may well advance the educational prospects of their pupils insofar as these can be measured by the attainment of five GCSE qualifications at grade A to C but also that the selective system appears to reduce the probability of success at GCSE for those who do not attend a selective school. There are three reasons that might explain this differential. The first is that the eleven-plus is a more accurate measure of innate or potential academic ability than the Key Stage 2 evaluations used by primary schools. This is possible 31
- 32. but conjecture, although the overlap in the Key Stage 2 scores of those who or do not attend a grammar school certainly suggests the tests are measuring different things. The second is that learning resources (such as the finances of the school, the home environment or the ability of teachers) are different for selective and non- selecting schools. This also is possible, indeed likely, but raises questions about inequality of opportunity, to the detriment of those who do not attend a selective school. The third is that there is a peer effect and/or a learning culture that is cultivated in the grammar schools to positive effect. Again, this seems entirely possible but has an unfortunate corollary. If peer effects can be positive to learning in some schools then, presumably, they can also be negative upon learning in others. The implication is that some gain but others not so by selection into grammar schools. At the current time there are no plans by Government either to re-introduce the grammar school system in England or to remove that of it that remains. However, existing grammar schools have recently been given permission to expand, to increase their intake (Gardham, 2011). Permeating government thinking is a desire to give parents more choice and to give schools more freedom to operate outside the constraints of their local authority. Whether this begins to introduce ‘selection by the back door’ is a moot point. What we can say with greater certainty is any system that does not guarantee a pupil will gain a place at a school of their choosing will risk being responsible for creating winners and losers in regard to who gains most from their schooling. What 32
- 33. therefore is important is to ensure that those who gain less are not disproportionately drawn from any one particular social group. Our study suggests that the attendees of grammar schools in Buckinghamshire do benefit educationally from that experience but seemingly at a cost to others. It also suggests that the academic barriers to entry into selective schools are such that pupils from poorer households are under-represented in such schools, suggesting a selective system is more prone to reinforcing social divisions than eroding them. Nevertheless, grammar schools remain rare nationally. A more common occurrence is one of geographical constraints placed on admissions to schools, of house prices rising around the most popular schools, and of resulting ‘selection by mortgage’. Whether this actually is an adequate (or even better) system for enhancing educational prospects and for increasing social mobility is itself debatable (Burgess & Briggs, 2010). References Benn, C., 1972. Comprehensive schools in 1972: reorganization plans to 1975, London: Comprehensive Schools Committee. Boliver, V. & Swift, A., 2011. Do comprehensive schools reduce social mobility? The British Journal of Sociology, 62(1), p.89-110. Burgess, S. & Briggs, A., 2010. School assignment, school choice and social mobility. Economics of Education Review, 29(4), p.639-649. Clifford, P. & Heath, A., 1984. Selection Does Make a Difference. Oxford Review of Education, 10(1), p.85-97. Collins, P., 2012. Making the grade. Prospect, January, pp. 48-51. 33
- 34. Conservatives,The, 2010. Academies programme opened up to all schools. Available at: http://bit.ly/9wx65C [Accessed April 12, 2011]. Crook, D., Power, S. & Whitty, G., 1999. The Grammar School Question: A Review of Research on Comprehensive and Selective Education, London: Institute of Education. Ford, J., 1969. Social class and the comprehensive school., London: Routledge & K. Paul. Galindo-Rueda, F. & Vignoles, A., 2005a. The Heterogeneous Effect of Selection in Secondary Schools: Understanding the Changing Role of Ability, London: Centre for the Economics of Education. Galindo-Rueda, F. & Vignoles, A., 2005b. The Declining Relative Importance of Ability in Predicting Educational Attainment. Journal of Human Resources, XL(2), p.335-353. Gardham D., 2011. Grammar schools get go-ahead to expand. Telegraph.co.uk. Available at: http://tgr.ph/vfbu4O [Accessed January 13, 2012]. Goldthorpe, J. & Jackson, M., 2007. Intergenerational class mobility in contemporary Britain: political concerns and empirical findings. The British Journal of Sociology, 58(4), p.525-546. Goldthorpe, J.H. & Mills, C., 2008. Trends in Intergenerational Class Mobility in Modern Britain: Evidence From National Surveys, 1972-2005. National Institute Economic Review, 205(1), p.83-100. Gorard, S., 2008. A re-consideration of rates of “social mobility” in Britain: or why research impact is not always a good thing. British Journal of Sociology of Education, 29(3), p.317-324. Gray, J., McPherson, A. & Raffe, D., 1983. Reconstructions of secondary education : theory, myth, and practice since the war, London: Routledge & Kegan Paul. Hastings, M., 2009. No one admires high-achievers more than me - but you’ll never get social mobility by passing laws against middle classes. The Daily Mail. Available at: http://bit.ly/xxnZi0 [Accessed February 2, 2011]. 34
- 35. Jesson, D., 2000. The Comparative Evaluation of GCSE Value-Added Performance by Type of School and LEA, Department of Economics, University of York. Available at: http://econpapers.repec.org/paper/yoryorken/00_2f52.htm [Accessed February 2, 2011]. Kerckhoff, A., Crooke, D., Fogelman, K., & Reeder, D., 1996. Going Comprehensive in England and Wales: A Study of Uneven Change 1st ed., Oxford: Routledge. Labour Party, The, 1965. Rejects! Did You Know That 8/10 Children are Rejected for Grammar School Education. London: Deaner Printers Ltd. (Leaflet) Marks, J., Cox, C. & Pomian-Srzednicki, M., 1983. Standards in English Schools, London: National Council for Educational Standards. Marks, J. & Pomian-Srzednicki, M., 1985. Standards in English Schools, London: National Council for Educational Standards. McPherson, A. & Willms, J., 1987. Equalisation and Improvement: Some Effects of Comprehensive Reorganisation in Scotland. Sociology, 21(4), p.509 -539. Pischke, J. & Manning, A., 2006. Comprehensive versus selective schooling in England and Wales: What do we know? National Bureau of Economic Research, Working Paper. Cambridge, MA. Randall, J., How the class war backfired and put social mobility into retreat. Telegraph.co.uk. Available at: http://tgr.ph/3fPo0i [Accessed May 4, 2011]. Steedman, J., 1983. Examination results in selective and nonselective schools: Findings from the National child development study, London: National Children’s Bureau. Steedman, J., 1980. Progress in Secondary Schools: Findings from the National Child Development Study, London: National Children’s Bureau. Stevens, A., 1980. Clever children in comprehensive schools, Harmondsworth: Penguin Books. Weeks, A., 1986. Comprehensive schools: past, present, and future, London: Methuen. 35
- 36. Williams, S., 2010. Climbing the Bookshelves: The Autobiography of Shirley Williams, London: Virago Press. Yates, A. & Pidgeon, D., 1957. Admission to Grammar Schools, London: Newnes Educational Publishing Co. 36