
Recommandé
Contenu connexe
Tendances
Tendances (20)
Similaire à Estimating UX
Similaire à Estimating UX (20)
Dernier
Dernier (20)
Estimating UX
- 1. FR FABRIKAM RESIDENCES Estimating UX Determining realistic timelines and work efforts
- 2. About your presenter Robert Cockburn • 20+ years experience within the Information Technology space. Just over 15 years of this has been focused on User Experience and Interaction Design. • Skilled at translating UI design into developer consumables • Conducted classes on Application Analysis to help teams create better requirements • Helped to develop and build UX groups within organizations, drafting standards for UI frameworks, design templates, and UI component libraries • Over the last 15 years has conducted classes and workshops on Design Thinking, Application Analysis, and Requirements Gathering 2
- 3. Agenda • What gets in the way of an accurate UX estimate • Where UX adds value • Elements to consider when estimating • How to craft a reliable UX Estimate Add a footer 3
- 4. • What gets in the way of a good estimate • Where UX adds value • Elements to consider when estimating • How to craft a reliable UX Estimate Agenda Add a footer 4
- 5. What gets in the way of a good UX estimate • Flaws in approach • Flawed relationships Add a footer 5
- 6. • Flaws in approach • Flawed relationships What gets in the way of a good UX estimate Add a footer 6
- 7. Flaws in approach • Estimates lacking UX discovery, research and/or validation • Estimates that fail to properly integrate Agile practice • Inclusion of questionable UX techniques, given the engagement • Non-UX practitioners planning UX • Methodological differences among DCs • Severely compromising UX practice to “close the deal” • Low or no contingency included • Poor accounting of travel needs / durations Add a footer 7
- 8. Estimates lacking UX discovery, research and/or validation This usually occurs when an account/sales team attempts to scope plan and estimate UX on their own, without input from UX teams. Frequently, it is found that teams don’t understand the distinction between UI and UX and think that UX teams “just draw screens”. Often, the effort for UX tasks that do not yield any “visual outcome”, are ignored. A UX team member must participate in project planning and substantially control the planning of UX activities before formally documenting the expectation. Unless UX engagements can be planned correctly, they cannot deliver them successfully. Add a footer 8
- 9. Estimates that fail to properly integrate Agile practice Agile methodology is new to many account teams, developers and clients. Even if it’s often mentioned in proposed project plans and estimates, it’s seldom correctly fleshed out. This leaves the estimation process for UX efforts falling short of the needed time and cost differentials. Add a footer 9
- 10. Inclusion of questionable UX techniques, given the engagement When non-UX practitioners are the only ones doing the planning of UX research or design techniques project plans tend to have practices and deliverables that would never be used under the given project circumstances. Which deliverables are offered is a function of many things: the purpose/platform/audience of the software, the timeline, legacy redesign/from scratch, to name a few. Not every project needs empathy maps as an example. Add a footer 10
- 11. Inclusion of questionable UX techniques, given the engagement Often, when first engaged with an account team, there are UX plans and estimates that have been created with no input from UX teams and have already been socialized to the client. These estimates were done to fit a period of time that they anticipate the client would not balk at. This creates the issue of estimates vs reality to be beyond a standard margin of error. This then decreases future confidence in the accuracy of any estimates that involve UX activities and undermines the client relationship. Add a footer 11 Non-UX practitioners planning UX and socializing it
- 12. Inclusion of questionable UX techniques, given the engagement When there are different Delivery Centers (DC) there tends to be different methods of doing things, especially estimation. This lack of standardization can be caused by differences in training, experience and/or regional trends, global teams vary as to both overall methodology and preferred techniques and deliverables. This makes it difficult to deliver on an engagement that a different team estimated. When asked to execute on or take over the refinement of a plan created by another DC, the delivering DC must have the right to modify the plan for successful delivery. There also needs to be healthy communication with the client about what these differences are. Add a footer 12 Methodological differences among Delivery Centers
- 13. Severely compromising UX practice to “close the deal” Account teams will often promise their clients specific UX deliverables without directly talking to UX teams. This can compromise what is possible since clients have already signed off on both timeline and deliverables. This then “forces” UX teams to “go with the plan” versus doing what should be done. Putting the UX team into a client selling position for future extensions to ensure that all needed UX work can be completed. The reality of this approach is that this often takes the form of greatly underestimated UX involvement leading to the addition of extraneous or poorly targeted UX tasks under impossible timelines. Add a footer 13
- 14. Low or no contingency included It’s quite common for account teams to strip estimates “to the bone” in order to field the lowest possible price. One way they do this is to ignore risk and leave out contingency. This has a negative impact on UX discovery time. When it comes to UX discovery contingency time is needed because it never fails that things get exposed that neither the client team nor the account team could plan for. Add a footer 14
- 15. Poor accounting of travel needs / durations Though travel cost is factored into most estimates, travel time’s impact on schedule and cost are typically neglected. This has a greater impact on project cost when face-to-face interviews are needed to gather information from stakeholders and users that were not properly scoped out or known at the beginning of a project. Add a footer 15
- 16. What gets in the way of a good UX estimate • Flaws in approach • Flawed relationships Add a footer 16
- 17. Flawed Relationships The account and sales teams have a large impact on how UX fits into both the sales process and the project planning. • Account team relationships • Minimal involvement/impact on the SOW process Add a footer 17
- 18. Account team relationships Difficulties with the forging of proper, professional relationships between the UX and account teams frequently exacerbate the mis- estimation problem. These can likely be traced to both the account teams’ attempts to treat UX in a manner that they’re comfortable with (i.e. like developers or someone to just draw a screen), rather than in a manner that allows for the most successful UX engagements. Add a footer 18
- 19. Minimal involvement/impact on the SOW process There is often the situation in which the agreed-upon tasks or timeline change between the informal acceptance and the Statement of Work (SOW) signing. This can and will lead to very poor estimates and, in extreme cases, to failed engagements. This is another reason to have UX teams just like all other teams involved in the project be an active part of the estimation, project planning process, and the crafting of the final SOW that will be presented to the client. Add a footer 19
- 20. ?’s Questions
- 21. Agenda • What gets in the way of a good estimate • Where UX adds value • Elements to consider when estimating • How to craft a reliable UX Estimate Add a footer 21
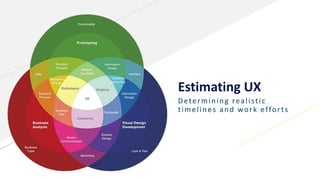
- 22. Where UX adds value UX covers many different primary and secondary disciplines. Each of these areas have their place within the Pre-Sales, Sales, and Product Delivery areas of client engagement. Add a footer 22
- 23. UX Disciplines for Pre-Sales • Functionality • Business Case • Business Analysis • Prototyping • Offer (Statement of Work) • Market Communication • Marketing • Research Add a footer 23
- 24. UX Disciplines for Sales Add a footer 24 • Functionality • Business Case • Business Analysis • Prototyping • Offer (Statement of Work) • Frontend Process • Information Design • Backend Process • Business/Project Plan
- 25. UX Disciplines for Product Delivery Add a footer 25 • Functionality • Business Analysis • Prototyping • Frontend Process • Information Design • Backend Process • Interaction Design • Performance • Consistency • Visual Design
- 26. ?’s Questions
- 27. Agenda • What gets in the way of a good estimate • Where UX adds value • UX estimate considerations • How to craft a reliable UX Estimate Add a footer 27
- 28. UX estimate considerations • The Account Team UX process maturity • The Client’s UX process maturity • Project Ownership • Project Landscape • Stage of requirements gathering • Expected UX activities and deliverables Add a footer 28
- 29. The Account Team The account team is the first face the client sees and is responsible for the relationship. An accurate UX estimate considers: • Ownership • UX, Development, and Vendor Relationship • UX maturity • Agile maturity • Engagement History • New, past issues, past solid performance Add a footer 29
- 30. The Client’s Process Maturity The client’s process maturity reflects the ease with which they adapt to improvements in the design and development practice. • UX Maturity • Agile Maturity • Engagement History • New, past issues, past solid performance Add a footer 30
- 31. Project Ownership Project ownership is all about who owns the work and the nature of the approval process. Each variation below will have a different impact upon the estimate. • Work Ownership • Consulting IT does all the work • Consulting IT + client teams • Consulting IT + outside agencies • Approval responsibility • Consulting Approval • Consulting PM approval • Single customer approval • Multiple customer approval • Customer agent approval Add a footer 31
- 32. Project Landscape • Freshness • Legacy enhancement, Legacy redesign, From scratch • Audience • B2E, B2C, B2B, B2B2C • Technology • Web custom (HTML, CSS, jScript, Angular, jQuery, et.), Mobile native, Mobile hybrid, "Package" (SalesForce, AEM, SAP, etc.) • Agile development • None, New, Evolving, Established • Flexibility • Fixed (1 Device), Desktop / Tablet, Desktop / Tablet / Phone, Desktop / Phone, Large Monitors • Branding guidance • Detailed brand guide not needed, needed and available, needed but unavailable Add a footer 32
- 33. State of requirements gathering This can have an over sized impact on building out UX requirements. UX teams have the greatest impact when they fully participate in the requirements gathering process. When UX is engaged after discovery and/or requirements gathering their effectiveness is greatly reduced. Also, there is a significant risk that UX techniques will uncover missed requirements. Add a footer 33
- 34. Expected UX activities and deliverables This is the one area of the estimate that is rather straight forward. Where it differs from development estimates is that not all UX activities result in a deliverable but rather a grouping of activities can produce a single deliverable, but each activity and the final deliverable all have their own estimates in both time and efforts needed. Simple example would be the deliverable of a persona. There is the time for planning who to interview, how many to interview, the time for each interview, then the collation of all the notes taken into a single persona. Each step of this process takes time and the number of people interviewed just add to the overall time and effort costs. But the return further downstream is high in the amount of work saved by getting the business processes and final UI designed correctly to support the intended users. Add a footer 34
- 35. ?’s Questions
- 36. Agenda • What gets in the way of a good estimate • Where UX adds value • Elements to consider when estimating • How to craft a reliable UX Estimate Add a footer 36
- 37. How to craft a reliable UX Estimate Crafting a reliable UX estimate involves fixed tasks that support understanding of what the users will need and then the creation of the UI that the users will get to interact with. These fixed tasks and deliverables are ones that time and cost are either set or easily scaled such as personas. When building the estimate for the UI there are two primary methods: • Older method is to use screen count • Newer is to use touchpoints and user stories Add a footer 37
- 38. Choosing deliverables Add a footer 38 Deliverables are broken into two categories, but to get to the right deliverable they are also paired with a target activity. • Discover • Define
- 39. Discover Add a footer 39 Activities Deliverables Design Thinking Workshop Workshop report Stakeholder Interviews interview report (optional) UX data analysais (pain points, analytics, etc) No client deliverable Heuristic Evaluation Heuristic evaluation report Co-Discovery Workshop Workshop report (optional) Journey Mapping Journey map(s) Competitive Benchmarking Competitive research report Contextual Inquiry Contextual inquiry report
- 40. Define Add a footer 40 Activities Deliverables Personas User personas Touchpoint Analysis Touchpoint analysis Information Architecture Site map(s) Visual Design Comps: create, iterate Design comps Clickable Design Mockup: create, test, iterate Clickable prototype Low Resolution Wireframing Low-fi wireframes Visual Design High Resolution Design / Clickable Prototype Final Estimate will be determined by method used
- 41. ?’s Questions
- 42. Building the estimate for the UI • Screen count • Touchpoints and user stories Add a footer 42
- 43. Pros / Cons of Screen Count • Pros: • Easy to assign developers based on screen count needs • Easy to tell a client what the scope of the design will be • Quick to guesstimate • Good for small scale efforts • Good for updating visual design • Cons: • Often changes during the course of project discovery • Often changes during the course of design • Can create project overrun • Final product does not often reflect original proposal Add a footer 43
- 44. How to estimate with screen count • Understand what should be factored into work efforts • Counting the screens • Understand what the contingency needs to be Add a footer 44
- 45. Understand what should be factored into work efforts As in all estimates the requirements are the driver of the work. Requirements that have a direct impact on screen count, and can work as direct multipliers are: • Responsive Design - Break Points • Native Mobile - Number of platforms • Hybrid Platforms - Number of Platforms • Number of Languages • Number of Character Sets • Expected Number of User Roles Add a footer 45
- 46. • Understand what should be factored into work efforts • Counting the screens • Understand what the contingency needs to be How to estimate with screen count Add a footer 46
- 47. Add a footer 47 Counting Screens Functionality/ Features/ Requirements Complexity for ID and VD SN Req ID Feature/ Functionality/ Requirement Discription Sub Screens Feature Complexity Low 1 2 Med 3 4 High 5 Estimated Unique Screens 2 3 2 3 1 11 Feature Requirment 1 1 1 1 1 4 Feature Requirment 2 2 1 3 6 Feature Requirment 3 1 1 0 Once a screen count is determined those screens need to be turned into an estimated cost buy using Person Days (PD) Complexity # of Screens Wireframe PD Visual Design PD 1 2 2 2 2 2 2 4 3 2 4 4 4 1 3 2 5 1 3 3
- 48. • Understand what should be factored into work efforts • Counting the screens • Understand what the contingency needs to be • Screen effort estimate How to estimate with screen count Add a footer 48
- 49. Understand what the contingency needs to be When estimating on screen count contingency use this as a rule of thumb: Add a footer 49 Responsive Design Break Points Native Applications Hybrid Platforms Not applicable 0% Not applicable 0% Not applicable 0% 1 20% 1 0% 1 0% 2 30% 2 30% 2 30% 3 35% 3 50% 3 50% Add up the percentages from each category and then multiply that times the screen count. Example: • 2 Break Points – 30% • 1 Native Application – 0% • 2 Hybrid Platforms – 30% • 11 Screens Contingency Screens are 30% + 30% = 60% 11 * 60% = 6.6 At a complexity of 1
- 50. Screen effort estimate Calculating the total time effort for screen counting leverages screen counts by complexity times the person days. Add a footer 50 Productivity in Person Days based on Screen Complexity Complexity 1 2 3 4 5 Wireframe 1 1 2 3 3 Visual Design 1 2 2 2 3 Complexity # of Screens Wireframe PD Visual Design PD 1 2 2 2 2 2 2 4 3 2 4 4 4 1 3 2 5 1 3 3 Contingency 6.6 6.6 6.6 Sum 20.6 21.6 Total 42.2
- 51. ?’s Questions
- 52. Building the estimate for the UI • Screen count • Touchpoints and user stories Add a footer 52
- 53. Pros / Cons of Touchpoint and User Stories • Pros: • Estimate of work accurately • Small changes during detailed discovery • Easier to plan an accurate delivery timeline no matter delivery method • Better understanding of what is modular and what is distinct • Cons: • Higher time investment up front • Higher level of understanding of UX processes required by Account team Add a footer 53
- 54. How to estimate with Touchpoint and User Stories • Understand what should be factored into work efforts • Understand what the contingency needs to be Add a footer 54
- 55. Understand what should be factored into work efforts There are four main areas that make up estimates that are centered around touchpoints and tasks: • Touchpoints • Complexity • User Stories • Design Capacity Add a footer 55
- 56. Touchpoints Touchpoints are the primary ways that a user will interact with the system and fall into 3 categories. Add a footer 56 Orientation • Identify • Master/Detail • Navigation • Proximity • Timeline • Wizard Consumption • Alert • Map • News • Video • Visualize Datasets Activity • Achieve • Apply • Approve • Capture • Collect • Compare • Confirm • Contact • Discuss • Edit • Filter • Locate • Note • Pay • Personalize • Poll • Rate • Search • Share • Shopping Cart • Suggest • Tag • Tour • Triage
- 57. Complexity Every touchpoint that gets identified will need a complexity level assigned to it. The complexity scale is from 1-5 as the more traditional 1-3 ranking makes decision making more difficult. These complexity scores will need to be applied to every user role that interact with a touchpoint. Add a footer 57 Business Processes & Goals Employee Complexity Assessor Complexity Reviewer Complexity HR Complexity Maintain user roles and permissions Edit 2 HR Manages Assessment Schedule Timeline 3 Assessor and Employee negotiate the goals Identify, Approve, Contact 3 Identify, Approve, Contact 2 Approval 1 Master/Detail 3 1) Simple touchpoint activity supported with standard design 2) Touchpoint is supported by standard design 3) Touchpoint is complex but supported by standard design 4) Complex visualizations or interactions that use known design patterns 5) Unusual or new interaction patterns that follow no current standards
- 58. User Stories Calculating an estimate of user stories is a combination of touchpoints and complexity. Add a footer 58 Complexity Rule of thumb 1. 1 user story 2. 1 user story per touchpoint 3. 2 user stories per touchpoint 4. 4 user stories per touchpoint 5. 6 user stories per touchpoint User Story Calculation Employee Role • 3 Touchpoints * 3 Complexity * 2 = 18 User Stories Assessor • 3 Touchpoints * 2 Complexity = 3 User Stories Reviewer • 1 Touchpoint * 1 Complexity = 1 User Story HR • 1 Touchpoint * 2 Complexity = 2 User stories • 2 Touchpoints * 3 Complexity * 2 = 12 User Stories Total 36 User Stories
- 59. Design Capacity Capacity is what your UX team can turnout within a sprint. With the average sprint having a 2 week cycle it is reasonable to expect a design team to have a capacity of 4 user stories per sprint. So following this capacity a single UX person doing the UI design efforts would be able to complete the full design within 9 sprints (36/4) or 18 weeks of effort. Add a footer 59
- 60. Comparing outcomes Screen Count Add a footer 60 Touchpoint and User Stories With 2-week sprints and 42.2 person days this would be 5 sprints of design work With 36 user stories and the ability to handle 4 user stories per sprint. There would be 9 sprints of design work. These 2 methods yield a difference of 4 sprints or 2 months of effort. The shorter timeframe may help get a contract at the start but since many contracts with clients are fixed bid that means there could be as much as a 2 month work effort that is not paid by the client. On top of the impact to the client relationship when the project is 2 months late.
- 61. ?’s Questions
- 63. References Add a footer 63 https://miro.medium.com/max/675/0*Yd5XWOs7kJ1UP0Y2.png