SlideShare une entreprise Scribd logo
1  sur  12
MORTALITY IN INFANCY AND CHILDHOOD
mortality rates are Good indicators to measure the level of health and health care in different
countries they also help in assessing the overall socio-economic development of a country.medical
and social progress substantially reduced mortality in child hood.
It has become customary to consider mortality in and around infancy in a number of time periods
convienient from both the analytical and programmatic point of view as under:
Perinatal period
Early neonatal period
Late neonatal period
Neonatal period
Post neonatal period
Infant mortality
Post –neonatal death
Neonatal death
Early
Neonatal
death
Late –neonatal
death
Perinatal death
Still birth
28 week of Birth 7 days 28 days 1 year
Gestation
FOETAL DEATH:Foetal death is death prior to the complete expulsion or extraction from its mother
of a product of conception,irrespective of duration of pregnancy;the death is indicated by the fact
that after such separation the foetus doesnot breathe or show any other evidence of life,such as
beating of the heart,pulsation of the umbilical cord,or definite movement of voluntary muscles.
STILL BIRTH RATE: The most wide spread use of the term is “death of the foetus weighing 1000g
(this is equivalent to 28 weeks of gestation).still birth is given by the formula.
Still birth rate= foetal deaths weighing over 1000g at birth × 1000
Total live+ still birth weighing over 1000g at birth
It is a frequent occurrence in the developing countries.its prevention involves the detection and
treatment of infectious pathology in the course of pregnancy as well as of high blood pressure and
its complications,Rh incompatability,diabetes and premature rupture of the membrane.some
causes are difficult or impossible to eliminate,such as multiple pregnancies,cord anomalies,foetal
malformations,placenta anomalies.
Approximately 3.3 million babies are still born each year world wide.
PERINATAL MORTALITY RATE: as currently defined,the term perinatal mortality includes both late
foetal deaths(still birth)and early neonatal deaths.
The WHO definition,more appropriate in nations with less well established vital records of stillbirths
is as follows
PMR= late foetal deaths(28 week of gestation and more)
+early neonatal deaths(1st week)in one year ×1000
Live birth in the same year
Number of deaths occurring in the perinatal period (includes stillbirths after 28 weeks of gestation
plus the deaths occurring in the first seven days after birth) in a given year to the total number of
births (live and still) in the same year. It is also expressed as rate per 1000 total births. For the
purpose of inclusion in this rate, the stillbirth or live births should be either (i) > 1000 g in weight, (ii)
28 weeks in gestation or if (i) and (ii) are not available , should measure 35 cm or more in length at
birth.
More than 6 million perinatal deaths occur each year worldwide; 3.3 million of these happen during
late pregnancy and birth while 3 million newborn die in the first week. Whereas Africa has the
highest PMR of 75 per 1000 total births, 40 per cent of total perinatal deaths take place in South-
Central Asia. Perinatal mortality in these areas results from poor nutritional status of women,
insufficient prevention of pregnancy related complications and few supervised deliveries. Some of
these causes are rooted in the social, cultural and economic structure of the society.
Perinatal mortality is a problem of serious dimensions in all countries.it now accounts for about 90
percent of all foetal and infant mortality in the developed countries.in india,still births are seldom
registered.consequently ,most studies on perinatal mortality in this country are hospital based.
NEONATAL MORTALITY RATE: neonatal deaths are deaths occurring during the neonatal
period,commencing at birth and ending 28 completed days after birth.neonatal mortality rate is the
number of neonatal deaths in a given year per 1000 live birth in that year.
=number of deaths of children under 28 days of age in a year ×1000
Total live birth in the same year
It is the number of neonatal deaths in relation to 1000 live birth per year.
Perinatal and neonatal mortality can be used as a measure of socio-economic development and for
international comparisons. Of approximately 8 million infant deaths occurring annually, 4 million cn
be ascribed to the neonatal period; 98 percent of them in developing countries. More than two
thirds of the estimated 4 million neonatal deaths occur in the early neonatal period, ie during first 7
days following birth.
Thus, it appears that priority needs to be given to perinatal and neonatal mortality in order to
decrease infant mortality. Health measures were previously directed toward decreasing post-
neonatal and early childhood mortality thinking that PMR and NMR cannot be brought down by
public health measures
POST NEONATAL MORTALITY RATE:deaths occurring from 28 days of life to under one
year are called post neonatal mortality rate.
=number of deaths of children between 28 days
and one year of age in a given year ×1000
total live births in the same year
Total live births in the same year
INFANT MORTALITY RATE: Infant mortality rate is defined as the ratio of infant deaths
registered in a given year to the total number of live births registered in the same year,usually
expressed as a rate per 1000 live births.
IMR= number of death of children
Less than 1 year of age in a year × 1000
Number of live birth in the same year
It is the number of infant death in a year in relation to 1000 live births during the same period.
This is irrespective of the fact that some of those infants who died in this year might have been born
in the last few months of the previous year. UN estimates show that that the global IMR has
decreased from 87 per 1000 live births during 1975-1980 to less than 50 today.
India at the beginning of this century had an IMR of more than 200 per 1000 live births (219 in 1916
– 1920). By 1982 the IMR came down to 100 per 1000 live births. According to 1991 census , the
IMR was 80 per 1000 live births. Current IMR for India stands at 58 per 1000 live births per year.
This has been mainly due to reductions in post-neonatal deaths. This decline has been made
possible due to (i) improvements in the quality of life due to environmental measures; (ii) better
facilities for early diagnosis and treatment and prevention of communicable diseases; (iii) better
health delivery system; and (iv)improvement in overall nutritional status. Developed countries have
shown a greater reduction in infant mortality as compared to child mortality while in the developing
worlds, the situation is reverse.
CAUSE: Main causes of infant mortality during the neonatal and post-neonatal periods are
different. Majority of neonatal deaths are accounted for by low birth weight , infections, birth
asphyxia and congenital anomalies whereas post-neonatal mortality occurs primarily due to
infections (diarrhea, respiratory infections, vaccine preventable disease) and malnutrition.
Low birth weight consequent upon material malnutrition , decreased spacing between births, large
family size and a high fertility rate are the principle factors resulting in a high infant mortality.
Failure to offer breast milk, non-practising of exclusive breast milk, non-compliance with
immunization on account of illiteracy, ignorance, cultural and social beliefs pose the greatest risks of
death in the infant. Finally, poverty, poor standards of living, inaccessibility to safe water and proper
sanitation contribute in a compounded fashion.
PREVENTION: Preventive measures have to be aimed at improving the nutritional status of the
mother, providing good and essential antenatal care and ensuring safe delivery. Essential newborn
care, promotion of breastfeeding, immunization, early detection of illness (achievable by growth
monitoring) and their management are the mainstay for reducing infant mortality. Family planning,
efficient services for reproductive and child health, provision of safe water, sanitation, improving
the socioeconomic status and providing health education should be carried out on priority basis.
We have to strive hard to implement policies for achieving use of ORS, exclusive breast feeding,
universal immunization coverage and 100 percent female literacy. Simultaneously, various health
programs need constant reinforcement with involvement of NGOs and non-health sector.
1 TO 4 YEAR MORTALITY RATE (CHILD DEATH RATE)
Child death rate is the number of deaths of children aged 1 to 4 year per 1000 children in the same
age group in a given year.it thus excludes infant mortality.
=no.of deaths of children aged 1 to 4 years during a year ×1000
Total no.of children aged 1-4 years at the middle of the year
UNDER FIVE MORTALITY RATE
UNICEF defined this as the annual number of deaths of children age under 5 years,expressesed as
rate per 1000 live births.
=number of death of children less than 5 years of age in a given year
Number of live birth in the same year
This is expressed as a sum of infant mortality rate and child mortality rate. It is an indicator of well-
being of all children below the age of five years. It is useful for investigating effectiveness of various
public health interventions. It also reflects income and education of parents, the prevalence of
malnutrition and disease, availability of clean water, the efficacy of health services, and the health
and status of women. Under 5 mortality rate decreased from 146/1000 in 1970 to 79/1000 in 2003.
A total of 10.6 million children are dying every year in the world, prior to attaining 5 years of age.
COLLECTION OF VITAL STATISTICS
The vital statistical system deals with the individual's entrance into and departure from the world and
with change in the marital status. The concerned events are birth, death, marriage and divorce. It is
useful in so'cioeconomic planning and in planning of health and family welfare services. In India
vital statistics are obtained from (i) Population census (ii) Civil registration system (iii) Sample
registration system (iv) Adhoc sample surveys (v) Rural survey of cause of death (vi) Medical
certification of causes of death (vii) Institutional records, etc.
Sources of Data
1. Population Census
Census means the enumeration of the total population of the people in a country at a given moment of
time. It is defined by the United Nations as "the total process of collecting, compiling and publishing
demographic, economic and social data pertaining at a specified time or times to all persons in a
country or a delimited territory."
The process of completing the census on the night was not operationally feasible to enumerate
all individuals. Since 1941, the system accounted for all individuals permanently resident at one
place, irrespective of whether he was present there or not at that particular time. This is the deJure
system which is followed till date. The last census was performed in Feb.-March 2001. The census
provides useful demographic and social data about age, sex, marital status, language, education,
occupation, economic status, place of birth, number of children born alive to a woman, etc. Such data
are useful
for:
a. Socioeconomic planning and planning of health and family welfare services.
b. Finding the growth rate of population.
c. Calculating the indices like birth, death and morbidity rates.
Problems in census operation Errors may creep in census data due to the following shortcomings at
the data collection stage:
1. The terms used in the proformas for collection of information may be interpreted differently by
different enumerators.
2. There is shortage of trained manpower to collect and process the information.
3. Census field work is extremely tedious. Dishonest field workers manipulate figures to give wrong
results.
4. Many people do not give correct information due to failure on the part of the investigator to
establish proper rapport with them.
5. Age is often recorded in multiples of 5 years. The importance of recording actual age is not
understood by the investigators.
Since the census is a costly exercise in terms of men,
2. Registration of Vital Events
It is done on a continuous basis by various agencies responsible for vital statistics in different states.
These agencies are of four types - Panchayat, Revenue, Police, and Health. In some states (e.g. Bihar,
UP, Rajasthan) the information about birth and death is collected by the Panchayat system. In states
like Andhra Pradesh, Tamil Nadu and Karnataka, this information is collected through the revenue
system (Tehsildar, village munsif, etc.). The police is responsible for this activity in states like
Haryana, Punjab and J&K.Oddly enough,this information is directly collected by the health
department only in a few states (Kerala, Orissa and West Bengal). This inspite of the fact that the
occurrence of life and death are of primary concern to the health sector. The civil registration system
is shown in the diagram below:
personinch
Level
Registrar-general
centre
Director,health
services/director of
economic and statistics
State
District co
officer
district
Registration of birth and death
Registrar-general of india
Chief registrar of birth and
deaths
District registrar
registrar
Tehsil/block/town Rura
Village/institution
Village
chowki
dar/sch
ool teacher/hospital/maternity home
It is obvious from the foregoing that there is no uniformity in the system of reporting of births and
deaths. This is further reflected in the fact that even at the state level, this information is centralised
variously either at the level of Director of Health or the Director of Statistics. The State Directors
send the information to the Director- General of Health.
Services and Registrar-General in Delhi, who,in turn supply necessary reports to the WHO
and other international agencies.
Voluntary registration of vital events started in India after the passage of the Birtl).s, Deaths and
Marriages Registration Act in 1866. Some erst while states like Madras and Mysore made the
registration compulsory.
Earlier, over 30% of births and notifiable infectious diseases like smallpox, cholera and
plague went unrecorded due to defects in reporting and registration of vital events. The problems
included lack of interest and illiteracy on the part of parents, indifference on the part of reporters and
registrars who were poorly paid, poor communications, etc. Registration improved to some extent
after responsibility was passed onto the Panchayats. Still, compared to the data obtained from sample
surveys, the proportion of unregistered events was pretty high and the registered data was not
reliable. Hence, the Government of India passed the Registration of Births and Deaths Act, 1969. It
provides for compulsory registration of births within the period notified. This period is 21 days in
Delhi both for births and deaths.
. 3. Notificationof Diseases
Notificationof certain communicable diseases is compulsory throughout India on the part of
Panchayat Secretaries in villages and doctors in towns. These records are maintained by the District
and Municipal Health Officers in districts and towns, the Directors of Health Services in the states
and the Director-General of Health Services at the center. The epidemiological statistics of
communicable diseases is collected from the National governments by the regional offices of the
WHO and are published periodically in the form of the Annual and Monthly Epidemiological and
Vital Statistics Records and the Weekly Epidemiological Records. The diseases to be notified vary
from country to country and from region to region within the same country. The three diseases that
are internationally notifiable to the WHO at present are cholera, plague, and yellow fever.
4. Institutional Records
Hospitals, primary health centres and maternity homes prepare monthly returns of indoor and outdoor
cases and send them to the State Director. 'These data are biased but give a gross picture of the
Sub-registrar
diseases prevalent in the catchment area of the institution and are often used to assess hospitals needs
and efficacy of certain therapeutic measures.
5. Community Surveys
Health, nutrition and morbidity surveys are conducted in certain communities from time to time.
These surveys,if conducted properly using sound sampling proced.ure and epidemiological
principles, are a very useful source of information. Community surveys may also be carried out
specifically to find the prevalence or incidence ofspecific conditions such as tuberculosis, leprosy,
malaria, cancer, obesity, protein, energy malI1utrition and goiter.
6. National Sample Survey
The National Sample Survey (NSS), started in 1950-51, is a continuous activity undertaken by the
Central Government on all India basis to collect data relating to social, economic and demographic
aspects. The National Nutrition Monitoring Bureau (NNMB), located at the National Institute of
Nutrition, Hyderabad, is specifically engaged in collecting nutritional data in the field on a predefined
sample. Other central agencies concerned with various statistical data, including vital statistics, are
Central Statistical Organisation (CSO), Registrar-General of India and the Bureau of Health Statistics
within the Central Ministry of Health.
7. Sample Registration System (SRS)
In the absence of dependable data term Civil Registration, the office of the Registrar-General of India
initiated a scheme of sample registration of births and deaths in 1964-65 in a few selected states. Now
this system covers the entire country. It is based upon a dual recording system comprising of
continuous registration of vital events.along with half-yearly retrospective survey, each providing a
check on the other. The main objective of the system is to provide reliable estimates of vital rates at
the state and nationalleve!. The essential features of SRSare:
a. A base-line survey of the sample unit to obtain the usual resident population of the sample area
through household schedule.
b. Continuous (longitudinal) enumeration of vital events pertaining to the usual resident population
by a locally resident enumerator. This continuous enumeration is done by part time enumerators, who
are generally school teachers paid an honorarium for this work. Each enumerator appoints specified
informants in his area and whenever ittformation is provided, he visits the specified household. In
addition, he conducts fortnightly visits.
c. An independent yearly survey of births and deaths by an investigator (supervisor) who is a full
time employee. Each supervisor is in-charge of 12enumerators.
d. Matching of events reported by the two systems.
e. Field reverification of unmatched and partially matched events.
.
The sample unit in rural areas is a village or a segment if the village has a population of 1500 or
more. In urban areas, the sample unit is a census enumeration block with a population ranging from
750-1000. At present SRS covers 6671 sample units (4436 rural and 2235 urban) in all the States and
Union Territories of India covering 1.1 million households and a population of about 6 million.
8. Model Registration System
Generation of morbidity statistics forms an integral part of vital statistics system. However, due to
paucity of qualified medical personnel in rural areas, medical certification of cause of death is not
feasible in India. A conference on improvement of vital statistics was held in April 1961. Based on its
recommendations, the Registrar-General of India initiated in 1965 a scheme called Model
Registration Scheme on a limited scale. This scheme is now known as "Rural Suroey of Cause of
Deaths." Currently, this scheme covers more than 1000 PHCs and seeks to collect data on causes of
death, through paramedical personnel, in the headquarters village of the PHC only. The deaths are
classified according to an. adopted nonmedical list. It is not a sample survey as the units are not
selected randomly but according to convenience. The causes of death reported are checked by the
medical officer of the concerned PHC and every 10th death is verified by the
9. Miscellaneous Sources
These include health departments of factories and insurance companies.
International Definitions
In 1953, the United Nations approved the principles for a Vital Statistics System. The guidelines for
this were published in 1955. These were aimed at helping the member countries to develop a uniform
system of registration, interpretation and comparison of vital events. Various vital events have been
defined by the WHO asfollows:
Live birth Live birth is the complete expulsion or extraction from its mother of a product of
conception, irrespective of the duration of pregnancy, which, after such separation, breathes or shows
any other evidence of life, such as beating of the heart, pulsation of the umbilical cord, or definite
movement of voluntary muscles. Whether or not the umbilical cord has been cut or the placenta is,
attached, each product of such a birth is considered live-born. It may be mentioned that under the
Indian "Registration of Births and Deaths Act, 1969" birth includes both live birth and stillbirth.
Fetal death Fetal death is death prior to the completeexpulsion or extraction from its mother of a
product of conception, irrespective of the duration of pregnancy. The death is indicated by the fact
that, after such separation, the fetus does not breathe or show any other evidence of life, such as
beating of the heart, pulsation of the umbilical cord or definite movement of voluntary muscles.
Stillbirth It is synonymous with late fetal death, i.e. twenty-eight completed wise of gestation.
Immaturity (prematurity) In international classification of disease, an immature infant is a live
born infant with a birth weight of 2500 g (5.5 Ibs) or less. In some countries a live-born infant with a
period of gestation less than 37
weeks is specified as 'premature' regardless of weight. Such premature infant may be considered as
'immature' in International Classification.
Death "Death is the permanent disappearance of all evidence of life at any time after live birth has
taken place" (postnatal cessation of vital functions without capability of resuscitation).
Infant deaths Deaths under one year of age.
Neonatal deaths Deaths occurring under 28 days of age.
Perinatal deaths Deaths occurring after 28 weeks of fetal life and within 7 days after birth. It is often
difficult to know the correct fetal age. In such situation, fetal weight of 1000 gill is considered to
represent gestational age of 28 weeks, as suggested by the Ninth Revision (1975) of International
Classification of Diseases. If both gestational age and birth weight are unknown, then a body length
(crown to heel) of 35 cm is taken as equivalent to 28 weeks gestational age.
Maternal deaths Deaths associated with complications of pregnancy, childbirth and puerperium.
General Practitioner and Vital Statistics
The general practitioner can play an important role in improving the registration of vital events and
collection of health statistics as described below:
BirthsThemedical man often attends upon a pregnant woman during antenatal, natal or postnatal
period. He is also called upon to treat the infant.
He is aware of the fact of birth and is also conversant with the mode of notification and its
importance.
Deaths He should certify the cause of death in the prescribed form for death certificate which he
should send to the Registrar.
Notifiable morbidity He should notify all notifiable diseases properly and correctly to health
authorities
International Death Certificate
All medical practitioners should be familiar with the filling of the International Certificate of Death.
ANALYSIS OF VITAL DATA
Calculation of Vital and Health Indices Vital and morbidity indices are calculated as "rates" or
ratios", using the mid-year population (i.e. on first July) as a denominator.
Mid-year Population
Three methods are used to find the mid-year population:
1. Natural Increase Method
This is done by adding the increase due to births and immigration to the last census population and
subtracting from it the loss due to deaths and emigration. This method requires cent per cent
recording of births, deaths, and migration and is not practicable in our country.
2. Arithmetic Progression Method
It is assumed that population increases equally in each
year of the intercensal period. It is found by the formula:
Pn =PC1+ a (PC2 - PCl)/10 where Pn denotes mid-year population of any given year. PCI and PC2
indicate the population of the last two censuses and a is the period in years after the last census.
3. Geometric Progression Method
Here it is assumed that population increases like compound interest and the rate of growth is
geometric and not arithmetic. If 'PC is the population of any census year and 'r' is the rate of increase
per year per person in the intercensalyears, then mid-year population at the year will be P (1+ r)n
.
This is certainly a better method.
Population Density
This is measured in terms of the number of people per square km in a particular year. The population
density in India was 324 in 2001.
Population Pyramid
It is a broad based conical pyramid because of high birth rate and tapering of population with increase
in age. In countries with low birth rate, the pyramid swells in the middle, is narrow at the base, and is
not so conical at the top (dumb bell shaped "pyramid").
Rates and Ratios
The rates are usually calculated from the total events occurring in a geographical area over a period
of a calendar year. They are hence annual rates and are of two types, crude and specific: Crude rate is
based on total population while a specific rate is based on the population group specified on the basis
of age, sex, occupation, etc.
INTERPRETATION, CONCLUSIONS, AND RECOMMENDATIONS
Biased conclusions due to defects in registration, collection, and compilation are very likely. When
the records are not reliable, it is better to carry out sample surveys, following strictly the rules for
selection and inquiry.
Birth and Fertility Rates
High crude birth rate and fertility rate indicate rapid increase in population, which calls for birth
control measures. If the birth control measures are effective, there should be a fall in birth rate and
fertility rate. There are some indices that may indicate a fall in birth rate when other vital statistics are
lacking or are not reliable. These include:
a. Child woman ratio = Children under 5 years
Women aged 15-49
b. Percentage of births of higher order such as fourth and more-If it is low, it means family planning
is effective.
c. Average interval between births-longer in travel indicates fall in birth rate.
d. Pregnancy rate –pregnancies to women of child bearing age × 100
total years of exposure
Death Rates
Cn..de death rates can be greatly affected by age-sex distribution. Hence they should be standardised
before drawing conclusions or making comparisons from place to place. Crude death rate in a colony
of retired people will be very high while in a new township developed near an oil refinery and
inhabited mostly by young people, it will be very low. Standardized death rates can be calculated by
two methods, direct and indirect, as described below. It should be pointed out that these methods of
standardisation are not unique to death rates and can also be used for comparing other events, such as
morbidity rates.
1. Direct Standardization
In this method the age specific death rates in the community under study are applied to various age
groups in . the standard population. Their total gives the standarised mortality rate for the population
under study. The reference population is usually the population of the whole country. This enables
comparison of rates in two 2001censusdata analysisnot availableso far communities within the
country. However, an inter national standard population has to be used for comparison of rates
within countries.
2. Indirect Standardization
The direct method necessitates the knowledge of age specific death rates in the population studied
before the results can be standardised. Sometimes this information may not be available. At other
times, the population size may be too small, especially in certain age groups, with the result that age-
specific death rates may fluctuate widely with slight variation in the number of deaths in the
particular category. In such situations, the indirect method of standardisation is used. The information
required for using this method is the age structure of the study population and the age specific death
rates of the standard population.
Sex Ratio
This is the ratio of females to males. It is expressed as the number of females per 1000 males in a
population. Ordinarily speaking, sex ratio should be more than 1. This is because women have
slightly longer lifespan than men. Sex ratio in developed countries is more than one, Le., there are
more women than men. The ratio in many developing countries, including India, is less than one.
There are 933 females per 1000 males in India." Sadly, the ratio has been consistently falling in India
since the beginning of this century. *It is a happy indication that the current value is an improvement
on the 1991 sex ratio of 923. It is obvious that women have more innate survival capacity
biologically, yet they experience higher mortality because of environmental factors (mainly social
environment).

Contenu connexe

Similaire à MORTALITY IN INFANCY AND CHILDHOOD (2).docx

Vital ASSESSMENT OF NUTRITIONAL STATUS BASED ON VITAL STATISTICSppt
Vital ASSESSMENT OF NUTRITIONAL STATUS BASED ON VITAL STATISTICSpptVital ASSESSMENT OF NUTRITIONAL STATUS BASED ON VITAL STATISTICSppt
Vital ASSESSMENT OF NUTRITIONAL STATUS BASED ON VITAL STATISTICSpptjas maan
 
CHILD MORBIDITY AND MORTALITY RATES.pptx
CHILD  MORBIDITY AND MORTALITY RATES.pptxCHILD  MORBIDITY AND MORTALITY RATES.pptx
CHILD MORBIDITY AND MORTALITY RATES.pptxGrashiaBlessy1
 
Vital stastics in obg converted
Vital stastics in obg convertedVital stastics in obg converted
Vital stastics in obg convertedHemlata Parmar
 
Ozz(infant mortality rate )
Ozz(infant mortality rate )Ozz(infant mortality rate )
Ozz(infant mortality rate )Viju Rathod
 
CHILD_IMMUNIZATION_IN_INDIA_-final_word_doc
CHILD_IMMUNIZATION_IN_INDIA_-final_word_docCHILD_IMMUNIZATION_IN_INDIA_-final_word_doc
CHILD_IMMUNIZATION_IN_INDIA_-final_word_docRhea Bose
 
recent advancement in contraceptives
recent advancement in contraceptivesrecent advancement in contraceptives
recent advancement in contraceptivesManu Aravind
 
Infant Mortality Rate, perinatal mortality
Infant Mortality Rate, perinatal mortalityInfant Mortality Rate, perinatal mortality
Infant Mortality Rate, perinatal mortalityRoselin V
 
INDICATORS OF MATERNAL AND CHILD HEALTH CARE.pdf
INDICATORS OF MATERNAL AND CHILD HEALTH CARE.pdfINDICATORS OF MATERNAL AND CHILD HEALTH CARE.pdf
INDICATORS OF MATERNAL AND CHILD HEALTH CARE.pdfIbirogbaDamilola
 
L01 2010 the growth of world population
L01 2010 the growth of world populationL01 2010 the growth of world population
L01 2010 the growth of world populationaesgeography
 
Lectures note on reproductive health: parte one -Neonatal and Child Health
Lectures note on reproductive health: parte one -Neonatal and Child HealthLectures note on reproductive health: parte one -Neonatal and Child Health
Lectures note on reproductive health: parte one -Neonatal and Child Healthelsawzgood
 
An brief introduction to the
An brief introduction to theAn brief introduction to the
An brief introduction to theAPSARA Nishshanka
 
Childhood Mortality and Morbidity Presentation Slide.ppt
Childhood Mortality and Morbidity Presentation Slide.pptChildhood Mortality and Morbidity Presentation Slide.ppt
Childhood Mortality and Morbidity Presentation Slide.pptMotahar Alam
 

Similaire à MORTALITY IN INFANCY AND CHILDHOOD (2).docx (20)

Vital ASSESSMENT OF NUTRITIONAL STATUS BASED ON VITAL STATISTICSppt
Vital ASSESSMENT OF NUTRITIONAL STATUS BASED ON VITAL STATISTICSpptVital ASSESSMENT OF NUTRITIONAL STATUS BASED ON VITAL STATISTICSppt
Vital ASSESSMENT OF NUTRITIONAL STATUS BASED ON VITAL STATISTICSppt
 
CHILD MORBIDITY AND MORTALITY RATES.pptx
CHILD  MORBIDITY AND MORTALITY RATES.pptxCHILD  MORBIDITY AND MORTALITY RATES.pptx
CHILD MORBIDITY AND MORTALITY RATES.pptx
 
Vital stastics in obg converted
Vital stastics in obg convertedVital stastics in obg converted
Vital stastics in obg converted
 
Ozz(infant mortality rate )
Ozz(infant mortality rate )Ozz(infant mortality rate )
Ozz(infant mortality rate )
 
Demography & health
Demography & healthDemography & health
Demography & health
 
Vital statistics.
Vital statistics.Vital statistics.
Vital statistics.
 
Demography
DemographyDemography
Demography
 
Vital statistics
Vital statisticsVital statistics
Vital statistics
 
CHILD_IMMUNIZATION_IN_INDIA_-final_word_doc
CHILD_IMMUNIZATION_IN_INDIA_-final_word_docCHILD_IMMUNIZATION_IN_INDIA_-final_word_doc
CHILD_IMMUNIZATION_IN_INDIA_-final_word_doc
 
recent advancement in contraceptives
recent advancement in contraceptivesrecent advancement in contraceptives
recent advancement in contraceptives
 
Infant Mortality Rate, perinatal mortality
Infant Mortality Rate, perinatal mortalityInfant Mortality Rate, perinatal mortality
Infant Mortality Rate, perinatal mortality
 
INDICATORS OF MATERNAL AND CHILD HEALTH CARE.pdf
INDICATORS OF MATERNAL AND CHILD HEALTH CARE.pdfINDICATORS OF MATERNAL AND CHILD HEALTH CARE.pdf
INDICATORS OF MATERNAL AND CHILD HEALTH CARE.pdf
 
Child Mortality and Morbidity Rate .pptx
Child Mortality and Morbidity Rate .pptxChild Mortality and Morbidity Rate .pptx
Child Mortality and Morbidity Rate .pptx
 
Demography,unit 5
Demography,unit 5Demography,unit 5
Demography,unit 5
 
Reproductive health
Reproductive healthReproductive health
Reproductive health
 
Demography
DemographyDemography
Demography
 
L01 2010 the growth of world population
L01 2010 the growth of world populationL01 2010 the growth of world population
L01 2010 the growth of world population
 
Lectures note on reproductive health: parte one -Neonatal and Child Health
Lectures note on reproductive health: parte one -Neonatal and Child HealthLectures note on reproductive health: parte one -Neonatal and Child Health
Lectures note on reproductive health: parte one -Neonatal and Child Health
 
An brief introduction to the
An brief introduction to theAn brief introduction to the
An brief introduction to the
 
Childhood Mortality and Morbidity Presentation Slide.ppt
Childhood Mortality and Morbidity Presentation Slide.pptChildhood Mortality and Morbidity Presentation Slide.ppt
Childhood Mortality and Morbidity Presentation Slide.ppt
 

Plus de SambaSukanya

MINOR AILMENTS.pptx
MINOR AILMENTS.pptxMINOR AILMENTS.pptx
MINOR AILMENTS.pptxSambaSukanya
 
sonia lesson plan.docx
sonia lesson plan.docxsonia lesson plan.docx
sonia lesson plan.docxSambaSukanya
 
ram lesson plan proje.docx
ram lesson plan proje.docxram lesson plan proje.docx
ram lesson plan proje.docxSambaSukanya
 
communicationand IPR.ppt
communicationand IPR.pptcommunicationand IPR.ppt
communicationand IPR.pptSambaSukanya
 
FON I UNIT PLAN.docx
FON I UNIT PLAN.docxFON I UNIT PLAN.docx
FON I UNIT PLAN.docxSambaSukanya
 
Helth care- deepak1.doc
Helth care- deepak1.docHelth care- deepak1.doc
Helth care- deepak1.docSambaSukanya
 
LESSON PLAN ON chiken gunya raj (2).docx
LESSON PLAN  ON chiken gunya raj (2).docxLESSON PLAN  ON chiken gunya raj (2).docx
LESSON PLAN ON chiken gunya raj (2).docxSambaSukanya
 
8 Vulval disorders .pptx
8 Vulval disorders .pptx8 Vulval disorders .pptx
8 Vulval disorders .pptxSambaSukanya
 

Plus de SambaSukanya (9)

MINOR AILMENTS.pptx
MINOR AILMENTS.pptxMINOR AILMENTS.pptx
MINOR AILMENTS.pptx
 
sonia lesson plan.docx
sonia lesson plan.docxsonia lesson plan.docx
sonia lesson plan.docx
 
ram lesson plan proje.docx
ram lesson plan proje.docxram lesson plan proje.docx
ram lesson plan proje.docx
 
communicationand IPR.ppt
communicationand IPR.pptcommunicationand IPR.ppt
communicationand IPR.ppt
 
FON I UNIT PLAN.docx
FON I UNIT PLAN.docxFON I UNIT PLAN.docx
FON I UNIT PLAN.docx
 
Helth care- deepak1.doc
Helth care- deepak1.docHelth care- deepak1.doc
Helth care- deepak1.doc
 
LESSON PLAN ON chiken gunya raj (2).docx
LESSON PLAN  ON chiken gunya raj (2).docxLESSON PLAN  ON chiken gunya raj (2).docx
LESSON PLAN ON chiken gunya raj (2).docx
 
8 Vulval disorders .pptx
8 Vulval disorders .pptx8 Vulval disorders .pptx
8 Vulval disorders .pptx
 
3 sexuality.pptx
3 sexuality.pptx3 sexuality.pptx
3 sexuality.pptx
 

Dernier

HMCS Max Bernays Pre-Deployment Brief (May 2024).pptx
HMCS Max Bernays Pre-Deployment Brief (May 2024).pptxHMCS Max Bernays Pre-Deployment Brief (May 2024).pptx
HMCS Max Bernays Pre-Deployment Brief (May 2024).pptxEsquimalt MFRC
 
Sociology 101 Demonstration of Learning Exhibit
Sociology 101 Demonstration of Learning ExhibitSociology 101 Demonstration of Learning Exhibit
Sociology 101 Demonstration of Learning Exhibitjbellavia9
 
How to Create and Manage Wizard in Odoo 17
How to Create and Manage Wizard in Odoo 17How to Create and Manage Wizard in Odoo 17
How to Create and Manage Wizard in Odoo 17Celine George
 
Kodo Millet PPT made by Ghanshyam bairwa college of Agriculture kumher bhara...
Kodo Millet  PPT made by Ghanshyam bairwa college of Agriculture kumher bhara...Kodo Millet  PPT made by Ghanshyam bairwa college of Agriculture kumher bhara...
Kodo Millet PPT made by Ghanshyam bairwa college of Agriculture kumher bhara...pradhanghanshyam7136
 
Mixin Classes in Odoo 17 How to Extend Models Using Mixin Classes
Mixin Classes in Odoo 17  How to Extend Models Using Mixin ClassesMixin Classes in Odoo 17  How to Extend Models Using Mixin Classes
Mixin Classes in Odoo 17 How to Extend Models Using Mixin ClassesCeline George
 
How to Manage Global Discount in Odoo 17 POS
How to Manage Global Discount in Odoo 17 POSHow to Manage Global Discount in Odoo 17 POS
How to Manage Global Discount in Odoo 17 POSCeline George
 
Holdier Curriculum Vitae (April 2024).pdf
Holdier Curriculum Vitae (April 2024).pdfHoldier Curriculum Vitae (April 2024).pdf
Holdier Curriculum Vitae (April 2024).pdfagholdier
 
How to Give a Domain for a Field in Odoo 17
How to Give a Domain for a Field in Odoo 17How to Give a Domain for a Field in Odoo 17
How to Give a Domain for a Field in Odoo 17Celine George
 
Key note speaker Neum_Admir Softic_ENG.pdf
Key note speaker Neum_Admir Softic_ENG.pdfKey note speaker Neum_Admir Softic_ENG.pdf
Key note speaker Neum_Admir Softic_ENG.pdfAdmir Softic
 
Spellings Wk 3 English CAPS CARES Please Practise
Spellings Wk 3 English CAPS CARES Please PractiseSpellings Wk 3 English CAPS CARES Please Practise
Spellings Wk 3 English CAPS CARES Please PractiseAnaAcapella
 
UGC NET Paper 1 Mathematical Reasoning & Aptitude.pdf
UGC NET Paper 1 Mathematical Reasoning & Aptitude.pdfUGC NET Paper 1 Mathematical Reasoning & Aptitude.pdf
UGC NET Paper 1 Mathematical Reasoning & Aptitude.pdfNirmal Dwivedi
 
General Principles of Intellectual Property: Concepts of Intellectual Proper...
General Principles of Intellectual Property: Concepts of Intellectual  Proper...General Principles of Intellectual Property: Concepts of Intellectual  Proper...
General Principles of Intellectual Property: Concepts of Intellectual Proper...Poonam Aher Patil
 
ICT Role in 21st Century Education & its Challenges.pptx
ICT Role in 21st Century Education & its Challenges.pptxICT Role in 21st Century Education & its Challenges.pptx
ICT Role in 21st Century Education & its Challenges.pptxAreebaZafar22
 
Graduate Outcomes Presentation Slides - English
Graduate Outcomes Presentation Slides - EnglishGraduate Outcomes Presentation Slides - English
Graduate Outcomes Presentation Slides - Englishneillewis46
 
Salient Features of India constitution especially power and functions
Salient Features of India constitution especially power and functionsSalient Features of India constitution especially power and functions
Salient Features of India constitution especially power and functionsKarakKing
 
Micro-Scholarship, What it is, How can it help me.pdf
Micro-Scholarship, What it is, How can it help me.pdfMicro-Scholarship, What it is, How can it help me.pdf
Micro-Scholarship, What it is, How can it help me.pdfPoh-Sun Goh
 
Basic Civil Engineering first year Notes- Chapter 4 Building.pptx
Basic Civil Engineering first year Notes- Chapter 4 Building.pptxBasic Civil Engineering first year Notes- Chapter 4 Building.pptx
Basic Civil Engineering first year Notes- Chapter 4 Building.pptxDenish Jangid
 
Dyslexia AI Workshop for Slideshare.pptx
Dyslexia AI Workshop for Slideshare.pptxDyslexia AI Workshop for Slideshare.pptx
Dyslexia AI Workshop for Slideshare.pptxcallscotland1987
 

Dernier (20)

HMCS Max Bernays Pre-Deployment Brief (May 2024).pptx
HMCS Max Bernays Pre-Deployment Brief (May 2024).pptxHMCS Max Bernays Pre-Deployment Brief (May 2024).pptx
HMCS Max Bernays Pre-Deployment Brief (May 2024).pptx
 
Sociology 101 Demonstration of Learning Exhibit
Sociology 101 Demonstration of Learning ExhibitSociology 101 Demonstration of Learning Exhibit
Sociology 101 Demonstration of Learning Exhibit
 
Spatium Project Simulation student brief
Spatium Project Simulation student briefSpatium Project Simulation student brief
Spatium Project Simulation student brief
 
How to Create and Manage Wizard in Odoo 17
How to Create and Manage Wizard in Odoo 17How to Create and Manage Wizard in Odoo 17
How to Create and Manage Wizard in Odoo 17
 
Kodo Millet PPT made by Ghanshyam bairwa college of Agriculture kumher bhara...
Kodo Millet  PPT made by Ghanshyam bairwa college of Agriculture kumher bhara...Kodo Millet  PPT made by Ghanshyam bairwa college of Agriculture kumher bhara...
Kodo Millet PPT made by Ghanshyam bairwa college of Agriculture kumher bhara...
 
Mixin Classes in Odoo 17 How to Extend Models Using Mixin Classes
Mixin Classes in Odoo 17  How to Extend Models Using Mixin ClassesMixin Classes in Odoo 17  How to Extend Models Using Mixin Classes
Mixin Classes in Odoo 17 How to Extend Models Using Mixin Classes
 
How to Manage Global Discount in Odoo 17 POS
How to Manage Global Discount in Odoo 17 POSHow to Manage Global Discount in Odoo 17 POS
How to Manage Global Discount in Odoo 17 POS
 
Holdier Curriculum Vitae (April 2024).pdf
Holdier Curriculum Vitae (April 2024).pdfHoldier Curriculum Vitae (April 2024).pdf
Holdier Curriculum Vitae (April 2024).pdf
 
How to Give a Domain for a Field in Odoo 17
How to Give a Domain for a Field in Odoo 17How to Give a Domain for a Field in Odoo 17
How to Give a Domain for a Field in Odoo 17
 
Key note speaker Neum_Admir Softic_ENG.pdf
Key note speaker Neum_Admir Softic_ENG.pdfKey note speaker Neum_Admir Softic_ENG.pdf
Key note speaker Neum_Admir Softic_ENG.pdf
 
Spellings Wk 3 English CAPS CARES Please Practise
Spellings Wk 3 English CAPS CARES Please PractiseSpellings Wk 3 English CAPS CARES Please Practise
Spellings Wk 3 English CAPS CARES Please Practise
 
UGC NET Paper 1 Mathematical Reasoning & Aptitude.pdf
UGC NET Paper 1 Mathematical Reasoning & Aptitude.pdfUGC NET Paper 1 Mathematical Reasoning & Aptitude.pdf
UGC NET Paper 1 Mathematical Reasoning & Aptitude.pdf
 
General Principles of Intellectual Property: Concepts of Intellectual Proper...
General Principles of Intellectual Property: Concepts of Intellectual  Proper...General Principles of Intellectual Property: Concepts of Intellectual  Proper...
General Principles of Intellectual Property: Concepts of Intellectual Proper...
 
ICT Role in 21st Century Education & its Challenges.pptx
ICT Role in 21st Century Education & its Challenges.pptxICT Role in 21st Century Education & its Challenges.pptx
ICT Role in 21st Century Education & its Challenges.pptx
 
Graduate Outcomes Presentation Slides - English
Graduate Outcomes Presentation Slides - EnglishGraduate Outcomes Presentation Slides - English
Graduate Outcomes Presentation Slides - English
 
Salient Features of India constitution especially power and functions
Salient Features of India constitution especially power and functionsSalient Features of India constitution especially power and functions
Salient Features of India constitution especially power and functions
 
Mehran University Newsletter Vol-X, Issue-I, 2024
Mehran University Newsletter Vol-X, Issue-I, 2024Mehran University Newsletter Vol-X, Issue-I, 2024
Mehran University Newsletter Vol-X, Issue-I, 2024
 
Micro-Scholarship, What it is, How can it help me.pdf
Micro-Scholarship, What it is, How can it help me.pdfMicro-Scholarship, What it is, How can it help me.pdf
Micro-Scholarship, What it is, How can it help me.pdf
 
Basic Civil Engineering first year Notes- Chapter 4 Building.pptx
Basic Civil Engineering first year Notes- Chapter 4 Building.pptxBasic Civil Engineering first year Notes- Chapter 4 Building.pptx
Basic Civil Engineering first year Notes- Chapter 4 Building.pptx
 
Dyslexia AI Workshop for Slideshare.pptx
Dyslexia AI Workshop for Slideshare.pptxDyslexia AI Workshop for Slideshare.pptx
Dyslexia AI Workshop for Slideshare.pptx
 

MORTALITY IN INFANCY AND CHILDHOOD (2).docx

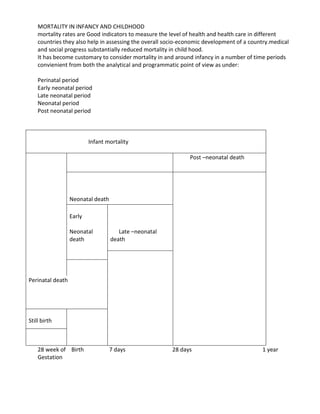
  • 1. MORTALITY IN INFANCY AND CHILDHOOD mortality rates are Good indicators to measure the level of health and health care in different countries they also help in assessing the overall socio-economic development of a country.medical and social progress substantially reduced mortality in child hood. It has become customary to consider mortality in and around infancy in a number of time periods convienient from both the analytical and programmatic point of view as under: Perinatal period Early neonatal period Late neonatal period Neonatal period Post neonatal period Infant mortality Post –neonatal death Neonatal death Early Neonatal death Late –neonatal death Perinatal death Still birth 28 week of Birth 7 days 28 days 1 year Gestation
  • 2. FOETAL DEATH:Foetal death is death prior to the complete expulsion or extraction from its mother of a product of conception,irrespective of duration of pregnancy;the death is indicated by the fact that after such separation the foetus doesnot breathe or show any other evidence of life,such as beating of the heart,pulsation of the umbilical cord,or definite movement of voluntary muscles. STILL BIRTH RATE: The most wide spread use of the term is “death of the foetus weighing 1000g (this is equivalent to 28 weeks of gestation).still birth is given by the formula. Still birth rate= foetal deaths weighing over 1000g at birth × 1000 Total live+ still birth weighing over 1000g at birth It is a frequent occurrence in the developing countries.its prevention involves the detection and treatment of infectious pathology in the course of pregnancy as well as of high blood pressure and its complications,Rh incompatability,diabetes and premature rupture of the membrane.some causes are difficult or impossible to eliminate,such as multiple pregnancies,cord anomalies,foetal malformations,placenta anomalies. Approximately 3.3 million babies are still born each year world wide. PERINATAL MORTALITY RATE: as currently defined,the term perinatal mortality includes both late foetal deaths(still birth)and early neonatal deaths. The WHO definition,more appropriate in nations with less well established vital records of stillbirths is as follows PMR= late foetal deaths(28 week of gestation and more) +early neonatal deaths(1st week)in one year ×1000 Live birth in the same year Number of deaths occurring in the perinatal period (includes stillbirths after 28 weeks of gestation plus the deaths occurring in the first seven days after birth) in a given year to the total number of births (live and still) in the same year. It is also expressed as rate per 1000 total births. For the purpose of inclusion in this rate, the stillbirth or live births should be either (i) > 1000 g in weight, (ii) 28 weeks in gestation or if (i) and (ii) are not available , should measure 35 cm or more in length at birth. More than 6 million perinatal deaths occur each year worldwide; 3.3 million of these happen during late pregnancy and birth while 3 million newborn die in the first week. Whereas Africa has the highest PMR of 75 per 1000 total births, 40 per cent of total perinatal deaths take place in South- Central Asia. Perinatal mortality in these areas results from poor nutritional status of women, insufficient prevention of pregnancy related complications and few supervised deliveries. Some of these causes are rooted in the social, cultural and economic structure of the society.
  • 3. Perinatal mortality is a problem of serious dimensions in all countries.it now accounts for about 90 percent of all foetal and infant mortality in the developed countries.in india,still births are seldom registered.consequently ,most studies on perinatal mortality in this country are hospital based. NEONATAL MORTALITY RATE: neonatal deaths are deaths occurring during the neonatal period,commencing at birth and ending 28 completed days after birth.neonatal mortality rate is the number of neonatal deaths in a given year per 1000 live birth in that year. =number of deaths of children under 28 days of age in a year ×1000 Total live birth in the same year It is the number of neonatal deaths in relation to 1000 live birth per year. Perinatal and neonatal mortality can be used as a measure of socio-economic development and for international comparisons. Of approximately 8 million infant deaths occurring annually, 4 million cn be ascribed to the neonatal period; 98 percent of them in developing countries. More than two thirds of the estimated 4 million neonatal deaths occur in the early neonatal period, ie during first 7 days following birth. Thus, it appears that priority needs to be given to perinatal and neonatal mortality in order to decrease infant mortality. Health measures were previously directed toward decreasing post- neonatal and early childhood mortality thinking that PMR and NMR cannot be brought down by public health measures POST NEONATAL MORTALITY RATE:deaths occurring from 28 days of life to under one year are called post neonatal mortality rate. =number of deaths of children between 28 days and one year of age in a given year ×1000 total live births in the same year Total live births in the same year INFANT MORTALITY RATE: Infant mortality rate is defined as the ratio of infant deaths registered in a given year to the total number of live births registered in the same year,usually expressed as a rate per 1000 live births. IMR= number of death of children Less than 1 year of age in a year × 1000 Number of live birth in the same year It is the number of infant death in a year in relation to 1000 live births during the same period. This is irrespective of the fact that some of those infants who died in this year might have been born in the last few months of the previous year. UN estimates show that that the global IMR has decreased from 87 per 1000 live births during 1975-1980 to less than 50 today.
  • 4. India at the beginning of this century had an IMR of more than 200 per 1000 live births (219 in 1916 – 1920). By 1982 the IMR came down to 100 per 1000 live births. According to 1991 census , the IMR was 80 per 1000 live births. Current IMR for India stands at 58 per 1000 live births per year. This has been mainly due to reductions in post-neonatal deaths. This decline has been made possible due to (i) improvements in the quality of life due to environmental measures; (ii) better facilities for early diagnosis and treatment and prevention of communicable diseases; (iii) better health delivery system; and (iv)improvement in overall nutritional status. Developed countries have shown a greater reduction in infant mortality as compared to child mortality while in the developing worlds, the situation is reverse. CAUSE: Main causes of infant mortality during the neonatal and post-neonatal periods are different. Majority of neonatal deaths are accounted for by low birth weight , infections, birth asphyxia and congenital anomalies whereas post-neonatal mortality occurs primarily due to infections (diarrhea, respiratory infections, vaccine preventable disease) and malnutrition. Low birth weight consequent upon material malnutrition , decreased spacing between births, large family size and a high fertility rate are the principle factors resulting in a high infant mortality. Failure to offer breast milk, non-practising of exclusive breast milk, non-compliance with immunization on account of illiteracy, ignorance, cultural and social beliefs pose the greatest risks of death in the infant. Finally, poverty, poor standards of living, inaccessibility to safe water and proper sanitation contribute in a compounded fashion. PREVENTION: Preventive measures have to be aimed at improving the nutritional status of the mother, providing good and essential antenatal care and ensuring safe delivery. Essential newborn care, promotion of breastfeeding, immunization, early detection of illness (achievable by growth monitoring) and their management are the mainstay for reducing infant mortality. Family planning, efficient services for reproductive and child health, provision of safe water, sanitation, improving the socioeconomic status and providing health education should be carried out on priority basis. We have to strive hard to implement policies for achieving use of ORS, exclusive breast feeding, universal immunization coverage and 100 percent female literacy. Simultaneously, various health programs need constant reinforcement with involvement of NGOs and non-health sector. 1 TO 4 YEAR MORTALITY RATE (CHILD DEATH RATE) Child death rate is the number of deaths of children aged 1 to 4 year per 1000 children in the same age group in a given year.it thus excludes infant mortality. =no.of deaths of children aged 1 to 4 years during a year ×1000 Total no.of children aged 1-4 years at the middle of the year UNDER FIVE MORTALITY RATE UNICEF defined this as the annual number of deaths of children age under 5 years,expressesed as rate per 1000 live births.
  • 5. =number of death of children less than 5 years of age in a given year Number of live birth in the same year This is expressed as a sum of infant mortality rate and child mortality rate. It is an indicator of well- being of all children below the age of five years. It is useful for investigating effectiveness of various public health interventions. It also reflects income and education of parents, the prevalence of malnutrition and disease, availability of clean water, the efficacy of health services, and the health and status of women. Under 5 mortality rate decreased from 146/1000 in 1970 to 79/1000 in 2003. A total of 10.6 million children are dying every year in the world, prior to attaining 5 years of age. COLLECTION OF VITAL STATISTICS The vital statistical system deals with the individual's entrance into and departure from the world and with change in the marital status. The concerned events are birth, death, marriage and divorce. It is useful in so'cioeconomic planning and in planning of health and family welfare services. In India vital statistics are obtained from (i) Population census (ii) Civil registration system (iii) Sample registration system (iv) Adhoc sample surveys (v) Rural survey of cause of death (vi) Medical certification of causes of death (vii) Institutional records, etc. Sources of Data 1. Population Census Census means the enumeration of the total population of the people in a country at a given moment of time. It is defined by the United Nations as "the total process of collecting, compiling and publishing demographic, economic and social data pertaining at a specified time or times to all persons in a country or a delimited territory." The process of completing the census on the night was not operationally feasible to enumerate all individuals. Since 1941, the system accounted for all individuals permanently resident at one place, irrespective of whether he was present there or not at that particular time. This is the deJure system which is followed till date. The last census was performed in Feb.-March 2001. The census provides useful demographic and social data about age, sex, marital status, language, education, occupation, economic status, place of birth, number of children born alive to a woman, etc. Such data are useful for: a. Socioeconomic planning and planning of health and family welfare services. b. Finding the growth rate of population. c. Calculating the indices like birth, death and morbidity rates. Problems in census operation Errors may creep in census data due to the following shortcomings at the data collection stage:
  • 6. 1. The terms used in the proformas for collection of information may be interpreted differently by different enumerators. 2. There is shortage of trained manpower to collect and process the information. 3. Census field work is extremely tedious. Dishonest field workers manipulate figures to give wrong results. 4. Many people do not give correct information due to failure on the part of the investigator to establish proper rapport with them. 5. Age is often recorded in multiples of 5 years. The importance of recording actual age is not understood by the investigators. Since the census is a costly exercise in terms of men, 2. Registration of Vital Events It is done on a continuous basis by various agencies responsible for vital statistics in different states. These agencies are of four types - Panchayat, Revenue, Police, and Health. In some states (e.g. Bihar, UP, Rajasthan) the information about birth and death is collected by the Panchayat system. In states like Andhra Pradesh, Tamil Nadu and Karnataka, this information is collected through the revenue system (Tehsildar, village munsif, etc.). The police is responsible for this activity in states like Haryana, Punjab and J&K.Oddly enough,this information is directly collected by the health department only in a few states (Kerala, Orissa and West Bengal). This inspite of the fact that the occurrence of life and death are of primary concern to the health sector. The civil registration system is shown in the diagram below: personinch Level Registrar-general centre Director,health services/director of economic and statistics State District co officer district Registration of birth and death Registrar-general of india Chief registrar of birth and deaths District registrar
  • 7. registrar Tehsil/block/town Rura Village/institution Village chowki dar/sch ool teacher/hospital/maternity home It is obvious from the foregoing that there is no uniformity in the system of reporting of births and deaths. This is further reflected in the fact that even at the state level, this information is centralised variously either at the level of Director of Health or the Director of Statistics. The State Directors send the information to the Director- General of Health. Services and Registrar-General in Delhi, who,in turn supply necessary reports to the WHO and other international agencies. Voluntary registration of vital events started in India after the passage of the Birtl).s, Deaths and Marriages Registration Act in 1866. Some erst while states like Madras and Mysore made the registration compulsory. Earlier, over 30% of births and notifiable infectious diseases like smallpox, cholera and plague went unrecorded due to defects in reporting and registration of vital events. The problems included lack of interest and illiteracy on the part of parents, indifference on the part of reporters and registrars who were poorly paid, poor communications, etc. Registration improved to some extent after responsibility was passed onto the Panchayats. Still, compared to the data obtained from sample surveys, the proportion of unregistered events was pretty high and the registered data was not reliable. Hence, the Government of India passed the Registration of Births and Deaths Act, 1969. It provides for compulsory registration of births within the period notified. This period is 21 days in Delhi both for births and deaths. . 3. Notificationof Diseases Notificationof certain communicable diseases is compulsory throughout India on the part of Panchayat Secretaries in villages and doctors in towns. These records are maintained by the District and Municipal Health Officers in districts and towns, the Directors of Health Services in the states and the Director-General of Health Services at the center. The epidemiological statistics of communicable diseases is collected from the National governments by the regional offices of the WHO and are published periodically in the form of the Annual and Monthly Epidemiological and Vital Statistics Records and the Weekly Epidemiological Records. The diseases to be notified vary from country to country and from region to region within the same country. The three diseases that are internationally notifiable to the WHO at present are cholera, plague, and yellow fever. 4. Institutional Records Hospitals, primary health centres and maternity homes prepare monthly returns of indoor and outdoor cases and send them to the State Director. 'These data are biased but give a gross picture of the Sub-registrar
  • 8. diseases prevalent in the catchment area of the institution and are often used to assess hospitals needs and efficacy of certain therapeutic measures. 5. Community Surveys Health, nutrition and morbidity surveys are conducted in certain communities from time to time. These surveys,if conducted properly using sound sampling proced.ure and epidemiological principles, are a very useful source of information. Community surveys may also be carried out specifically to find the prevalence or incidence ofspecific conditions such as tuberculosis, leprosy, malaria, cancer, obesity, protein, energy malI1utrition and goiter. 6. National Sample Survey The National Sample Survey (NSS), started in 1950-51, is a continuous activity undertaken by the Central Government on all India basis to collect data relating to social, economic and demographic aspects. The National Nutrition Monitoring Bureau (NNMB), located at the National Institute of Nutrition, Hyderabad, is specifically engaged in collecting nutritional data in the field on a predefined sample. Other central agencies concerned with various statistical data, including vital statistics, are Central Statistical Organisation (CSO), Registrar-General of India and the Bureau of Health Statistics within the Central Ministry of Health. 7. Sample Registration System (SRS) In the absence of dependable data term Civil Registration, the office of the Registrar-General of India initiated a scheme of sample registration of births and deaths in 1964-65 in a few selected states. Now this system covers the entire country. It is based upon a dual recording system comprising of continuous registration of vital events.along with half-yearly retrospective survey, each providing a check on the other. The main objective of the system is to provide reliable estimates of vital rates at the state and nationalleve!. The essential features of SRSare: a. A base-line survey of the sample unit to obtain the usual resident population of the sample area through household schedule. b. Continuous (longitudinal) enumeration of vital events pertaining to the usual resident population by a locally resident enumerator. This continuous enumeration is done by part time enumerators, who are generally school teachers paid an honorarium for this work. Each enumerator appoints specified informants in his area and whenever ittformation is provided, he visits the specified household. In addition, he conducts fortnightly visits. c. An independent yearly survey of births and deaths by an investigator (supervisor) who is a full time employee. Each supervisor is in-charge of 12enumerators. d. Matching of events reported by the two systems. e. Field reverification of unmatched and partially matched events. . The sample unit in rural areas is a village or a segment if the village has a population of 1500 or more. In urban areas, the sample unit is a census enumeration block with a population ranging from 750-1000. At present SRS covers 6671 sample units (4436 rural and 2235 urban) in all the States and Union Territories of India covering 1.1 million households and a population of about 6 million. 8. Model Registration System Generation of morbidity statistics forms an integral part of vital statistics system. However, due to paucity of qualified medical personnel in rural areas, medical certification of cause of death is not feasible in India. A conference on improvement of vital statistics was held in April 1961. Based on its
  • 9. recommendations, the Registrar-General of India initiated in 1965 a scheme called Model Registration Scheme on a limited scale. This scheme is now known as "Rural Suroey of Cause of Deaths." Currently, this scheme covers more than 1000 PHCs and seeks to collect data on causes of death, through paramedical personnel, in the headquarters village of the PHC only. The deaths are classified according to an. adopted nonmedical list. It is not a sample survey as the units are not selected randomly but according to convenience. The causes of death reported are checked by the medical officer of the concerned PHC and every 10th death is verified by the 9. Miscellaneous Sources These include health departments of factories and insurance companies. International Definitions In 1953, the United Nations approved the principles for a Vital Statistics System. The guidelines for this were published in 1955. These were aimed at helping the member countries to develop a uniform system of registration, interpretation and comparison of vital events. Various vital events have been defined by the WHO asfollows: Live birth Live birth is the complete expulsion or extraction from its mother of a product of conception, irrespective of the duration of pregnancy, which, after such separation, breathes or shows any other evidence of life, such as beating of the heart, pulsation of the umbilical cord, or definite movement of voluntary muscles. Whether or not the umbilical cord has been cut or the placenta is, attached, each product of such a birth is considered live-born. It may be mentioned that under the Indian "Registration of Births and Deaths Act, 1969" birth includes both live birth and stillbirth. Fetal death Fetal death is death prior to the completeexpulsion or extraction from its mother of a product of conception, irrespective of the duration of pregnancy. The death is indicated by the fact that, after such separation, the fetus does not breathe or show any other evidence of life, such as beating of the heart, pulsation of the umbilical cord or definite movement of voluntary muscles. Stillbirth It is synonymous with late fetal death, i.e. twenty-eight completed wise of gestation. Immaturity (prematurity) In international classification of disease, an immature infant is a live born infant with a birth weight of 2500 g (5.5 Ibs) or less. In some countries a live-born infant with a period of gestation less than 37 weeks is specified as 'premature' regardless of weight. Such premature infant may be considered as 'immature' in International Classification. Death "Death is the permanent disappearance of all evidence of life at any time after live birth has taken place" (postnatal cessation of vital functions without capability of resuscitation). Infant deaths Deaths under one year of age. Neonatal deaths Deaths occurring under 28 days of age. Perinatal deaths Deaths occurring after 28 weeks of fetal life and within 7 days after birth. It is often difficult to know the correct fetal age. In such situation, fetal weight of 1000 gill is considered to represent gestational age of 28 weeks, as suggested by the Ninth Revision (1975) of International Classification of Diseases. If both gestational age and birth weight are unknown, then a body length (crown to heel) of 35 cm is taken as equivalent to 28 weeks gestational age. Maternal deaths Deaths associated with complications of pregnancy, childbirth and puerperium. General Practitioner and Vital Statistics The general practitioner can play an important role in improving the registration of vital events and collection of health statistics as described below: BirthsThemedical man often attends upon a pregnant woman during antenatal, natal or postnatal period. He is also called upon to treat the infant.
  • 10. He is aware of the fact of birth and is also conversant with the mode of notification and its importance. Deaths He should certify the cause of death in the prescribed form for death certificate which he should send to the Registrar. Notifiable morbidity He should notify all notifiable diseases properly and correctly to health authorities International Death Certificate All medical practitioners should be familiar with the filling of the International Certificate of Death. ANALYSIS OF VITAL DATA Calculation of Vital and Health Indices Vital and morbidity indices are calculated as "rates" or ratios", using the mid-year population (i.e. on first July) as a denominator. Mid-year Population Three methods are used to find the mid-year population: 1. Natural Increase Method This is done by adding the increase due to births and immigration to the last census population and subtracting from it the loss due to deaths and emigration. This method requires cent per cent recording of births, deaths, and migration and is not practicable in our country. 2. Arithmetic Progression Method It is assumed that population increases equally in each year of the intercensal period. It is found by the formula: Pn =PC1+ a (PC2 - PCl)/10 where Pn denotes mid-year population of any given year. PCI and PC2 indicate the population of the last two censuses and a is the period in years after the last census. 3. Geometric Progression Method Here it is assumed that population increases like compound interest and the rate of growth is geometric and not arithmetic. If 'PC is the population of any census year and 'r' is the rate of increase per year per person in the intercensalyears, then mid-year population at the year will be P (1+ r)n . This is certainly a better method. Population Density This is measured in terms of the number of people per square km in a particular year. The population density in India was 324 in 2001. Population Pyramid It is a broad based conical pyramid because of high birth rate and tapering of population with increase in age. In countries with low birth rate, the pyramid swells in the middle, is narrow at the base, and is not so conical at the top (dumb bell shaped "pyramid"). Rates and Ratios The rates are usually calculated from the total events occurring in a geographical area over a period of a calendar year. They are hence annual rates and are of two types, crude and specific: Crude rate is based on total population while a specific rate is based on the population group specified on the basis of age, sex, occupation, etc. INTERPRETATION, CONCLUSIONS, AND RECOMMENDATIONS Biased conclusions due to defects in registration, collection, and compilation are very likely. When the records are not reliable, it is better to carry out sample surveys, following strictly the rules for selection and inquiry.
  • 11. Birth and Fertility Rates High crude birth rate and fertility rate indicate rapid increase in population, which calls for birth control measures. If the birth control measures are effective, there should be a fall in birth rate and fertility rate. There are some indices that may indicate a fall in birth rate when other vital statistics are lacking or are not reliable. These include: a. Child woman ratio = Children under 5 years Women aged 15-49 b. Percentage of births of higher order such as fourth and more-If it is low, it means family planning is effective. c. Average interval between births-longer in travel indicates fall in birth rate. d. Pregnancy rate –pregnancies to women of child bearing age × 100 total years of exposure Death Rates Cn..de death rates can be greatly affected by age-sex distribution. Hence they should be standardised before drawing conclusions or making comparisons from place to place. Crude death rate in a colony of retired people will be very high while in a new township developed near an oil refinery and inhabited mostly by young people, it will be very low. Standardized death rates can be calculated by two methods, direct and indirect, as described below. It should be pointed out that these methods of standardisation are not unique to death rates and can also be used for comparing other events, such as morbidity rates. 1. Direct Standardization In this method the age specific death rates in the community under study are applied to various age groups in . the standard population. Their total gives the standarised mortality rate for the population under study. The reference population is usually the population of the whole country. This enables comparison of rates in two 2001censusdata analysisnot availableso far communities within the country. However, an inter national standard population has to be used for comparison of rates within countries. 2. Indirect Standardization The direct method necessitates the knowledge of age specific death rates in the population studied before the results can be standardised. Sometimes this information may not be available. At other times, the population size may be too small, especially in certain age groups, with the result that age- specific death rates may fluctuate widely with slight variation in the number of deaths in the particular category. In such situations, the indirect method of standardisation is used. The information required for using this method is the age structure of the study population and the age specific death rates of the standard population. Sex Ratio This is the ratio of females to males. It is expressed as the number of females per 1000 males in a population. Ordinarily speaking, sex ratio should be more than 1. This is because women have slightly longer lifespan than men. Sex ratio in developed countries is more than one, Le., there are more women than men. The ratio in many developing countries, including India, is less than one. There are 933 females per 1000 males in India." Sadly, the ratio has been consistently falling in India since the beginning of this century. *It is a happy indication that the current value is an improvement on the 1991 sex ratio of 923. It is obvious that women have more innate survival capacity
  • 12. biologically, yet they experience higher mortality because of environmental factors (mainly social environment).