2. 6 2 A Dimension-Based Approach to Mouth-to-Ear Speech Transmission Quality
human mouth-to-ear speech transmission human
source sink
sink source
Fig. 2.1 Two-party speech communication
lungs for airflow provision, the larynx with its glottis is used primarily for airflow
“control”, whereas the vocal tract serves for modulation of the airflow through its
articulators (O’Shaughnessy 2000, pp. 35–48). This way, speech sounds are produced
and emitted primarily from the mouth of the speaker. Speech sounds, as all sounds,
physically emerge in form of mechanic vibration or (longitudinal) mechanic waves,
see Blauert and Xiang (2008). Speech is physically characterized by an average
sound intensity level between 55 and 75 dB rel. 10−16 W/cm2 for normal speak-
ing. The long-term average speech spectrum shows lowpass behavior and ranges
approximately from 50 to 10000 Hz. Between 100 and 600 Hz, that is, including the
fundamental frequency and the first formant, the energy is highest (Denes and Pinson
1993, pp. 139–145).
For the moment, the speech transmission system is represented by a “black box”
comprising all transmission elements from the mouth of the speaker to the ear of
the listener. In direct face-to-face communication, the speech transmission “system”
is a purely acoustic sound field. Under free-field conditions, it is the direct air path
“mouth to ear”. The acoustic waves, emitted by the mouth of the speaker, represent the
vehicle carrying the information from the speaker (information source) to the listener
(information sink). The information is encoded in the sound pressure variations as
a function of time and space as a purely physical phenomenon that is studied in the
field of “pure” acoustics (Blauert and Xiang 2008). The waves eventually arrive at
the listeners ear(s) as an attenuated version of the original acoustic signal (assuming
an otherwise noise-free and free-field environment).1
Telecommunication via speech is enabled by speech-communication technology,
partially replacing the natural air-path and aiming at “supporting natural communica-
tive possibilities [...] by means of technical devices and facilities” (Jekosch 2005b,
p. 23). This comprises elements such as user terminals (electro-acoustic transducers),
codecs, transmission facilities (e.g., circuit-switched or packet-switched networks),
and other signal processing units. Most generally, according to Shannon (1948),
transmission of information in technical terms consists of a transmitter, a (noise-
prone) channel, and a receiver in order to enable telecommunication.
1 Gestures as a part of human face-to-face communication are disregarded in this consideration,
although they become more important, for example, in video telephony. The present work is focused
solely on acoustic speech communication.
3. 2.1 General Research Scenario 7
The transmitted speech signal finally arrives at the listener’s outer ear(s) as a
modified version of the source signal, whereas the modification depends on the
transmission channel the signal traversed. Much is known about the sound reception
involving the human hearing system on both a physiological and neuro-physiological
level (Denes and Pinson 1993, p. 80). The pinna of the outer ear supports localiza-
tion of acoustic events, for example. The acoustic waves travel through the ear canal
and excite the ear drum, which in turn is connected to the chain of the ossicular
bones hammer (malleus), anvil (incus), and stirrup (stapes) of the middle ear. Here,
the acoustic vibrations are converted to mechanical vibrations, where the mechan-
ical impedance of the entrance point of the inner ear, the membrane of the oval
window, is matched through impedance transformation between air and the inner
ear liquid (endolymph in the scala media, perilymph in the scala vestibuli and the
scala tympani; the Reissner membrane and the basilar membrane form the bound-
aries to the scala media, respectively). The cochlea of the inner ear is basically
a tube filled with these liquids. Its function is the transformation of the arriving
vibrations in form of mechanical energy into electrical excitation (electrical energy)
on the auditory nerve fibres (so-called “firings”). The neurons are mainly affer-
ent, leading to the central nervous system. The basilar membrane with the organ
of Corti resting on it contains sensory hair cells connected with the auditory nerve
and performs a spectral decomposition through frequency-to-place transformation,
which is of non-linear nature (see, e.g., Denes and Pinson 1993, pp. 131–137).
Details on the anatomy and physiological as well as neuro-physiological mecha-
nisms can be found, for example, in O’Shaughnessy (2000, pp. 109–119) or Purves
(2008). Finally, the transformation of the neuronal representation into a linguis-
tic message interpretable by the listener completes the brain-to-brain information
transmission.
Perception takes place on a psychological level. The field of study concerned
therewith is psycho-acoustics, that is, the study relating acoustic events in the phys-
ical realm to auditory events in the perceptual space (Blauert and Xiang 2008). For
instance, much research has been done in psycho-acoustics of fundamental sounds
such as tones and noise (e.g., Zwicker and Fastl 1999), including perception thresh-
olds, pitch perception, masking, and localization.
Speech, as language in general, can be considered as a system of signs, where
“a sign is a mental unit, which is processed as standing for something other than
itself” (Jekosch 2005a). In terms of semiotics, the science of signs, a sign can be
modeled, for example, by the triad of (a) sign carrier, (b) the object the sign stands
for, and (c) its meaning. These constituents of a sign cannot be regarded in an isolated
way, as for example the content has an influence on speech perception as well as the
sign carrier. The present work focuses on the perception of transmitted speech in
terms of its perceived quality and, in particular, the underlying perceptual dimen-
sions. Thereby, the research presented in this work mainly is concerned with the
acoustic speech signal as the sign carrier, that is, the form or the surface structure.
Quality and its determining features can in this context also be seen as “additional
factors governing speech perception”. In telephony, “the user’s appreciation of a
4. 8 2 A Dimension-Based Approach to Mouth-to-Ear Speech Transmission Quality
particular connection” (Raake 2006, pp. 13–14) can be influenced, for example, by
unwanted distortions of the signal, that is, the sign carrier. Speech quality can thus
be understood as “extending the comprehension-oriented view on speech”: “Quality
might not be perfect although the comprehension is reliable” (Raake 2006, pp. 13–
14), whereas depending on the severity of the distortions, also comprehension might
suffer.2
The central assumption of the present work is the notion that speech quality
can be explained by its underlying perceptual features (Jekosch 2005b, pp. 11–21),
both influenced by elements of the transmission path and perception processes of
the recipient. Given that these features are measurable, they allow to diagnose and
model integral speech quality. Moreover, given that the quality-relevant elements
can be quantified and brought into relation with the perceptual features, both these
features and integral quality can be instrumentally estimated. The relations between
integral quality and its dimensions, as well as between technical parameters and
the dimensions, are assumed to be describable by empirical functions. They can
be illustrated on the basis of a “black box” schematic of the listener of transmit-
ted speech. Therefore, the schematic depicted in Fig. 2.1 will be further extended
by the building blocks of speech transmission technology and speech quality per-
ception with a level of detail appropriate for the further investigations presented in
this work.
In the next two sections it is shown how today’s speech transmission tech-
nology might affect a speech signal in the physical domain (Sect. 2.2), and how
this translates into the perceptual domain as perceptual dimensions and eventu-
ally overall quality (Sect. 2.3). Moreover, the terminology necessary for the precise
formulation of the research topics that are dealt with in this book is introduced.
In Sect. 2.4, selected auditory measurement methods and measurement implica-
tions with human listeners as measuring organs are presented. The dimension-based
quality-modeling approach is introduced in Sect. 2.5, whereas important instrumen-
tal quality measures and measurement approaches are presented in Sect. 2.6. The
resulting research topics aiming at an instrumental dimension-based quality model
are summarized in Sect. 2.7 and constitute the basis for the following chapters of
this book.
2 Speech comprehension is related to several other terms. A message to be comprehended by
the recipient, besides her/his willingness to do so, depends on a series of factors. Given that the
percentage of correctly identified word fragments, syllables, phonemes, and meaningless words of a
transmission path is measured by articulation, articulation is the prerequisite for comprehensibility.
Comprehensibility describes how well the speech signal, that is, the sign carrier, is capable to
convey information. Comprehensibility, in turn, constitutes the prerequisite for intelligibility, itself
describing the percentage of correctly identified meaningful words, phrases, or sentences. In parallel,
communicability refers to how well a message can serve to communicate. Context as well as
recipient’s knowledge factors influence the process of comprehension (whereas the definition of
context depends on the level of comprehension). For more information, see Raake (2006, pp. 9–11),
Jekosch (2005b, pp. 97–102), and Möller (2000, pp. 26–27).
5. 2.2 Speech Transmission in Telecommunication 9
2.2 Speech Transmission in Telecommunication
2.2.1 Introduction
This section provides an overview of the physical and speech—technological
elements of the transmission path between the mouth of the speaker and the ear
of the listener, that is, the middle block in Fig. 2.1. As it will be seen, these elements
might have various impacts on the transmitted source speech signal, which eventu-
ally affect the perception of the received signal by the listener in terms of quality and
its features, as discussed in Sect. 2.3.
Figure 2.2 provides a more detailed though still simplified view on the mouth-to-
ear speech transmission system.
A speech communication system is a special case of the schematic of a general
communication system (cf. Shannon 1948 and Richards 1973, pp. 14–19), consist-
ing of a transmitter (sender), a transmission channel, and a receiver, connected in
cascade. Information source and sink are the human beings communicating with
each other (see Fig. 2.1, omitted in Fig. 2.2).3 In mouth-to-ear speech transmission,
all elements can be affected by noise or other phenomena causing distortions (e.g.,
room reflections in the sound field, frequency characteristics of the transducer, radio
interference on the channel). The system in Fig. 2.2 is assumed to be symmetric in
both directions. In real-world scenarios, however, this assumption does not necessar-
ily hold, for example, due to different terminal equipment used by the conversation
partners or different channel paths.
mouth-to-ear speech transmission
TD TX RX TD
MRP ERP
sound sound
channel
field field
TD RX TX TD
ERP MRP
noise and other phenomena causing distortions
Fig. 2.2 General transmission system (Shannon 1948) and extensions based on Blauert and Xiang
(2008). MRP Mouth reference point, ERP Ear reference point, TD Transducer, TX Transmitter, RX
Receiver
3 The terms transmitter and receiver are ambiguous as they may also refer to the human beings. In
order to avoid confusion, the technical entities for sending and receiving signals may also be called
sending and receiving apparatus, respectively (Richards 1973, p. 14).
6. 10 2 A Dimension-Based Approach to Mouth-to-Ear Speech Transmission Quality
In the present work, speech transmission designates the path from the mouth of
the speaker to the ear (or the ears) of the listener. More precisely, the point in space
right in front of the mouth of the speaker corresponds to the Mouth Reference Point
(MRP) as defined in ITU-T Rec. P.64 (2007, Annex A), which is located at a distance
of 25 mm in front of the lips. The speech transmission ends at the entrance of the
ear canals, the Ear Reference Points (ERPs) as defined in ITU-T Rec. P.64 (2007,
Annex A). As a consequence of this definition and according to Blauert and Xiang
(2008), the communication “system” also comprises “pure” acoustics, that is, the
soundfields existent at send side between the MRP and transmitter and at receive
side between receiver and the ERPs.
The elements involved in telephony are described in the following sections. A fun-
damental concept for planning and describing systems in classical telephonometry
are so-called loudness ratings. A loudness rating is a scalar value in decibels and
denotes the insertion loss of a reference system that yields a perceived loudness that
is equivalent to the loudness of the unknown system under investigation.4 Loudness
ratings can be measured in auditory experiments (ITU-T Rec. P.78 1996) or they can
be calculated based on weighted amplitude spectra measured in the ISO-preferred
1/3-octave bands (ITU-T Rec. P.79 2007). The attenuation between the MRP and the
transducer (electrical interface in the transmission path) is denoted by send loudness
rating (SLR), whereas the attenuation between the transducer and the ERP is denoted
by receive loudness rating (RLR). Loudness ratings are additive, that is, the sum of
loudness ratings of the subsystems of a transmission system is approximately equal
to the overall loudness rating (OLR) of the system, for example, OLR = SLR + RLR.
See Möller (2000, pp. 19–26) for more details.
2.2.2 Mouth to Channel
Figure 2.3 depicts in an illustrative way the situation of a user located in a soundfield
using a hands-free terminal.
If no free-field conditions can be assumed, the room in which the communicating
person resides has an influence on the speech signal y to be transmitted and on
the speech signal x that is received.5 These effects are particularly prominent if
hands-free terminals (HFTs) or hands-free capabilities of standard user terminals
are employed. In contrast to handsets or headsets with a close-talking microphone
located directly at the MRP and the loudspeakers (more or less well coupled) located
4 In traditional narrowband telephony, the (modified) intermediate reference system (IRS) is used
as a reference (see ITU-T Rec. P.48 1988 and ITU-T Rec. P.830 1996, Annex D). For wideband
telephony (50–7000 Hz), frequency weights are given in ITU-T Rec. P.79 (2007, Annex G) for a
reference system that yields a loudness rating of 0 dB when compared to an IRS.
5 For simplicity reasons, no difference is being made between variables denoting signals in the time-
continuous domain and the time-discrete domain. That is, x might represent the continuous signal
x(t), t ∈ R, or the discrete version x(k), where t = kT and T = 1/ f s . f s denotes the sampling rate
and k ∈ Z. Moreover, the amplitude of time-discrete signals is assumed to be quantized.
7. 2.2 Speech Transmission in Telecommunication 11
Fig. 2.3 Human being located soundfield
in a soundfield using a hands-
noise n
free terminal (modified from
ERP
Vary et al. 1998, Fig. 13.1).
Black arrows: acoustic waves
captured by the transducer. s
Gray arrows: acoustic waves y = s+ n+ x
˜
captured by the human being MRP
echo x
˜
x
noise n
directly at the ERP, loudspeaker and microphone(s) of HFTs are most often located
with a significant distance to the ERP(s) and MRP, respectively. In this section, it
is focused on the signal y to be transmitted and its components according to the
acoustic situation in the room at send side, that is, distortions that might provoke
a degradation of perceived quality for the far-end listener. These components are
represented by the black arrows in Fig. 2.3.6
In particular, depending on the room and microphone characteristics, early and late
reflections might be captured by the microphone of the transmitter and superimpose
the speech signal at the MRP (the speech signal and possible reflections are subsumed
by s). As there is always a certain distance between mouth and microphone, this can
easily also occur for non-hands-free terminals. Another prominent effect, especially
in hands-free telephony, stems from the acoustic coupling between loudspeaker and
microphone. The received signal x of the far-end speaker emitted by the near-end
loudspeaker is transmitted through the room (including reflections) and is fed as
˜
a modified version x to the microphone as an interfering signal. Without counter-
measures, the far-end interlocutor hears her/his own voice delayed while speaking
(talker echo; a listener echo might occur in rare cases, see Möller 2000, p. 32, if
the signal is reflected twice, that is, at both the near end and the far end). Moreover,
environmental (or background) noise n of different kind might superimpose the
sending signal. From the near-end person’s perspective, these effects sum up through
superposition to a sending signal y = s + n + x (see Vary et al. 1998, p. 430 and
˜
Vary and Martin 2006, p. 506).
The (distorted) acoustic signal y is transformed into a proportional electrical
signal by the electro-acoustic transducer (microphone), see Fig. 2.2. For auditory
6 The acoustic properties of the room also have an influence on the receiving signal x, which, as
a result, affects perception. These sound field components are represented by the gray arrows in
Fig. 2.3 and are briefly discussed in Sect. 2.2.4.
8. 12 2 A Dimension-Based Approach to Mouth-to-Ear Speech Transmission Quality
tests as well as in narrowband telephonometry, the transducer’s transfer functions
in send and receive direction are often generalized to a model of common handsets,
the (modified) Intermediate Reference System (IRS), see ITU-T Rec. P.830 (1996,
Annex D). Apart from that, the transducers consist of input and output entities,
which are often interconnected by a sidetone path. Considerations of the influence
of terminal equipment are given in Sect. 2.2.4.
For speech transmission, as for media transmission in general, there is a clear trend
towards the utilization of a unified, “All-IP” network. Motivated by this prospect,
it is focused on packet-based transmission in the following.7 Figure 2.4 depicts
a schematic of an example realization of a VoIP transmitter/receiver-combination.
Practical realizations might deviate from this simple schematic, however, it comprises
the major elements of the technology encountered today.
Common to practically all transmitters in today’s terminal equipment is the
analog-to-digital conversion (including the obligatory anti-alias low-pass filter) of the
input signal y. More precisely, the time- and amplitude-continuous signal y(t) is low-
pass filtered with a cut-off frequency of at most 1/2· f s , where f s is the sampling rate,
sampled and quantized, resulting in the time-discrete and amplitude-discrete signal
y(k). As a next step, several signal processing routines such as noise reduction and
acoustic echo cancelation are usually invoked as “counter-measures” for different
transmitter / receiver
A y s F
+ NR ENC FEC
D - P
x
AEC channel
jitter buffer
A x F
ABE ECN DEC ECR
D P
noise and other phenomena causing distortions
Fig. 2.4 Schematic of a possible realization of a single-input single-output VoIP transmit-
ter/receiver, based on Raake (2006, Fig. 3.3), Vary and Martin (2006, Fig. 1.1), and Perkins (2003,
Figs. 1.2 and 1.3). A/D Analog to digital conversion, AEC Acoustic echo cancelation, NR Noise
reduction, ENC Speech encoding, FEC Forward error correction, F/P Packetization (frame to
packet), ECR Error correction, DEC Speech decoding, ECN Error concealment, ABE Artificial
bandwidth extension. See text for details
7Complementary information on Voice over IP (VoIP), in particular with regard to the time-varying
behavior of packet-based networks and the resulting effects, can be found in Raake (2006).
9. 2.2 Speech Transmission in Telecommunication 13
kinds of distortions potentially occurring up to this point in the transmission path.8
Speech signal processing routines, including most speech codecs, are usually real-
ized in a block-oriented way and process speech frames of limited duration (typically
20 ms, e.g., 160 samples with f s = 8 kHz) due to the quasi-stationary character of
speech in this time interval.
The aim of acoustic echo cancelation (AEC) is to prevent the signal x from ˜
being transmitted to the far-end interlocutor, see Vary et al. (1998, pp. 429–464) and
˜
Vary and Martin (2006, pp. 505–568). The signal x appears in the transmitter as a
component of the sending signal y and it is a modified and delayed version of the
received signal x appearing in the receiver. Thus, AEC requires an interconnection
between transmitter and receiver at each side of the communication system. The
˜
cancelation of x can be achieved by a voice-controlled echo suppressor: In sending
and receiving direction, attenuators are adaptively applied depending on whether
the near-end or far-end interlocutor is active. This often prevents the interlocutors
from double talk, which, however, belongs to natural human communication and
is thus desirable. More sophisticated echo cancelation approaches (where double
talk is possible) are based on an estimation of the impulse response of the linear
time-variant loudspeaker-room-microphone system. The compensation is done by
˜
an adaptive filter estimating x and subtracting the estimate from y. Although the
impulse response is in principle infinite, usually, finite-impulse-response (FIR) filters
are used for this task as an approximation. The filter length (and thus the complexity)
depends on the sampling rate f s of the microphone signal y, the distance between
loudspeaker and microphone, and the room acoustics. In practice, the parameters
talker echo loudness rating (TELR) in decibels, which describes the level difference
between the far-end speech signal and the echo, together with the mean one-way
delay T of the echo path are often used for specifying the requirements of AECs,
evaluating AECs, and in overall network planning (see Appendix B). Less common
are listener echoes, quantified with the weighted echo path loss (WEPL) in decibels
in conjunction with the round-trip delay Tr . More details on the large field of AEC
can be found, for example, in Vary et al. (1998, pp. 429–464) and Vary and Martin
(2006, pp. 505–568).
Noise reduction (NR) aims at eliminating the noise component n from the signal
y. This can either be done in the time-domain by Wiener filtering or in the spectral
domain (although both approaches are related, see Vary et al. 1998, pp. 377–428
and Vary and Martin 2006, pp. 389–504). For the latter, a practical approach to noise
reduction is spectral subtraction (Boll 1979) of a noise floor estimate from an estimate
of the spectrum of the noisy signal (Vary et al. 1998, pp. 387–397, Vary and Martin
2006, pp. 400–402). Due to the non-stationary character of the speech signal, this
is done frame-wise for short-time spectra and can also be done in conjunction with
the Wiener filter. The plain subtraction of the spectra potentially leads to (a) speech
signal distortions and (b) a randomly fluctuating residual noise due to estimation
8 Speech distortions that originate from early or late room reflections at send side are not compen-
sated. In Brüggen (2001), however, methods are proposed for “sound decolorization” applicable in
HFT-telephony.
10. 14 2 A Dimension-Based Approach to Mouth-to-Ear Speech Transmission Quality
errors in the frequency domain. The time-variant noise component is commonly
referred to as “musical noise” (see Vary et al. 1998, pp. 393–395 and Vary and
Martin 2006, p. 401). Several counter-measures exist in order to reduce the musical
noise phenomenon, for example through noise “over-subtraction” (Vary and Martin
2006, pp. 403–408). On the other hand, this might lead to signal distortions in turn.
Apart from these approaches, spectral subtraction can generally be done in a more
robust way. Approaching the problem in terms of the a-priori SNR, that is, the SNR
of the input speech and noise signals, with the estimation technique introduced by
Ephraim and Malah (1984) (see also Vary and Martin 2006, pp. 402–403 and Vary
et al. 1998, pp. 396–397), the quality of the enhanced speech signal is improved
as compared to plain spectral subtraction. Furthermore, “musical noise” is reduced
(Cappé 1994).
The performance of noise reduction algorithms can principally be improved by
employing more than one microphone. Here, the spatial characteristics of the sound
field (cf. Fig. 2.3) and statistical properties of the signals can be exploited, which is
particularly beneficial for non-stationary noise (Vary et al. 1998, pp. 409–428 and
Vary and Martin 2006, pp. 443–504). Using multi-channel systems with microphone
arrays, it becomes possible to separate acoustic sources. Adaptive beamforming
techniques can be applied aiming at spatial selectivity by forming a “beam” of high
gain in the direction of the desired sound source by a combination of the different
microphone signals (see Vary et al. 1998, pp. 422–428 and Vary and Martin 2006,
pp. 477–481).
Prior to transmission of the enhanced signal over the transmission channel, the
signal is encoded in order to reduce its bitrate (source coding). Several speech codecs
of different complexity and quality are available. An ideal codec would exhibit high
speech quality, low bitrate, low complexity, and low delay, see Vary et al. (1998,
pp. 233–234) and Vary and Martin (2006, pp. 240–243). However, these criteria
cannot be optimized at the same time in practice. In fact, some of the criteria are
mutually exclusive (Vary et al. 1998, p. 234). For example, high quality codecs aiming
at a low bitrate are usually more complex and thus introduce a noticeable delay.
Hence, there are different codecs with different parameters optimized, depending on
the application.
Speech codecs can be classified according to their underlying coding principle.
Waveform codecs achieve a reduction of the bitrate by direct manipulation of the
speech signal waveform. A simple procedure implemented by the G.711 codec
(ITU-T Rec. G.711 1988) is a logarithmic companding technique, resulting in a
bitrate of 64 kbit/s. Compressing the amplitude of the input signal in a logarith-
mic fashion yields a signal-to-noise ratio acceptable also for small signal ampli-
tudes predominant in speech.9 At the receiver side, the compression is reversed by
expanding the signal’s amplitude accordingly. Since the logarithmic curve is compu-
tationally problematic for values asymptotically reaching zero, a properly displaced
9 Amplitudes of speech are not uniformly distributed. In contrast, Laplace or Gamma density
distributions can be observed, indicating that low energy levels are most frequent in speech and
should thus be quantified with a higher resolution than higher energy levels.
11. 2.2 Speech Transmission in Telecommunication 15
logarithmic curve is used instead (μ-law), or a combination of linear and logarithmic
curve segments (A-law).
In differential waveform coding, the redundancy inherent to human speech is
exploited. Linear predictive (LP) filters are employed for generating residual sig-
nals to be transmitted, which show a reduced dynamic range. The bitrate is reduced
due to the shorter word length required for quantization. This technique is known
as differential pulse code modulation (DPCM) (realized with a weighted first-order
LP filter in the simplest case). An adaptive realization leads to even better results in
terms of bitrate reduction and speech quality (ADPCM coding, see Vary and Martin
2006, pp. 260–261). A prominent example for ADPCM codecs is the G.726 codec
family (ITU-T Rec. G.726 1990) used in DECT (Digital Enhanced Cordless Telecom-
munications) phones. Depending on the specific quantization technique, acceptable
signal-to-noise ratios can be achieved. With noise shaping in the spectral domain,
the quality can be further increased by exploiting spectral masking phenomena of
the human ear.
Parametric codecs (vocoders) work more efficiently in terms of bitrate. Here,
mainly the source-filter model of human speech production is employed to parame-
terize the given speech signal. Only few parameters are necessary for representing
the source (such as the amplitude, fundamental frequency of the excitation signal,
together with a voiced/unvoiced information). The vocal tract is modeled by an adap-
tive LP filter (synthesis filter) at the receiver, where the glottis signal stems from a
signal generator. The filter coefficients and information on the source signal are
determined by a respective inverse filter and residual signal analysis in the encoder
(analysis filter). In parametric codecs, only the above-mentioned parameters are
quantized and encoded. With this approach, very low bitrates of the encoded signal
can be achieved (typically 2.4 kbit/s), see Vary et al. (1998, pp. 290–301) and Vary
and Martin (2006, pp. 262–272), however, with less naturalness of the reconstructed
speech signal.
For almost all codecs used in public telephony, the techniques used in waveform
codecs and parametric codecs are combined to so-called hybrid codecs, leading
to medium bitrates of 4–12 kbit/s (for NB speech, see Vary et al. 1998, pp. 301–
331 and Vary and Martin 2006, pp. 273–304). In hybrid codecs, the source-filter
model is still employed. The adaptive LP analysis filter of the encoder is commonly
extended by an adaptive long-term predictor (LTP) allowing to parameterize the
source signal. The resulting residual signal is quantized and transmitted, along with
the parameters for the LTP and LP synthesis filter as side information. For hybrid
codecs, there are some variants and refinements of these general coding principles.
For instance, in baseband-RELP (residual-excited linear prediction) codecs such
as the GSM full-rate (ETSI GSM 06.10 1988) used in mobile networks, a scalar
quantizer is applied to the perceptually important low-frequency part of the residual
signal and the resulting signal is transmitted in addition to the LP and LTP parameters,
see Vary et al. (1998, pp. 311–319) and Vary and Martin (2006, pp. 282–289). Another
variant of hybrid codecs are code-excited linear prediction (CELP) codecs. Here, the
scalar quantization is replaced by vector quantization, see Vary and Martin (2006,
pp. 290–301) and Vary et al. (1998, pp. 319–327). This technique is most often
12. 16 2 A Dimension-Based Approach to Mouth-to-Ear Speech Transmission Quality
encountered in today’s employed codecs. Examples include the GSM half-rate codec
(ETSI GSM 06.20 1996), the GSM enhanced full-rate codec (ETSI GSM 06.60 1996),
and the adaptive multi-rate (AMR) codec, see ETSI GSM 06.90 (2000). The latter
was designed for GSM and UMTS. In general, it is particularly suitable for potentially
adverse or time-varying speech channels such as packet-switched networks since the
bitrate can be adapted to the resource needs of the channel coding in order to increase
error robustness.
Except for waveform codecs employing solely a speech-optimized quantization
curve like the G.711, codecs of all three classes are based on LP filtering, being the
reason why the term linear predictive coding (LPC) refers to all of the presented
codec technologies.
Speech codecs can further be classified according to the audio bandwidth they
are able to transmit. In traditional circuit-switched telephony, the audio bandwidth
is restricted to approximately 300–3400 Hz. Due to the channel bandpass (ITU-T
Rec. G.712 2001), speech codecs are restricted to that bandwidth as well ( f s =
8 kHz), cf. Sect. 2.2.3. This frequency range is commonly referred to as narrowband
(NB). Although not widely employed, in ISDN also wideband (WB) transmission
is possible with the G.722 codec, a sub-band ADPCM codec (ITU-T Rec. G.722
1988; 50–7000 Hz, f s = 16 kHz). In digital cellular networks of the more recent
generation, WB transmission is in principle enabled by the WB version of the AMR
(AMR-WB, see ITU-T Rec. G.722.2 2003).10 There is no principle restriction of
audio bandwidth in packet-switched transmission. Hence, super-wideband (SWB)
and fullband (FB) speech transmission with audio bandwidths of 50–14000 Hz and
20–20000 Hz, respectively, are possible here.
In the present work, apart from the codecs mentioned so far, the following codecs
are employed in auditory experiments: The G.723.1 codec (dual rate codec operating
at 5.3 or 6.3 kbit/s; ITU-T Rec. G.723.1 2006) and the G.729A codec (conjugate-
structure algebraic CELP, CS-ACELP; ITU-T Rec. G.729 Annex A, 1996), both often
used in packet-based systems, and the G.722.1 codec (ITU-T Rec. G.722.1 2005).
Other codecs can be found, for example, in the G-series of ITU-T recommendations.
Independent of the codec technology, further temporal bitrate savings can be
achieved with a discontinuous transmission (DTX) in such a way that only segments
of active speech are transmitted. Voice-activity detection (VAD), applied prior to the
encoding process, is used to identify segments with speech activity. False classifi-
cations might lead to front/end or mid-speech clipping. In speech pauses, comfort
noise is generated in the receiver in order to suggest an active connection to the user,
see Sect. 2.2.4.
The coding and quantization techniques mentioned are just a coarse description
of the complex processing steps actually involved in today’s codecs. A more detailed
description also of further techniques can be found, for example, in Vary et al. (1998,
pp. 233–376) or Vary and Martin (2006, pp. 201–314).
10 Note that the bandwidth for the highest bitrate mode is approximately 50–6600 Hz; the upper
cutoff frequency decreases slightly with decreasing bitrate (Raake 2006, p. 59).
13. 2.2 Speech Transmission in Telecommunication 17
Further processing steps in order to prepare the encoded speech for transmission
over fixed or mobile packet-based networks are introduced in the following.
Packet-based networks such as the Internet can be described with the OSI (Open
Systems Interconnection) reference model (Day and Zimmermann 1983), see also,
for example, Perkins (2003, pp. 16–23). The OSI model hides the physical intercon-
nection between network nodes (physical layer) from the application (application
layer), for example consisting of the user interface and audio stream of a software
VoIP phone. In the OSI model, between the physical and the application layer there are
several intermediate layers, each building on the services provided by the next lower
layer. Higher layers thus provide higher abstraction. Each layer uses a defined pro-
tocol for communication. At the sender, the layers are traversed from the application
layer towards lower layers, whereas the data subject to transmission is encapsulated
by adding a header in each layer, containing layer-specific information about the
payload, such as its size, a time stamp, or a checksum. This process is referred to as
packetization. The headers comply with the protocol of the respective layer.
In VoIP, the encoded speech frames are embedded into packets compliant to the
Real-time Transport Protocol (RTP, IETF RFC 3550 2003),11 where one packet
usually contains one or several frames (for a detailed description of packetization
principles, see Perkins 2003, pp. 152–157). The packets are supplemented by an RTP
header, containing information on the packet’s content, and are passed to the lower
layers. In addition, the RTP Control Protocol (RTCP) is employed for the reception
of quality feedback of the receiver and other control functions. Further details on
RTP and RTCP can be found in Perkins (2003, pp. 51–144).
RTP makes use of the service the transport layer provides. Here, two protocols are
common: The connection-oriented and thus reliable Transmission Control Protocol
(TCP), and the connectionless User Datagram Protocol (UDP). UDP is commonly
used in VoIP speech and other media transmission. Although UDP is less reliable, it
provides “timely transmission”, which is desirable in “real-time” services (Perkins
2003, p. 45). The increase of loss probability (also detected in this layer) is concealed
or corrected by techniques described below. TCP, in turn, is commonly used for VoIP
call signaling and control using the Session Initiation Protocol (SIP; IETF RFC 3261
2002) in conjunction with the Session Description Protocol (SDP; IETF RFC 2327
1998).
Since speech data might get lost or corrupted during speech transmission, redun-
dancy can proactively be created by sending a separate duplicate stream of encoded
data. This is referred to as Forward Error Correction (FEC) (IETF RFC 2733 1999).
Instead of FEC, it is also possible to create a second, low-bitrate encoded version of
the stream (Low Bitrate Redundancy, LBR; LBR; IETF RFC 2198 1997). Another
more passive possibility is packet retransmission (e.g., based on RTCP requests, see
Perkins 2003, pp. 276–285). Both FEC and the technique of packet retransmission
have potential problems with delay (in particular, retransmission requires at least one
additional round-trip delay).
11 The assignment of RTP to the OSI framework is ambiguous. RTP is related to the transport layer,
the session layer, as well as the presentation layer (Perkins 2003, p. 57).
14. 18 2 A Dimension-Based Approach to Mouth-to-Ear Speech Transmission Quality
2.2.3 Channel
An important role for VoIP plays the Internet Protocol (IP), residing below the trans-
port layer on the network layer. This IP layer provides higher layers with a unified
addressing system and, apart from other functions, masquerades the next lower lay-
ers (link layer and physical layer), that is, the potentially heterogeneous underlying
network technology with their rudimentary link protocols: The transmission phys-
ically can take place wired or wireless, over different gateways, network switches,
and cables, over Digital Subscriber Line (DSL) or Ethernet. On these lower layers,
several “distortions” may occur, which finally influence the IP layer.
Bit errors might occur on the physical layer, for example due to signal interference
or noise, especially in mobile radio transmission channels. Such errors translate to
corrupted packets in packet-based transmission. Corrupted packets can be identified
by integrity checks on the IP layer (detection of faulty headers) or the transport layer
(detection of faulty payload). Depending on the source coding, partial checksums,
that is, checksums of groups of relevant bits are also possible (e.g., for the AMR
codec). If such techniques are used in conjunction with IP-based networks, transport
protocols need to be deployed that allow for partial checksums of the payload (such
as UDP-Lite, IETF RFC 3828 2004).
However, corrupted packets are usually discarded (Perkins 2003, p. 41). Thus,
looking top-down from the application layer, such packets appear to be lost (Perkins
2003, p. 32). Thus, in the present work, it is assumed that frame-corrupting distortions
on the physical layer always translate into packet loss.
Apart from that, the IP layer transmission is done in a “best-effort” fashion, that is,
datagram packets are delivered without a reliable or timely delivery (Perkins 2003,
p. 19). The transmission “behavior” and performance in IP-based networks might be
different in every link. Apart from distortions in lower layers as described above, this
might depend, for example, on the route the packets take (number and geographic
location of network links traversed) and on the type and amount of parallel traffic
(potential network congestion). The underlying network characteristics might also
change during the life-time of an established link. For example, congestion might
occur or the network route might change. As a result, the IP packets may get lost
(packet loss). Since the IP packets might take different routes through the Internet,
and thus arrive at different points in time in a possibly different rank order, packet
jitter is likely to occur, which adds time-varying delay (jitter refers to the variation in
inter-packet delay, see Perkins 2003, p. 184). In turn, this may lead to an unordered
packet arrival at the receiver.
Overall, the IP layer can be considered as the “primary factor determining the
performance of a system communicating across the Internet” (Perkins 2003, p. 22).
Due to the layer structure of the OSI model, any irregularities occurring in the network
layer (resulting from distortions in even lower layers) are directly passed to the upper
layers. For example, if an IP packet is lost, the respective content is missing in the
session layer and eventually in the application layer as well, if no counter-measures
are taken.
15. 2.2 Speech Transmission in Telecommunication 19
In order to quantify distortional effects on IP-level, there exists a number of met-
rics. Assuming independent packet loss, the average packet loss rate (random packet
loss probability) Ppl can be used to get a broad picture of a given network setup and
might reflect, for example, the network congestion. However, this coarse measure
does not reflect the fact that packet loss is usually not an independent process, that is,
the losses are not uniformly distributed over time. On the contrary, packet loss most
often occurs in bursts, that is, there is some probability that the loss of one packet
is dependent on the loss of the previous one, resulting in packet loss patterns. These
patterns can often be modeled by n-state Markov chains or Gilbert/Gilbert-Elliot
models (see Raake 2006, pp. 63–69 for an overview). One can further subdivide
packet loss or, more general, time-varying channel behavior into microscopic and
macroscopic loss (Raake 2006, pp. 71–76), where both terms refer to user percep-
tion: Microscopic time-related degradations are perceived as such, without leading
to time-varying quality perception, that is, the magnitude of the percept is station-
ary. Macroscopic time-related degradations, in turn, consist of multiple microscopic
segments of sufficient duration and with different amount of degradation, thus lead-
ing to instantaneously changing features and quality perception. The focus of the
present work is on microscopic loss behavior. For more details on the measurement
of IP-network performance, see Perkins (2003, pp. 25–42).
Despite of the distortions packet-based networks potentially introduce, many of
the drawbacks of circuit-switched networks can be overcome with packet-based
transmission. Electrical echoes due to signal reflection at 2-wire-4-wire hybrids or
circuit noise in analog networks become less important. In analog circuit-switched
networks, analog frequency division multiplexing with a frequency grid of 4 kHz
and sub-audio signaling was foreseen, limiting the transmission bandwidth to the
range 300–3400 Hz in NB telephony (ITU-T Rec. G.712 2001), which was widely
maintained in digital circuit-switched transmission for compatibility reasons. For
further information on traditional telephone networks, refer to Richards (1973) and
Möller (2000), where the latter includes more recent technologies such as mobile
telephony. In packet-based transmission, in the contrary, no direct reference to the
physical channel is being made. Due to the more abstract transport architecture,
bandwidth constrains are rendered obsolete. WB transmission with a bandwith of
50–7000 Hz (ITU-T Rec. G.712 2001) or beyond is possible, cf. Sect. 2.2.2.
2.2.4 Channel to Ear
Once the transmission physically took place, either over a wired or a wireless chan-
nel, the OSI layers are traversed in reverse order at the receiver, starting from the
physical layer. The collected packets are unwrapped (depacketized) layer for layer,
until reaching the transport layer and higher layers where the RTP resides. The bit
frames (i.e., the encoded frames) are stored in a playout buffer and sorted accord-
ing to the RTP time-stamps. In addition to handling the media RTP packets, the
receiver is responsible for sending reception “quality” statistics back to the sender
16. 20 2 A Dimension-Based Approach to Mouth-to-Ear Speech Transmission Quality
using RTCP. Counter-measures are taken in the receiver in order to repair or conceal
degradations occurred during transmission. The fact that packets may arrive late or
in an unordered fashion is accounted for by the jitter buffer in the receiver. The size
of the jitter buffer directly corresponds to its delay. The size is chosen as a trade-off
between the additionally introduced delay, and an inevitable discard of packets due
to non-timely arrival. Thus, jitter can eventually be translated into packet loss, sim-
ilar to the effect of corrupted frames as described earlier. Jitter buffers are usually
realized in an adaptive manner in order to account for varying network conditions
(evaluated, e.g., by RTCP statistics). Adaptation of the buffer size optimally takes
place in silence periods between talk spurts in order to avoid audio glitches. There
exists a number of possible realizations (e.g., Perkins 2003, pp. 166–192).
The decoder generally performs the inverse procedure that was done in the encod-
ing process. For hybrid codecs, this comprises, for example, LP synthesis filters, as
already discussed in Sect. 2.2.2. The decoded speech frames are stored in a playout
buffer. The decoder also takes care of the comfort-noise insertion at speech pauses
in the DTX mode.
Exploiting the forward error-correction techniques of the sender, transmission
errors can be corrected to a certain extent (depending, e.g., on the amount of redun-
dancy information). From the perspective of the decoder, jitter that led to packet
discard in the jitter buffer and packet loss that could not be repaired are translated to
effective packet loss (Raake 2006, pp. 72–74). Here, packet loss concealment algo-
rithms attempt to (perceptually) mask the lost information. That is, errors that cannot
be corrected (e.g., if the redundant packets do not arrive in time) can be concealed
at the receiver (decoder) by packet loss concealment (PLC) techniques. The amount
of error correction and error concealment often is a trade-off: Since both FEC and
retransmission result in increased bandwidth usage, in congestion-prone network
conditions, concealment of errors might be more appropriate. Again, the behavior
of the sender-receiver interaction can be adaptively and seamlessly scaled through
RTCP.
In the trivial case of packet loss concealment, missing packets are substituted by
a vector of “zeros” or white or shaped noise of appropriate length (silence or noise
substitution). Other basic error concealment schemes substitute the parameters of
bad frames by repetition of the decoded model parameters of the last good frame.
If groups of bits are classified a-priori according to their perceptual importance,
depending, e.g., on which model parameters they represent, frames might be marked
as bad only if the most relevant bits are corrupted (see Vary and Martin 2006, pp. 317–
321). Besides these basic PLC strategies, more advanced concealment strategies were
developed with varying complexity and quality, such as timescale modification or
parameter interpolation based on the codec state. For an overview, see Perkins (2003,
pp. 227–241).
After decoding, speech enhancement algorithms might be deployed. One of those
also employed in this work’s experimental studies is described in the following:
Despite the advent of WB technology in mobile radio networks and VoIP tele-
phony, the majority of terminal equipment used today is still only capable of NB
transmission. In a connection involving a traditional terminal with NB coding and a
17. 2.2 Speech Transmission in Telecommunication 21
WB-capable terminal, the common NB-codec must be used due to compatibility rea-
sons. In the WB terminal, however, a mechanism for artificial bandwidth extension
(ABE) might be incorporated to artificially widen the incoming NB signal towards
WB by adding the missing spectral components.12 The technique used today is
based on exploiting redundancies of the speech production mechanism modeled by
the source-filter model of human speech production as introduced by Carl (1994) and
Carl and Heute (1994): The bandwidth extension towards lower frequencies (below
300 Hz) and higher frequencies (beyond 3400 Hz) can be treated separately for the
excitation (glottis) signal and the vocal tract filter (spectral envelope). The latter has
been shown to be perceptually more crucial and thus the more challenging task in
terms of accuracy, in particular if no auxiliary information is transmitted (which is
the case for the described application scenario). The missing high-frequency com-
ponents of the excitation signal can be produced by modulation of the bandlimited
excitation signal (see Carl 1994; Carl and Heute 1994 and Vary and Martin 2006,
pp. 375–377). For the WB ABE of the spectral envelope, different proposals can be
found in the literature. In the present work, the approach proposed by Carl (1994)
and Carl and Heute (1994) is employed. The coefficients for the WB LP filter that is
used to model the vocal tract are obtained by “code book mapping” between the coef-
ficient set of the given NB speech and a pre-trained WB code book. For an overview
of alternative approaches and a theoretical framework for ABE, see Vary and Martin
(2006, pp. 361–388). Variants of ABE are also employed in certain codecs. For exam-
ple, the “spectral folding” employed in the GSM full-rate codec (ETSI GSM 06.10,
1988) can be considered as ABE with auxiliary information. In the AMR-WB codec
scheme (ITU-T Rec. G.722.2 2003), the 6.4–7 kHz frequency band is synthesized by
ABE, see Vary and Martin (2006, pp. 298–300).
The analog electrical signal is transduced to a proportional acoustic signal x
via the receiver’s loudspeaker. Various kinds of terminal equipment can be used at
the terminating end, such as wirebound or mobile handsets, monaural or binaural
headsets, or hands-free terminals (HFTs). The transduction results in a further (most
often) linear distortion, also dependent on the device geometries and properties as
well as the D/A converters. Particular attention should thus be spent to the design of
these devices (cf. Raake 2006, pp. 90–91).
Moreover, there exist several talker sidetone paths describing through which
routes a handset-telephone user hears her/his own voice. Besides the acoustic direct
air path due to the leakage between the engaged ear and device and the bone con-
duction path to the engaged ear, there is a mechanical feedback path through the
handset. Moreover, an electrical sidetone path might be employed for a feedback of
the talker’s own voice introduced from the microphone to the loudspeaker in order
to compensate for the acoustic shielding on one hand, and feedback on whether the
device is working on the other hand (this electrical path is not shown in Fig. 2.4).
Furthermore, the listener sidetone comprises all paths through which ambient noise
is transmitted to the engaged ear.
12 With a preceding upsampling from f s = 8 to 16 kHz.
18. 22 2 A Dimension-Based Approach to Mouth-to-Ear Speech Transmission Quality
The “average insertion loss”, that is, the integral measure of the frequency-
dependent sensitivity of the sidetone path, is denoted by the sidetone masking rating
(STMR) in decibels for talker sidetone. The coupling of background noise to the
engaged ear is measured by the listener sidetone rating (LSTR) in decibels. STMR
and LSTR, both reflecting loudness ratings, can be calculated similarly to the pro-
cedure described in Sect. 2.2.2, see ITU-T Rec. P.64 (2007). The so-called D-factor
characterizes the difference between the sensitivity for the listener sidetone related
to the diffuse sound and the transmitting sensitivity for the talker sidetone related to
the direct sound, in a frequency weighted way. Thus, the D-factor depends, e.g., on
the shape of the handset (Möller 2000, pp. 35–36). More details on sidetone can be
found in Möller (2000, pp. 28–30).
Note that a talker’s own voice, environmental noise, as well as room reflections
also arrive at the listener’s free ear(s), or they are superimposed to the received signal
x when using a HFT (see gray arrow in Fig. 2.3).
2.3 Perception of Transmitted Speech
2.3.1 Introduction
The transmission of speech signals through communication systems obviously leads
to a potentially detrimental modification of the original physical signal, the speech
sound, emitted from the mouth of the speaker. The signal can be affected by a
myriad of entities (or combinations thereof) involved in the transmission process,
as described in Sect. 2.2. In simple terms, “components the function of which can
be seen as a contribution to the quality forming process” (Jekosch 2005b, p. 16) are
referred to as quality elements (see Sect. 2.3.4 for a more formal definition).
Möller (2000, pp. 18–19) categorizes “perceptive factors” of (traditional) analog
and digital transmission systems as follows:
• Loudness,
• articulation,
• perception of the effects of bandwidth and linear frequency distortion,
• perception of sidetone,
• perception of echo,
• perception of circuit noise,
• effects of environmental noise and binaural hearing, and
• effects of delay.
This list is extended in Möller (2000, pp. 201–203) by perceptive effects caused
by more recent speech transmission technology:
• Effects of interruptions and time variations (e.g., caused by speech clipping in
imperfect VAD),
19. 2.3 Perception of Transmitted Speech 23
• effects of transmission errors (e.g., caused by bit errors),
• perception of speech degradation (e.g., caused by low-bitrate codecs),
• effects of additional delay and residual talker echo (e.g., caused by packetization
and imperfect AEC, respectively).
Much is known about the influence of transmission components with respect
to quality perception in a broader sense, see, e.g., Möller (2000, pp. 17–35 and
pp. 199–203) and Raake (2006, pp. 51–91) for an overview (the latter focussing on
VoIP transmission).
However, a categorization of perceptive factors caused by transmission compo-
nents can also be conceived to be literally based on “pure perception”. This approach
has several advantages: Transmission components causing similar effects in the per-
ceptual domain can be grouped together and related to quality according to their
perceptual importance, thus providing diagnostic information of overall perception.
Provided that the purely perceptual factors are valid also for future transmission com-
ponents, the perceptual factors appear to be more universal and stable over time, while
transmission components are subject to constant change.13 Furthermore, insight into
the way these perceptive factors are combined by the human user is gained. As a
prerequisite, however, a definition of criteria in the perceptual domain is needed. As
it will be seen in this section, perceptual features, and—given that these features are
independent from each other—perceptual dimensions spanning the perceptual space
of the user provide a means for this. A framework for feature-based or dimension-
based quality modeling is provided in the following sections.
2.3.2 Schematic of a Listener
As it was defined in Sect. 2.2.1, the ERPs are regarded as the entrance points to the
listener. Depending on the terminal equipment, at least at one of the ERPs, a modified
version of the acoustic signal emitted by the speaker is present.14
The received speech sound appears at a certain time with certain physical fea-
tures: The sound is distinct in time, space, and other characteristics (Blauert 1997).
Hence, it is referred to as sound event. As a sound event can generally be determined
by means of more than one physical characteristic (e.g., bandwidth or level), it is
generally of multidimensional nature, and thus can geometrically be represented by
a point in a multidimensional sound space. For its description, the (position) vec-
tor s0 = [s0,1 , s0,2 , . . . , s0,N ]T is used in the following. The nth element of this
13 Although this cannot ultimately be guaranteed, as new perceptual factors might emerge or per-
ceptual factors that are important today might become irrelevant in the future.
14 In general, it is differentiated between monaural and binaural listening. In monaural listening, it is
assumed that only one ear is engaged, typically with the usage of a handset terminal in a more or less
quiet environment. In binaural listening with headphones, for example, it is further differentiated
between monotic, diotic, and dichotic listening.
20. 24 2 A Dimension-Based Approach to Mouth-to-Ear Speech Transmission Quality
vector is denoted by s0,n , where n = 1, 2, . . . , N , N being the number of physical
characteristics.15
From this point onwards, the physical universe is left. It is of interest how the
received sound is actually perceived—in terms of perceptual features and finally in
terms of quality: These perceptual characteristics are considered as the most impor-
tant metrics of a communication system from a user’s point of view. To this end,
human listeners are required to attend auditory experiments.16 Such experiments are
usually of formal nature and require, for example, a precisely controlled laboratory
environment, listeners with sufficient hearing capabilities, and a defined stimulus
inventory.
The perception processes of (speech) sounds are described following the system-
theoretic analysis of the auditory experiment depicted in Fig. 2.5. It describes the
relevant processes of human perception and judgment by “black boxes” and empiri-
cal functional relations between their respective input and output ports. The schematic
thus serves as a simplified and symbolic representation of the vast number of periph-
eral and central physiological and psychological mechanisms involved in perception.
It was initially proposed by Blauert (1997, pp. 5–12) and extended in Raake (2006,
pp. 16–18), see also Jekosch (2005b, pp. 71–74), for the case of quality assessment.17
As it can be seen from Fig. 2.5, several sub-systems are assumed to be part of
the overarching black-box “listener”, that is, only the sound event and descriptions
thereof are accessible to the outside world.
The auditory event w0 , its elements (perceptual features or dimensions), and its
descriptions β 0 are explained in Sect. 2.3.3. The formation of the quality event q0
(and its description b0 ) by a comparison between the expectation r 0 (whose elements
are the desired features) and the auditory event w0 is described in Sect. 2.3.4. The
other elements depicted in Fig. 2.5 (w0 (t1 ), w0 (t2 ), and δ0 ) are explained in later
sections.
Note that although important definitions (e.g., quality) are provided in the context
of the listener schematic, the definitions are very general and apply also, for example,
for the conversation situation.
15 All events that are of multidimensional nature can be represented by points in a multidimen-
sional space. For a description of these points, vector notation is used from now on. In particular,
multidimensional events are represented by position vectors, indicated by boldface variables. By
such vectors, points in a space are represented in relation to the origin of this space. Thus, a vector’s
elements are equal to the coordinates of a point in space representing the event.
16 Experiments for investigating speech perception are regarded to be a special case in psycho-
acoustics (Jekosch 2005b, p. 60).
17 Although this schematic is here employed for the auditory modality (i.e., for psycho-acoustic
measurements), it can analogously be used for other psycho-physical measurements analyzing
visual, tactile, olfactory, or gustatory perception. Instead of the terms sound event and auditory
event, it can more generally be referred to physical event and perceptual event, respectively (Möller
2010, pp. 23–25).
21. 2.3 Perception of Transmitted Speech 25
listener
auditory event quality event
w0 , w0 (t2 ) q0
describing
system
{gβ,m } description
features
β0
perceiving comparing describing
system system system
sound event {gw,m } gq gb description
s0 quality
b0
expectation
r0 , w0 (t1 ) description
dissimilarity
δ0
personal/external modifying factors
Fig. 2.5 Schematic of a listener in an auditory test according to Raake (2006, Fig. 1.7) (based on
Blauert 1997, Fig. 1.1 and extensions by Jekosch 2005b)
2.3.3 Perceptual Features and Dimensions
Assuming that the properties of the sound event s0 match the hearing capabilities of
the listener, an auditory (or, more generally, perceptual) event is caused by s0 and
transformed into the perceptual domain via the “perceiving system”. The perceptual
event is generally of multidimensional nature and might be composed of a multitude
of perceptual features. According to Jekosch (2005b, p. 14), a feature is a
recognizable and nameable characteristic of an entity,
where the “entity” in the context considered here is an auditory event w0 . Example
features might be describable with attributes like loudness or timbre. The perceived
features arise inside the listener in a reflection process (cf. Raake 2006, Fig. 1.6)18
by decomposing the perceived composition, that is, the
totality of features of an entity [...] (Jekosch 2005b, p. 16),
see also Raake (2006, Fig. 1.6).
The perceptual event and the perceived composition are interchangeably used
in the following. The perceptual event can geometrically be thought of as a point
in a multidimensional perceptual space and is described by the position vector
w0 = [w0,1 , w0,2 , . . . , w0,M ]T in the following, where its mth element is denoted by
w0,m (m = 1, 2, . . . , M and M being the number of perceptual features). If the coor-
dinate system of the perceptual space is Cartesian, that is, its basis is orthogonal, and
18 “By reflection, the real experience of perception is interpreted and thus given intellectual prop-
erties” (Jekosch 2005b, p. 58).
22. 26 2 A Dimension-Based Approach to Mouth-to-Ear Speech Transmission Quality
each of the auditory features has the property of lying along one of these orthogonal
axes and thus are themselves orthogonal, these features are in the remainder referred
to as perceptual dimensions. The dimensionality of this perceptual space is equal to
M.
In the following, functions mapping one event onto a different type of event or
event component are called psycho-physical functions19 (more specifically psycho-
acoustic functions), see Blauert (1997, pp. 8–9), and are denoted by g, where the
subscript indicates the dependent (target) value (see Fig. 2.5). Thus, the functions
gq and gb represent the “comparing” and one of the two “describing systems”,
see Fig. 2.5. For the “perceiving system”, more than one psycho-acoustic function
is in general needed that describes the relation between the sound event and one
particular perceptual feature of the perceptual event. The functions {gw,m }, with m =
1, 2, . . . , M, can be considered as components of the “perceiving system”. Likewise,
the functions {gβ,m } represent components of the second “describing system”.
The functional psycho-acoustic relation between the sound event s0 and the ele-
ment w0,m of the perceptual event w0 is represented by the psycho-acoustic function
gw,m according to
w0,m = gw,m (s0 ) . (2.1)
As mentioned in Sect. 2.3.2, apart from introspection or physiological measure-
ment, the auditory events are not accessible from outside the listener. Thus, a descrip-
tion β 0 of the auditory event via the “describing system” is necessary to be obtained
from the listener. Here, the elements {β0,m } correspond to the elements {w0,m }, mod-
ified by the “describing system”, itself being dependent on personal and external
modifying factors (such as experience of the listener or the environmental context).
Implications of this modification are discussed in the following sections.
2.3.4 Integral Quality, Quality Features and Dimensions,
and Quality Elements
Given that the perceptual event w0 is present, the quality event q0 arises following
the definition provided in Jekosch (2005b, p. 15): Quality is the
result of [the] judgment of the perceived composition of an entity with respect to its desired
composition.
Quality thus is a result of an internal comparison between the perceived composition
and the desired composition, and thus quality corresponds to the output of the “com-
paring system” in Fig. 2.5. The properties of these two building blocks of quality are
detailed in the following.
19 “Psycho-physics measures the relationship between physical phenomena and phenomena of
perception” (Jekosch 2005b, p. 61).
23. 2.3 Perception of Transmitted Speech 27
Those features of the perceived composition w0 that are relevant for quality are
referred to as quality features, the definition of it being an extension of the feature
definition provided earlier. Jekosch (2005b, p. 17) formally states that
a quality feature is a recognized and designated characteristic of an entity that is relevant to
the entity’s quality.
Correspondingly, if the features are orthogonal in addition, they are referred to as
quality dimensions in the following.
The
totality of features of individual expectations and/or relevant demands and/or social require-
ments
is referred to as the desired composition (Jekosch 2005b, p. 16). The desired compo-
sition, in the following denoted by the position vector r 0 = [r0,1 , r0,2 , . . . , r0,M ]T ,
can geometrically be represented by a point in the same perceptual space in which
also the perceived composition w0 is located. Hence, the desired composition r 0 and
the perceptual event w0 share the same dimensionality M. The desired features again
are the result of a reflection process inside the listener (cf. Raake 2006, Fig. 1.6). The
mth desired feature of r 0 is denoted by r0,m , with m = 1, 2, . . . , M.
By the definition given above, it is implied that for every perceptual feature value
w0,m , there exists a desired feature value r0,m . Hence, the desired composition con-
stitutes a multidimensional internal reference of the listener storing reference values
for the characteristics of the auditory event w0 . This process can be regarded as an
anticipation of the percept w0 by the listener (Raake 2006, p. 15 and Fig. 1.6), and
thus her/his expectation. The expectation r 0 can, for example, be conceived as an
ideal point in the perceptual space to which all perceptual events are compared in
the process of formulating the integral quality (cf. Sect. 2.5).
In contrast to Eq. (2.1), a direct relation between the sound event s0 and the quality
event q0 cannot be established, since the quality formation process depends on the
variable r 0 , the expectation of the user. According to the definition of quality given
in this section, quality is the result of a comparison between what is perceived, that
is, w0 , with what is expected, that is, r 0 . In mathematical terms, quality events result
from the relation
q0 = gq (w0 , r 0 ) . (2.2)
Stepping back to the technological domain of speech transmission as introduced
in Sect. 2.2, it can now be formalized by which elements “quality perception” can
actually be caused. Components in the speech transmission chain can constitute
quality elements, for which a general definition is given in Jekosch (2005b, p. 16):
[A quality element is the] contribution to the quality
• of a material or immaterial product as the result of an action/activity or a process in one
of the planning, execution, or usage phases
• of an action or of a process as the result of an element in the course of this action or
process.
24. 28 2 A Dimension-Based Approach to Mouth-to-Ear Speech Transmission Quality
Quality elements are the physical counterpart to quality features: “While [a quality
element] is the building block for designing an entity, a quality feature is the analyzed
result of the perceived, designed entity and is therefore the basis of any description
of its quality” (Jekosch 2005b, p. 17).
In the present work, the quality of transmitted speech (and also its quality features)
is considered from mouth to ear (the elements involved in this transmission path were
described in Sect. 2.2) according to the definition given in ITU-T Rec. P.10/G.100
(2006): Mouth-to-ear quality is the
speech quality as experienced by the user of a voice communication system. [It] includes
the whole transmission path from the mouth of the talker to the ear of the listener.
In order to stress that quality is a scalar value obtained by an integration of different
perceptual features or dimensions, the term integral quality is used in the following
(cf. Möller 2000, p. 11).20
Similar to the perceptual event, see Sect. 2.3.3, the quality event q0 is not acces-
sible from outside the listener. Thus, only a description b0 of the quality event can
be obtained via the “describing system”, resulting in a modification of q0 depending
on personal and external modifying factors. In addition, the expectation r 0 is not
invariant over time and is highly dependent on personal and external factors. Con-
siderations on factors influencing the quality description are given in the following
sections.
2.3.5 QoS and QoE Terminology
Quality, in general, can be regarded from the perspective of service provision (referred
to as Quality of Service, QoS) and from the perspective of the user of this service
(referred to as Quality of Experience, QoE).
The term QoS is typically employed for describing all aspects related to the accept-
ability 21 of a service. Accordingly, ITU-T Rec. E.800 (2008) gives the following
definition:
[QoS is the] totality of characteristics of a telecommunications service that bear on its ability
to satisfy stated and implied needs of the user of the service.
The term QoE, in turn, strongly emphasizes the “perception of QoS” and is defined
in ITU-T Rec. P.10/G.100 (2006) as follows:
The overall acceptability of an application or service, as perceived subjectively by the end-
user.
20 Note that quality is said to be of multidimensional nature in everyday language. However,
according to the definitions provided here, integral quality is a one-dimensional (scalar) value,
whereas both the perceptual event and the internal reference are of multidimensional nature.
21 Acceptability is typically measured as the ratio between the number of potential users and the
number of actual users of a service, cf. Möller (2000, p. 14).
25. 2.3 Perception of Transmitted Speech 29
NOTE 1 Quality of experience includes the complete end-to-end system effects (client,
terminal, network, services infrastructure, etc.).
NOTE 2 Overall acceptability may be influenced by user expectations and context.
The notes indicate that the complete mouth-to-ear system is considered (see
Sect. 2.3.4), and that modifying factors such as the user’s expectation play a role.
Thus, QoE is in line with the notion of quality as defined by Jekosch (2005b) and
which is used throughout this book.
Möller (2000) developed a comprehensive taxonomy for QoS that was slightly
updated in Möller (2005), revealing the relevant aspects of QoS and their interactions
and how these aspects are related to the acceptability of a service. According to this
taxonomy, QoS builds on three groups of factors: speech communication factors,
service factors, and contextual factors. Thus, according to the above definition, QoE
is implicitly part of this framework. Besides ease of communication and conversa-
tion effectiveness, (one-way) voice transmission quality is one of the building blocks
of speech communication. Together, they describe the communication efficiency.22
According to this taxonomy, as it is mainly focused on the listening-only situation,
the work presented in the following chapters focuses on (one-way) voice transmis-
sion quality. For further details, for example, on how factors such as economical
benefit integrate into QoS, see Möller (2000, pp. 11–15 and pp. 43–44) and Möller
(2005). Considerations on measures to guarantee a certain QoS in VoIP such as
packet prioritization can be found in Raake (2006, pp. 55–56).
2.4 Auditory Quality Measurement
2.4.1 Listener as a Measuring Organ
The aim of psycho-acoustic measurement in auditory tests is to arrive at quantitative
descriptions β 0 and b0 of the perceptual and quality events w0 and q0 , respectively, in
order to obtain utilizable and communicable results. According to Jekosch (2005b,
p. 91), an auditory (speech) test is
a routine procedure for examining one or more empirically restrictive quality features of
perceived speech with the aim of making a quantitative statement on the features.23
A formalization of the description process is achieved by measuring, which is the
entirety of all the activities in the measurement chain [...],
for example, the choice and practical application of the measuring technique (Jekosch
2005b, p. 63). In psycho-physical measuring, these techniques are referred to as
psychometric methods. The measurand is the
22 Efficiency is defined as “the resources expended in relation to the accuracy and completeness
with which users achieve specified goals” (ETSI Guide EG 201 013 1997).
23 Note that the term “features” is here meant to include “quality” as defined in Sect. 2.3.4 as well.
26. 30 2 A Dimension-Based Approach to Mouth-to-Ear Speech Transmission Quality
feature of an object to be measured which can numerically be described in the course of the
measuring process (Jekosch 2005b, p. 61).
Scaling, a part of the measuring process, is the concrete assignment of numbers
(scale values) to measuring objects according to consistent rules, cf. Stevens (1951,
p. 22) and Jekosch (2005b, p. 63). The relation between the attributes under test, that
is, the measurands, and the assigned numbers must be isomorphic, and the numbers
must be chosen in such a way that each element under consideration can be assigned
to a number. The set of numbers is called a scale (Blauert 1997, p. 7).
The (physical) measuring object is the sound event s0 , where the measurand
is a characteristic n of a sound event s0 . Instrumentally, scaling is achieved by
means of a physical measuring instrument. In analogy, in the perceptual universe,
the measurement subjectively takes place, where the listener acts as a measuring
organ (Jekosch 2005b, p. 65). More precisely, the “describing system” is considered
as a “psycho-physical measurement instrument” in the listener schematic in Fig. 2.5
(cf. Blauert 1997, Fig. 1.3). The measurand is either a feature m of the auditory event
w0 or quality itself.
2.4.2 Scaling Functions
Similar to the proposal in Blauert (1997, pp. 8–9), however, following the vector
notation introduced so far, multidimensional scale vectors are denoted by s, w, and
β for the corresponding sound event s0 , the perceptual event w0 , and the description
β 0 , respectively. The scale values are denoted by the elements s1 , s2 , . . . , s N of s,
the elements w1 , w2 , . . . , w M of w, and the elements β1 , β2 , . . . , β M of β.
As a convention, scaling functions mapping the single elements of events to scale
values are denoted by f , where the subscript indicates the dependent (target) value.
The scaling functions are denoted with { f s,n }, { f w,m }, and { f β,m }. The scaling func-
tion f s,n with sn = f s,n (s0,n ) represents the physical measurement by means of
a physical measuring instrument for a given physical characteristic n. The scal-
ing function f β,m transforms the feature description β0,m for the perceptual feature
m to a scale value βm according to βm = f β,m (β0,m ). However, as the auditory
event w0 is hidden and not accessible from outside the listener, the scaling function
wm = f w,m (w0,m ) does not exist (Jekosch 2005b, pp. 71–72).
As the description β0,m represents a measurement of the mth perceptual feature
value w0,m , that is, β0,m = gβ,m (w0,m ), it follows that
βm = f β,m (β0,m ) = f β,m (gβ,m (w0,m )) . (2.3)
Hence, the scaled description βm equals the mth auditory feature w0,m , modified
both by the conversion through the “describing system” gβ,m and the scaling function
f β,m . As can be seen from Fig. 2.5, these functions are both affected by personal and
modifying factors. Thus, βm can be considered as a biased version of the sought
27. 2.4 Auditory Quality Measurement 31
perceptual feature w0,m (as further described in Sect. 2.4.4). In Sect. 2.4.3, further
details are provided on how βm can be measured.
Analogous to the measurement and scaling considerations above, a scale value
q reflecting the (scalar) quality event q0 is defined by means of a scaling function
q = f q (q0 ). Values b representing scaled versions of the quality description b0 are
related via the scaling function b = f b (b0 ).
Analogous to the auditory event w0 , the quality event q0 is not accessible outside
the listener, and the scaling function q = f q (q0 ) is practically not existing (Jekosch
2005b, p. 73). Thus, the listener describes what is perceived through the respective
“describing system”, see Fig. 2.5, resulting in the scalar quality description b0 that
represents a measurement of q0 , that is, b0 = gb (q0 ). It follows that
b = f b (b0 ) = f b (gb (q0 )) . (2.4)
Hence, the scaled description b equals the quality event q0 modified by both the
conversion through the “describing system” gb and the scaling function f b . Again,
both functions can be attributed to the scaling process affected by personal and
modifying factors. The scaled description b can be considered as a biased version of
the sought quality event q0 , see Sect. 2.4.4. In Sect. 2.4.3, further details are provided
on how b can be measured.
2.4.3 Psychometric Methods
2.4.3.1 General Categorization
The psycho-acoustic measuring principles, that is, the practical methods aiming at
obtaining scaled descriptions b and β, can be different and their usage depends on
the psycho-acoustic measurement task. According to Blauert (1994), see also, for
example, Möller (2000, pp. 48–49), Möller (2010, pp. 32–35), and classical literature
such as Guilford (1954), psychometric methods can be categorized according to the
following criteria:
• The scaling method and the resulting scale level,
• the presentation method,
• the test “modality”, and
• the mediacy.
These criteria are further described in this section.
Depending on the scaling method, the numbers assigned to the stimuli in the
scaling process can have different properties according to which measurement scales
can be classified. Four different scale levels are distinguished (Stevens 1946), see also
Blauert (1994, pp. 7–8), Möller (2000, pp. 66–67), and Möller (2010, pp. 41–42):
28. 32 2 A Dimension-Based Approach to Mouth-to-Ear Speech Transmission Quality
• Nominal scales are based on the identity property: Each number is identical with
itself and is used as a label without any meaningful relations between the numbers.
• In addition to the property of nominal scales, ordinal scales are based on the rank
order property: The numbers are arranged in a specified order. The steps of the
scale, however, are not necessarily equidistant.
• In addition to the properties of ordinal scales, interval scales are based on the
additivity property of intervals: The steps of the scale, therefore, are equidistant.
• In addition to the properties of interval scales, ratio scales contain an absolute
“true” zero point (i.e., not only an arbitrary assignment of the number zero, which
can be done on nominal, ordinal, or interval scales), as well as ratio relations.
The scale level determines the permissible mathematical (and thus also statistical)
operations applicable to the scale numbers.
Ratio scales are obtained by the majority of physical measurements. In psycho-
physics, this scale level can result from, for example, magnitude estimation (Stevens
1957): The task of the test participants is to assign numbers to test objects, where
the numbers are required to reflect the relation between perceptual intensities or
apparent magnitude. Since ratio scales provide the highest level of information, this
scale level is desirable in a psycho-physical scaling task. However, since only the
ratios between pairs of values on this scale are meaningful, magnitude estimation
does not provide absolute scale values across test participants, which is a major
drawback for use in telephony (Möller 2000, p. 68). Category scaling, which is
often used in telecommunication-related subjective testing (see Sect. 2.4.3.2), mostly
results in ordinal to interval scale levels (Möller 2000, p. 68). Paired comparisons
such as similarity judgments of pairs of stimuli reach interval level at the most due
to their relative nature. Möller (2000, pp. 72–74) proposes the use of a scale for
combined category-ratio scaling, originally developed by Borg (1982), for use in
telephony. With this scale, drawbacks of category scales and ratio scales can be
potentially overcome, resulting in “absolute” ratio scale values. In classical psycho-
physics, most scale levels are nominal or ordinal and stem from tasks like detecting
absolute thresholds, differential thresholds (just noticeable differences), or detecting
equivalents (point of subjective equality), see Jekosch (2005b, pp. 75–76) and Möller
(2010, pp. 34–35). Judgments from identification tasks or from the determination of
just noticeable differences are examples for nominal scale level.
Common presentation methods are the method of adjustment (a stimulus is
adjusted by the test participant or the experimenter until a certain condition is met,
e.g., equal loudness of two stimuli) and constant methods (the test participant is asked
to scale a constant stimulus).
In speech-based telephony, the following test “modalities” are conceivable: Con-
versation test, listening-only test, talking and listening test.
The mediacy of measurements differentiates direct from indirect measurements.
In its classical sense (see, e.g., Guilford 1954, pp. 259–260 and Bech and Zacharov
2006, pp. 67–80), the measurement mediacy is linked to the scaling process:
Indirect scaling occurs whenever the test participant does not establish a one-to-
one assignment of measuring objects to scale values, but rather gives nominal
29. 2.4 Auditory Quality Measurement 33
(e.g., identification task) or ordinal (e.g., rank ordering task) responses according
to a discrimination between the stimuli. The target scale is obtained by a separate
transformation of these ratings by the investigator (e.g., through the law of compar-
ative judgment, Thurstone 1927a, see also Guilford 1954). In direct scaling, in turn,
the predefined scale is the target scale and the test participant employs this target
scale to formulate her/his rating.
In this book, the definition of indirect measurement is used in a more general
fashion: Rating scales that do not provide the target values the investigation actually
aims at, that is, subjective judgments that require a substantial, non-trivial mathe-
matical operation in order to arrive at the target scale(s), are referred to as an indirect
measure of the target scale through an intermediate scale.
As an example, the similarity between pairs of stimuli can be rated directly by
means of a similarity scale.24 However, the similarity scale is regarded as an interme-
diate scale, because the obtained similarity data is input to a mathematical algorithm
performing multidimensional scaling (see Sect. 2.4.3.2 and 3.2), transforming the
dissimilarities into distances. The conditions can be represented as points in a mul-
tidimensional space. The coordinate axes of this space represent the sought scales,
which reflect the perceptual dimensions, that is, orthogonal components of a feature
vector β. According to the generalized definition used in this book, these new scales
are obtained indirectly via similarity judgments. In Chap. 4, a method is developed
to scale the perceptual dimensions in a direct way.
Instead of extending the classical meaning of the measurement mediacy as it is
followed in the present work, Bech and Zacharov (2006, pp. 44–65) denote methods
“based on the assumption that there is a close relationship between a given sensation
and the verbal descriptors used by the subject to describe the sensation” as direct
elicitation, whereas indirect elicitation methods “try to separate sensation and ver-
balization”, such as multidimensional scaling (as a method without actually labeling
the sensation) or body gestures.
Jekosch (2000, p. 82) differentiates between mediate and immediate measure-
ments based on the measurement-process perspective instead of the scaling per-
spective (cf. Sect. 2.4.1). According to the author’s remarks, mediacy depends on
the degree to which intermediate subjective processes are necessary for the psycho-
physical measuring task. Hence, every measurement involving quantitative scaling
and thus implying a cognitive encoding process (or intermediate process) accord-
ing to the predefined scale is a mediate measurement, whereas nominal and ordinal
ratings are of immediate nature.
In other contexts, further definitions of measurement mediacy are possible. Instead
of scaled descriptions β or b, task performance measures or physiological mea-
sures like eye movement, skin conductance, pulse rate, blood pressure, or electroen-
cephalography data might be used as quality or quality feature indicators in the future
(Möller 2010, p. 27 and p. 34). For first studies in these directions, the interested
reader is referred to Durin and Gros (2008) and Antons et al. (2010), for example.
24 Alternative, indirect methods for measuring similarity are given, for example, in Tsogo et al.
(2000).
30. 34 2 A Dimension-Based Approach to Mouth-to-Ear Speech Transmission Quality
An additional dichotomy can be applied to subjective tests that discriminates
analytical type of tests from utilitarian type of test, see Quackenbush et al. (1988,
pp. 15–16) and Raake (2006, p. 16). Subjective tests aiming at the measurement
of perceived features described in Sect. 2.3.3 and reflected by {βm }, especially in
the context of speech-transmission quality testing, are referred to as analytical type
of auditory tests, in this book also referred to as multidimensional analysis. The
results are sometimes referred to as sensory judgments (Bech and Zacharov 2006).
In turn, utilitarian type of auditory tests aim at descriptions of the perceived quality
as illustrated in Sect. 2.3.4, reflected by b. The results are sometimes referred to as
affective judgments (Bech and Zacharov 2006). In utilitarian tests, the transmission
“system performance [is measured] with respect to one or more criteria [...]” (Jekosch
2005b, p. 107). This measurement process is in the following referred to as quality
assessment.
2.4.3.2 Common Test Methods
Speech telecommunication systems are usually designed for bidirectional communi-
cation, cf. Sect. 2.2. Thus, conversation-type of subjective testing reflects this situa-
tion in an ecologically valid way. Here, test participants interact as actual interlocutors
exchanging information (Möller 2000, pp. 59–60). In practical tests, conversation
scenarios are given to the test participants, where each of the interlocutors takes a
specific role to play in order to simulate a natural telephone conversation. Möller
(2000, pp. 75–81) developed and experimentally tested economical short conversa-
tion scenarios that allow for balanced dialogs, short conversation duration, and thus
up to 15 conditions to be tested within a single test session. Alternatively, conversa-
tion scenarios can be simulated involving only one test participant (ETSI Technical
Report TR 102 506 2011), see Weiss et al. (2009) for an application example.
Listening-only is the most common “modality” in subjective tests in telecommu-
nications (Möller 2000, p. 52), probably because such tests are relatively easy to
implement while the results are (within limits) directly related to results from the
more natural conversation tests. Only one test participant is required at a time (i.e.,
not two conversation partners), the scaling is faster due to short samples, and no
online testing equipment is required (listening-only presentation methods allow to
process the sentence material offline in prior to the actual test). Hence, listening-only
tests are less expensive in terms of time and money. Listening-only tests rely on more
or less purposeless sentence material transmitted through a speech telecommunica-
tion system in one direction. Most signal-based instrumental quality measures aim
at estimating results from listening-only tests, see Sect. 2.6.2.
A systematic investigation comparing conversation test results and listening-only
test results is presented in Möller (2000, pp. 129–133). Although no general relation-
ship between both test modalities could be found, test ratings obtained in conversation
tests turned out to be higher, indicating that, amongst other things, in listening-only
tests the “surface structure” of the speech signal, cf. Sect. 2.1, is more important to
test participants and thus the judgments tend to be more critical in this respect. With

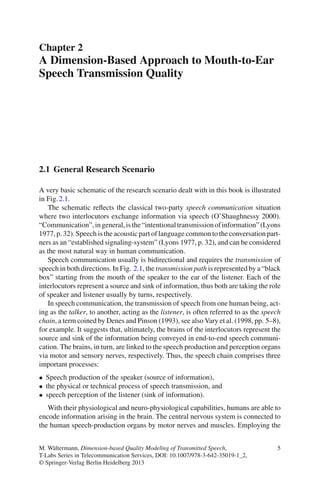
![6 2 A Dimension-Based Approach to Mouth-to-Ear Speech Transmission Quality
human mouth-to-ear speech transmission human
source sink
sink source
Fig. 2.1 Two-party speech communication
lungs for airflow provision, the larynx with its glottis is used primarily for airflow
“control”, whereas the vocal tract serves for modulation of the airflow through its
articulators (O’Shaughnessy 2000, pp. 35–48). This way, speech sounds are produced
and emitted primarily from the mouth of the speaker. Speech sounds, as all sounds,
physically emerge in form of mechanic vibration or (longitudinal) mechanic waves,
see Blauert and Xiang (2008). Speech is physically characterized by an average
sound intensity level between 55 and 75 dB rel. 10−16 W/cm2 for normal speak-
ing. The long-term average speech spectrum shows lowpass behavior and ranges
approximately from 50 to 10000 Hz. Between 100 and 600 Hz, that is, including the
fundamental frequency and the first formant, the energy is highest (Denes and Pinson
1993, pp. 139–145).
For the moment, the speech transmission system is represented by a “black box”
comprising all transmission elements from the mouth of the speaker to the ear of
the listener. In direct face-to-face communication, the speech transmission “system”
is a purely acoustic sound field. Under free-field conditions, it is the direct air path
“mouth to ear”. The acoustic waves, emitted by the mouth of the speaker, represent the
vehicle carrying the information from the speaker (information source) to the listener
(information sink). The information is encoded in the sound pressure variations as
a function of time and space as a purely physical phenomenon that is studied in the
field of “pure” acoustics (Blauert and Xiang 2008). The waves eventually arrive at
the listeners ear(s) as an attenuated version of the original acoustic signal (assuming
an otherwise noise-free and free-field environment).1
Telecommunication via speech is enabled by speech-communication technology,
partially replacing the natural air-path and aiming at “supporting natural communica-
tive possibilities [...] by means of technical devices and facilities” (Jekosch 2005b,
p. 23). This comprises elements such as user terminals (electro-acoustic transducers),
codecs, transmission facilities (e.g., circuit-switched or packet-switched networks),
and other signal processing units. Most generally, according to Shannon (1948),
transmission of information in technical terms consists of a transmitter, a (noise-
prone) channel, and a receiver in order to enable telecommunication.
1 Gestures as a part of human face-to-face communication are disregarded in this consideration,
although they become more important, for example, in video telephony. The present work is focused
solely on acoustic speech communication.](data:image/gif;base64,R0lGODlhAQABAIAAAAAAAP///yH5BAEAAAAALAAAAAABAAEAAAIBRAA7)