Measuring Video Advertising
•
2 j'aime•374 vues

The document discusses metrics for measuring the effectiveness of online video advertising campaigns. It describes both progress metrics collected from ad servers, like completion rates and time spent viewing, as well as performance metrics from surveys, like brand awareness. While these metrics provide useful data, marketers need to consider many additional factors for context like ad placement, creative quality, and type of video. No single metric provides the full picture of how an ad campaign influences consumer purchasing. The best approach examines metrics in combination with other advertising decisions and seeks to understand how online video affects both online and offline consumer behavior.

Recommandé
Recommandé
Contenu connexe
Tendances
Tendances (13)
Similaire à Measuring Video Advertising
Similaire à Measuring Video Advertising (20)
Dernier
Dernier (20)
Measuring Video Advertising
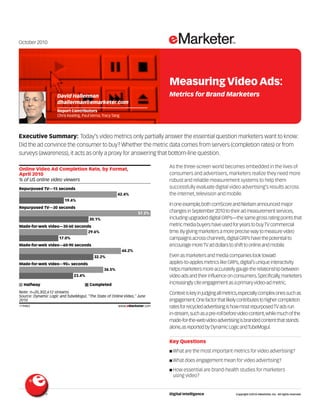
- 1. October 2010 Measuring Video Ads: David Hallerman Metrics for Brand Marketers dhallerman@emarketer.com Report Contributors Chris Keating, Paul Verna, Tracy Tang Executive Summary: Today’s video metrics only partially answer the essential question marketers want to know: Did the ad convince the consumer to buy? Whether the metric data comes from servers (completion rates) or from surveys (awareness), it acts as only a proxy for answering that bottom-line question. 119483 Online Video Ad Completion Rate, by Format, As the three-screen world becomes embedded in the lives of April 2010 consumers and advertisers, marketers realize they need more % of US online video viewers robust and reliable measurement systems to help them Repurposed TV—15 seconds successfully evaluate digital video advertising’s results across 42.4% the internet, television and mobile. 19.4% In one example, both comScore and Nielsen announced major Repurposed TV—30 seconds 57.2% changes in September 2010 to their ad measurement services, 30.1% including upgraded digital GRPs—the same gross rating points that Made-for-web video—30-60 seconds metric media buyers have used for years to buy TV commercial 29.6% time. By giving marketers a more precise way to measure video 17.0% campaigns across channels, digital GRPs have the potential to Made-for-web video—60-90 seconds encourage more TV ad dollars to shift to online and mobile. 44.2% 32.2% Even as marketers and media companies look toward Made-for-web video—90+ seconds apples-to-apples metrics like GRPs, digital’s unique interactivity 36.5% helps marketers more accurately gauge the relationship between 23.4% video ads and their influence on consumers. Specifically, marketers Halfway Completed increasingly cite engagement as a primary video-ad metric. Note: n=20,302,612 streams Context is key in judging all metrics,especially complex ones such as Source: Dynamic Logic and TubeMogul, "The State of Online Video," June 2010 engagement.One factor that likely contributes to higher completion 119483 www.eMarketer.com rates for recycled advertising is how most repurposed TV ads run in-stream,such as a pre-roll before video content,while much of the made-for-the-web video advertising is branded content that stands alone,as reported by Dynamic Logic and TubeMogul. Key Questions I What are the most important metrics for video advertising? I What does engagement mean for video advertising? I How essential are brand-health studies for marketers using video? Digital Intelligence Copyright ©2010 eMarketer, Inc. All rights reserved.
- 2. The eMarketer View More important, though, are the elements that surround and color the collected data. In many ways, it’s not just the particular response to the ad that marketers need to judge but also several The metrics that marketers choose for analyzing related factors. These include: their online video advertising campaigns fall into two categories: progress metrics and performance I The ad’s placement, such as the site, the video stream or the network metrics. These metrics are also described through the method I The quality of the ad inventory used for gathering the data: I The type of video ad, in-stream (like a pre-roll) vs. in-banner I Two common progress metrics (aka server-based metrics) for (which a user must start in most cases) video ads are completion rates and start-stop. I The source of the video ad: repurposed TV commercials vs. I Two fundamental performance metrics (aka survey- or panel-based made especially for the internet metrics) are awareness and favorability. I The quality of the ad’s creative Progress metrics are not an end in themselves, although marketers still get caught up in the reams of data that come from I The length of the ad, such as 15 seconds, 30 seconds or a ad servers. And performance metrics may reveal the audience’s 4-minute video that’s branded content attitudes but still not tell a marketer enough about how much the I The time of day when the ad runs advertising has helped sell more goods. I The location of the viewer Measuring an audience’s response to a video ad and its overall interactions are core to the engagement I The accuracy of the ad’s targeting metric. And, in turn, the engagement metric is increasingly central to video advertising. That’s most likely the case because for I The degree that both the ad’s creative and the product were video advertising, engagement is conceptually similar to key relevant to the target audience measurements for social media marketing.Several metrics contribute to video engagement, most notably time spent and “Metrics taken in isolation can be frustrating.” deliberate audience interactions with the ad. Many marketers also —Mary Shirley, director of client services at Horizon Media, see brand-lift metrics such as favorability as a sign of engagement. in an interview with eMarketer, September 2010 Even though marketers use the term “engagement” in varied ways, the ability to gauge how much the audience responds to a video ad The big picture. Marketers also measure video to examine is a key differentiator between digital and TV. both cost and brand effectiveness. “We split up our video All metrics offer more actionable insights when advertising measurement into two areas. Efficiency is how low we combined with other video advertising decisions can get our cost per view, per site, per vendor,” said Stephen and techniques. What marketers measure for online video Strong, global interactive director at Alberto Culver, in an interview ads needs to be weighed against additional factors. “Video with eMarketer. “Effectiveness comes from brand studies, like measurement means looking at all the pieces and seeing how from comScore and Dynamic Logic.” they’re working together—video on search, TV on sponsorship, The terms for the same basic video ad metric often and so on,” said Nicole Haygood, vice president and interactive vary from vendor to vendor. The lack of absolute standards media director at Draftfcb, in an interview with eMarketer. can frustrate marketers looking for a clear view of how successful their online video ad campaign has been. To simplify things, consider progress metrics not individually so much as by their larger meaning. The main groups of metrics include: I Impressions I Views I Time I Completion I Interactions I Traffic I Sharing Measuring Video Ads 2
- 3. Clicks are typically ineffective for measuring video advertising. Since most video is focused on branding, Reasons for Measuring marketers can be misled when they judge the success of an ad Even just one person’s perspective offers various campaign by clicks. Even though many marketers think of the click motives for measuring. first when measuring online ads, that basic metric is useful largely for direct response objectives. While a more helpful connection “One main reason to measure video advertising is between clicks and video will likely arise as more marketers use because it tends to be more expensive than other clickable-video ads, even then the ads will more often have a investments online, so it’s very important to figure response rather than a branding focus. out if it’s worth the cost,” said Mary Shirley, director of client services at Horizon Media, in an interview The main trend for video ad measurement in the with eMarketer. next several years will be tying together the three screens: online, TV and mobile. Another will be using more Direct-response measurement is also pushing robust methods for finding out how online video ads affect brand-oriented marketers. “There’s an inherent consumers’ offline behaviors. “We want to see how people are measurement component in the digital space, an leaning forward with video,” said Haygood. “How do we show the expectation that analytics should be really robust. value beyond the impression?” That’s driven a lot of our work, where we hold awareness [the metric] to the same standards as direct-response campaigns,” Shirley added. “Measurement helps us strengthen the other In addition, measuring video is needed to get a leg up parts of the media, so we can know which on the competition. “Video advertising is similar to video in rotation people are viewing more.” other types of emerging options in digital—it’s such —Nicole Haygood, vice president interactive media a growth opportunity,” said Shirley. “So that’s director at Draftfcb, in an interview with eMarketer, another reason to measure: What can we know now September 2010 that puts us ahead of the game in video?” Finally, the higher pricing of video advertising makes Why measure online video advertising? While the measuring an online campaign’s results not just question might seem obvious,the answers are not always apparent: practical but also a form of validation.“While there are I To find out how things did cost per click and networks for video, you’re normally paying a premium,” said Nicole Haygood, interactive I To plan further iterations of the same campaign media director at Draftfcb, in an eMarketer interview. I To plan future campaigns “And when you pay premium prices, you need to measure to justify investment on the front end.” I To react interactively to change elements of a campaign I To build cross-channel measurement systems I To figure pricing both now and in the future Measuring Video Ads 3
- 4. Progress Metrics In interviews with industry executives, clear preferences emerged about which metrics best help marketers. “The most commonly used metrics look at how we grab viewership, things like video The server-based progress metrics that marketers start, mid and end,” said Draftfcb’s Haygood. “We also like to see gather to gauge online video advertising can be how many are watching to completion, and where people are divided into the following four categories: dropping off.” In addition, most server-based metrics need to be analyzed in the Impressions and views context of the type of video ad, where it’s playing, time of day, I Impressions delivered audience demographics and so on. I Cost per impression Marketers also use the metrics in different ways, depending on whether the video ad is streamed, standalone or viewed on a I Unique viewers social media site. “With in-banner video ads, we measure time spent, number of videos viewed, time to completion, share with I Unique viewers by time and location friend,” Haygood said. “And we also measure click-through rate. I Number of views And we look at comments if the video ad is playing on YouTube.” I Repeat views “Some get real granular, but we want to stay I Cost per video view high level, such as which videos get Time and completion watched the most.” —Stephen Strong, global I Completion rate interactive director at Alberto Culver, in an interview with eMarketer, September 2010 I Time viewing ad (seconds) I Percent viewed (of total ad time) Compared with measuring some other forms of online advertising, like banners, video offers the key benefit of familiarity to marketers. I Time of day viewed “Video ads are not harder to measure than banner ads,” said Alberto Culver’s Strong.“They’re easier for brand teams to comprehend.At Interactions least they understand that somebody watched my video.” I Interaction time (seconds) However, all those choices introduce complexity and confusion to I Interaction rate a marketer’s top concern of determining if video ads are helping to sell their products. Too often, the massive data-filled spreadsheets I Start rate (user initiation) that marketers get from their researchers cloud the picture more I Mouse-over than clarify it. I Number of clicks “What can be frustrating is how taking any metric individually can feel kind of empty,” said Mary Shirley, director of client services at I Click rate Horizon Media, in an interview with eMarketer. “That’s like when I Click-aways you have completion rates or starts and stops, but without having insight into the audience.” I Video unmutes I Video mutes “What can also be difficult is getting the data I Cost per engagement all in one place, in a timely manner, to help us make decisions. That’s a common Traffic and sharing struggle with managing data.” —Mary Shirley, I Referral source director of client services at Horizon Media,in an interview I Search terms that refer viewers with eMarketer, September 2010 I Previous and subsequent websites visited I Number of video ads forwarded Measuring Video Ads 4
- 5. The overall results for some of those metrics, as shown in most of the A series of performance metrics from Unicast shows how results charts in this report, work best as rough benchmarks for measuring vary depending on the video ad’s format (several of these formats any specific video ad campaign. DoubleClick, for instance, found a are proprietary to the company). For example, average play time 50% completion rate for video ads in December 2009. ranged from a mere 0.09 seconds up to 23.72 seconds. US Online Ad Campaign* Metrics, Dec 2009 Performance Metrics for US Rich Media and Online 0.1% Video Ad Campaigns, by Format, Q1 2010 Clickthrough rate (CTR) Interaction rate 2.5% Clickthrough rate Average video play time (seconds) Expansion rate 2.8% Interaction rate Average engage time (seconds) Video complete rate 50.0% Average ad display Average interaction time (seconds) 9.0 time (seconds) Average display time (seconds) 34.6 Average expanding time (seconds) 4.7 Note: *image, flash and rich media campaigns Transitional 2.88% 0.39% 12.39 4.23 - Source: DoubleClick, "2009 Year-in-Review Benchmarks," July 19, 2010 Branded canvas 0.97% 7.23% 37.54 23.72 - 118096 www.eMarketer.com Wallpaper 0.89% - 70.42 - - 118096 Floating expandable 0.39% 0.04% 71.22 0.09 8 Data from Eyeblaster (now MediaMind) shows a similar video Pushdown 0.34% 0.63% 73.79 8.84 24 completion rate—about half of the video ads in North America. Synchronized banners 0.31% 0.01% 69.55 - 57 Note that the 51% completion rate was carved out of only the 27% In-page banner 0.19% 1.64% 50.22 14.28 16 of videos that users started, and not out of all the video ads that Expandable multipanel 0.18% 3.48% 61.72 12.35 11 Video cube 0.15% 4.23% 150.47 9.01 - were served. Those subtle details about connected metrics are Messenger 0.13% 19.91% 175.31 10.47 51 crucial when gauging the usefulness of video ad data. Expandable single panel 0.12% 3.64% 59.26 11.28 9 Peelback 0.05% 0.08% 78.60 13.22 40 Online Video Metrics Worldwide, by Region, Q4 Source: Unicast, "Analytics Benchmark Report Q1 2010," Jul 7, 2010 2008-Q3 2009 117730 www.eMarketer.com Share Video fully Video 117730 of played rate started video rate The same series also varies by industry and within an industry. For impressions instance, the average video play time peaked at 48.61 seconds for Europe 40% 47% 32% technology ads but reached only 8.84 seconds for ads from the Latin America 38% 42% 14% advertising-marketing industry. North America 29% 51% 27% Australia and New Zealand 28% 54% 26% Performance Metrics for Rich Media and Online Video East Asia 18% 43% 37% Ad Campaigns for Select US Industries, Q1 2010 Total 35% 48% 30% Clickthrough rate Average video play time (seconds) Note: share of video impressons out of rich media impressions Interaction rate Average engage time (seconds) Source: Eyeblaster, "Online Video Advertising: Doubles Engagement, Boosts ROI," provided to eMarketer, November 18, 2009 Average ad display 108720 www.eMarketer.com time (seconds) 108720 Pharmaceutical 0.89% 1.66% 131.65 25.45 21 Telecom/utility 0.66% 1.00% 71.01 22.70 20 Technology 0.63% 1.04% 83.78 48.61 36 Advertising/marketing 0.53% 3.90% 124.45 8.84 33 Restaurants 0.43% 0.38% 63.78 14.18 15 Travel/tourism 0.29% 2.99% 110.06 24.38 28 Automotive 0.28% 1.05% 67.14 9.95 9 Education 0.27% 0.02% 81.07 11.50 14 Finance/insurance 0.23% 2.12% 63.17 17.30 10 Internet services 0.15% 0.26% 53.40 12.32 12 Politics/government 0.15% 0.04% 92.15 11.53 24 Consumer electronics 0.14% 1.02% 63.96 9.60 20 Source: Unicast, "Analytics Benchmark Report Q1 2010," Jul 7, 2010 117726 www.eMarketer.com 117726 Measuring Video Ads 5
- 6. Was that short time because targeted viewers of those ads are Completion Rates savvy about advertising, and therefore knew how quickly they Marketers gravitate toward completion rates and associated could escape the ad? Was that long time because technology ads metrics—such as percentage completed and number of views— are more inherently interesting? Those are the kind of questions because at their best, they suggest the simple possibility that the video marketers need to ask to interpret these numeric metrics. audience has viewed the video ad. “I think the marketplace has The specific numbers matter less than the concept: Marketers can pretty much sussed out the best metrics and standards, particularly derive more meaning from metrics such as video play time when completion time and rate,” said Doug Chavez, director of digital they compare their results to their previous campaigns or averages marketing at Del Monte Foods, in an interview with eMarketer. for their own industry rather than cross-industry comparisons. “It’s a folly that marketers do—putting too much emphasis on one Besides using metrics to evaluate video advertising’s or two metrics,” Chavez added. “We look at how the metrics tell us effectiveness, marketers use many of the same tools to determine the story. The ones that work the best for us are completions and costs. Ad agency executives polled by BrightRoll early in 2010 percentage of completions.” cited three metrics in particular that help them work out video ad Further, the average completion rates for pre-roll video ads in 2009 costs: view (45%), engagement (34%) and impression (16%). was significantly higher than the average click-through rates, Metric on Which US Ad Agency Executives Would according to YuMe. Most Like to Base Online Video Ad Spending, Q1 2010 % of respondents Average Completion and Clickthrough Rate for US Pre-Roll Online Video Ads, Q1-Q4 2009 Q1 Q2 Q3 Q4 2009 Other 2009 2009 2009 2009 5% Cost per Clickthrough rate 1.88% 1.42% 1.11% 0.74% 1.05% impression Completion rate 74.4% 74.8% 67.7% 66.3% 68.9% 16% Cost per Note: among 500+ publishers in YuMe network video view Source: YuMe, "Video Advertising Metrics report," January 31, 2010 45% 111260 www.eMarketer.com Cost per 111260 engagement 34% Logically enough, 15-second ads achieve higher completion rates than 30-second ones in 2009, averaging 71% vs. 63%, respectively. Source: BrightRoll, "BrightRoll Video Advertising Report: Q1 2010," Average Completion Rate for US Online Video Ads, by April 22, 2010 Video Length, Q1-Q4 2009 114571 www.eMarketer.com Q1 Q2 Q3 Q4 2009 114571 2009 2009 2009 2009 Note that the cost factor is based on a significant trade-off: 15 seconds 79% 79% 74% 67% 71% generally lower pricing for ads distributed on video networks vs. 30 seconds 65% 66% 61% 62% 63% higher pricing but more control of placement when buying Note: among 500+ publishers in YuMe network premium inventory. Source: YuMe, "Video Advertising Metrics report," January 31, 2010 111259 www.eMarketer.com While video advertising’s costs are higher than other online ad 111259 formats, lower costs may not always be the best bet.“The cheapest views are not always the best choice, because “Viewing to completion is a red herring— sometimes more expensive properties are more effective,” said that’s just a signal, but it can be misleading. Strong at Alberto Culver. The real question: Did it make an impact on the viewer?” —Jason Krebs, executive vice president at ScanScout, in an interview with eMarketer, September 2010 Measuring Video Ads 6
- 7. A variety of factors potentially influence completion rates. Research found the highest completion rates for repurposed These include: TV commercials was from retail outlets (nearly 60%) and for made-for-the-web video ads from food and beverage companies I The quality of the video ad’s creative, or how compelling it is (44%). The lesson there could be that the origin of the video ad I The type of video creative, whether recycled from TV or unique creative might be less important than its quality, relevance for to the web viewers and the type of product advertised. I The site where it’s placed, both for elements like audience Online Video Ad Completion Rate, by Format demographics and page clutter and Industry, April 2010 % of US online video viewers I The video content it is streamed with, and how much viewers Retail outlet—repurposed TV value that content 73.2% 59.9% I The way the ad is initiated, whether auto-play as a pre-roll or Retail outlet—made-for-web video click-to-play as a banner 37.6% I The size of an in-banner video ad, and whether or not it’s expandable 29.7% Technology—repurposed TV I The advertiser’s industry, and how much its products are 55.0% high engagement 23.3% Technology—made-for-web video Of course, many people view only a portion of an online video ad, 34.4% clicking away before completion. For that reason, many marketers 21.9% value metrics that show what percentage of an ad gets viewed. Media/entertainment—repurposed TV Furthermore, knowing that many people only watch a part of an 40.8% ad can influence the ad’s creative. 18.5% Media/entertainment—made-for-web video “Can we deliver the most salient pieces in the first 15 seconds? 34.9% Everything beyond that is gravy,” said Chavez. “That’s why the 17.4% percentage of the whole ad is the most important metric for us.” Food/beverage (CPG)—repurposed TV 40.4% 16.5% “Make sure to get the brand communications Food/beverage (CPG)—made-for-web video at the start of the video.” —Stephen Strong, global 57.5% interactive director at Alberto Culver, in an interview with 44.0% eMarketer, September 2010 Halfway Completed Note: n=20,302,612 streams In addition to simply computing completion rates and percentage Source: Dynamic Logic and TubeMogul, "The State of Online Video," June 2010 viewed, marketers examine where the audience abandons the 119485 www.eMarketer.com video ad for further insight. “We look at completion rates and where 119485 people are pausing video, to make some value judgment about what people find most interesting,” said Horizon Media’s Shirley. “Time viewed and completion rates are the most valuable [server] metrics.” —Jeff Smith, Giving the audience a choice in how marketers deliver their vice president of solutions, Vizu, in an interview with messages seems to offer value for video ads. User-initiated ads got higher completion rates at every stage than ads that started eMarketer, September 2010 without user control. 119486 “Branding clients are most concerned about brand studies and view to completion.” —Nicole Haygood, vice president interactive media director, Draftfcb, in an interview with eMarketer, September 2010 Measuring Video Ads 7
- 8. The flip side of completion rates are click-away rates, when users “Within video, engagement is important. Is depart the video ad before content even starts playing. the window active? Are they muting it? How Data from TubeMogul indicates that length of the ad might have much time are they spending with the ad? little to do with the audience leaving, since 15-second pre-rolls on Are they passing it along to friends? Are they newspaper-magazine sites had a higher click-away rate (24.6%) commenting about the ad on YouTube?” than 30-second pre-rolls running before TV clips. Marketers can —Nicole Haygood, vice president interactive media director use the range of completion rate metrics to determine both the at Draftfcb, in an interview with eMarketer, September 2010 site and type of content to place their video advertising. Engagement cannot be reduced to a single set of metrics. In Click-Away Rates* for Online Video Pre-Roll Ads, by describing what engagement means for her firm, Horizon Media’s Site Type and Ad Length, 2010 Shirley told eMarketer: “We try to look holistically at all the metrics % share we have, to make inferences about which environments drive Video-sharing site pre-rolls behaviors and actions, such as whether people are actually 38.4% watching the video or sharing it.” Newspaper/magazine sites —15-second pre-rolls 24.6% Interactions and time spent were two of the three most cited TV clips — 30-second pre-rolls metrics for measuring engagement with online video advertising 16.5% in an April 2010 survey from Tremor Media and DM2PRO. Over 70% TV clips — shorter pre-rolls of the advertiser and agency respondents also cited an increase in 9.3% brand lift (see the “Performance Metrics” section of the report). Note: *before content starts playing Source: TubeMogul, "Online Video Best Practices: Data-Driven Strategies for Increasing Online Video Viewership," May 15, 2010 Important Engagement Metrics for Measuring Online 120331 www.eMarketer.com Video Advertising According to US 120331 Advertisers/Agencies*, April 2010 Some say that completion rate metrics are limited for many brand % of respondents marketers who use online video advertising. “Time viewing and User interaction completion rates are valid progress metrics, but they’re not the 73.6% end information I’m looking for—which is if the brand achieved its Measured increase in brand awareness or message association 71.2% primary objective,” said Jeff Smith, vice president of solutions for Vizu, in an interview with eMarketer. Time spent 63.9% Purchase Engagement 58.6% Although engagement can be hard to pin down, it offers Completion rate 56.7% numerous possibilities when used to measure video advertising. No wonder more and more marketers have embraced the idea of Impact on search behavior 34.3% engagement for online video, not just as a buzzword but as a Number of times forwarded reality that can be measured. 25.8% Based on eMarketer’s research and interviews with industry Note: n=104; *who indicated "extremely important" or "very important" executives, here are several ways to define the engagement Source: Tremor Media and DM2PRO, "State of Online Video 2010," April 12, 2010 metric for online video advertising: 115591 www.eMarketer.com 115591 I Time spent with video, such as total time, percentage of total ad The question of whether time or interactions are more vital to viewed, average time (in seconds) that a user has spent engagement is more subjective than scientific. “Engagement for us positively interacting with the ad. means the brand equivalent of a direct-response measurement: I User interactivity or taking some action to start the video, Users could click on or roll-over an ad. We price on engagement,” including all types of mouse interactions, such as clicks, mouse said Troy Young, president of SAY Media (formerly Video Egg), in an roll-overs, making a video player or window active, expanding a interview with eMarketer. “But there’s more value in the impression video banner and unmuting the sound. than engagement—things like how much time did they spend. We know there are 12 rollovers for every engagement.” I Viral video ad links, when the video is so entertaining or compelling that people share it with others. I When marketers know in some way that they’re making a connection with viewers. Measuring Video Ads 8
- 9. “Time viewed is a proxy for engagement.” “We have some very emotional brands, such —Jeff Smith, vice president of solutions, Vizu, in an as with-Milk Bone, where we don’t just use interview with eMarketer, September 2010 a repurposed 30-second spot. Whether on publishers’ sites or our Facebook page, we Perhaps some blend of time combined with interactivity is the most look at how much people engage with the comprehensive server-based metric for engagement. The “Global brand besides the video ad itself.” Benchmark Report 2010” from Eyeblaster (now MediaMind) shows —Doug Chavez, director digital marketing at Del Monte that compared with static banner ads, video lifts the dwell rate— Foods, in an interview with eMarketer, September 2010 defined as the average number of seconds consumers spend doing some user-initiated interaction—and the dwell time alike. Measuring social engagement can sometimes mean examining the influence of repurposed TV commercials—whether on Dwell Rate and Dwell Time Worldwide, Nonvideo Ads YouTube or embedded on individual Facebook pages (if the vs. Video Ads, 2009 marketer gets virally lucky). Increasingly, though, online video ads Nonvideo Video % lift are made just for the web and are often longer-length content with Dwell rate* 6.31% 8.16% 29% more subtle branding messages. Average dwell time (seconds) 31.10 57.02 83% Note: *cumulative instances of where a user interacted with the ad divided “It will be interesting to see how advertisers will move outside of by served impressions using the same assets online as they use in TV,” said Shirley. “More Source: Eyeblaster, "Global Benchmark Report 2010," provided to eMarketer, May 5, 2010 branded content is one of the ways to go, where we’re starting to 114957 www.eMarketer.com take some of our clients…. Using Visible Measures, we’re looking 114957 for impact on social spaces, to see if we get people talking about it. Putting metrics aside, engagement implies some degree of We look at the brand mentions our clients get, which helps put connection between consumer and brand. In that light, most some value on using branded content.” marketers see brand health studies—or brand equity scores, as in Among companies that have a social media marketing strategy, this Association of National Advertisers study—as a significant respondents cited branded content (73%) and video (51%) as metric for measuring how much the emotional benefits of a brand content they used for campaigns. have touched consumers. Content Used for Social Media Campaigns, Metrics Used to Measure Success of Communicating Emotional Benefits of a Brand According to US June 2010 Marketers, April 2010 % of US companies that currently have a social media % of respondents strategy Branded content you create Advertising tracking 73% 75% Expert content Brand equity scores 72% 75% Videos Copy testing 54% 51% Number of fans on a social media site User case studies 36% 45% Number of people who provide their e-mail address to a brand User content/reviews 21% 41% Information on sales/specials or discount Source: Association of National Advertisers (ANA), "The Brand Management Survey" as cited in press release, May 18, 2010 40% 115461 www.eMarketer.com Advertising 115461 35% Measuring video advertising’s effects in social media spaces is Repurposed content from a media company another key part of the engagement concept. Potential 29% engagement metrics in social media include word-of-mouth, link Talk backs/forums sharing and comments about video ads on sites such as YouTube. 29% Games or contests 22% Pre-/post-sales Q&A 17% Source: King Fish Media, HubSpot and Junta42, "2010 Social Media Usage, Attitudes and Measurability: What Do Marketers Think?" Aug 11, 2010 118705 www.eMarketer.com 118705 Measuring Video Ads 9
- 10. Performance Metrics Some think that brand-lift metrics may be undervalued, since marketers accustomed to server-based data often want the immediacy of metrics like time viewed or clicks. However, The most commonly used panel- or survey-based survey-based measurement offers brand marketers insight into brand-lift (aka, brand-health) performance their video advertising that is useful for gauging what happened as metrics include: well as for planning. “We look at traditional brand-health metrics, working with I Aided awareness InsightExpress, Dynamic Logic or Vizu,” said Del Monte’s Chavez. I Unaided awareness “We absolutely measure what we’ve learned from any campaign, and then in the next iteration of the campaign optimize it using I Online ad awareness that research.” I Message association One choice marketers make when selecting a brand-health survey company over another is depth vs. speed. With I Brand favorability InsightExpress and Dynamic Logic, for example, marketers I Purchase intent typically ask the audience a series of questions regarding how the video ads are affecting their brand perception, which potentially Marketers have used these classic brand-lift metrics since before the offers great insight. On the other hand, with Vizu, “you can’t get internet, mainly for understanding the effects of TV commercials. depth of info, but it’s in real time, so they’re great for a campaign And while online marketers can use these metrics to measure the where we need to adjust quickly,” said Draftfcb’s Haygood. success of static banner ads, for example, they have far greater meaning for video advertising for two reasons:Video ads are mainly One weakness of survey-based measurement for online video the province of brand marketers, and the higher costs of video force advertising is the survey itself. “Survey participation is getting marketers to prove their case to their bosses and clients. harder and harder, which raises the cost of research. Decreased survey participation requires larger campaigns—more impressions—to evaluate effectively,” said Zahtila. He defined “We tend to bundle brand-health measurement larger campaigns as about 100 million impressions, in contrast to into most campaigns. For companies five years ago when large meant only 40 million. repurposing their 30-second TV spot, they might not have to justify it with brand surveys. “Surveys are getting longer,” Zahtila continued,“which makes it With our custom content, we have to do it.” harder for live intercepts to get people. The longer the survey, the harder to get a sample. But the longer the survey, the more useful —Stephen Strong,global interactive director at Alberto Culver, the information.” in an interview with eMarketer, September 2010 In general, video advertising results show uneven lifts in survey Brand marketers still new to online video advertising are more metrics. In one example, from “The State of Online Video” study accustomed to brand-lift metrics and get more meaning from from Dynamic Logic and TubeMogul, online ad awareness got a them. “Interactive rates and click rates are too granular; they’re for greater boost than, say, purchase intent. the appendix,” said Strong. “When we present reports to our brand teams, they could not care less about those metrics.” However, while survey-based metrics give marketers insights that are unavailable from server-based data, they have fundamental limits. “Understanding how brand perceptions have changed doesn’t say how much you can sell,” said Joe Zahtila, chief operating officer at Dynamic Logic, in an interview with eMarketer. “That gets you to the 10-yard line, but it doesn’t give you the touchdown.” “You may change attitudes with video advertising and still not change sales. You know what you’ve got but you don’t know why.” —Joe Zahtila, chief operating officer at Dynamic Logic, in an interview with eMarketer, September 2010 Measuring Video Ads 10
- 11. The specific numbers matter less here than the implications: At In a comScore report, “Getting Beyond Big in Online Video,” this early point in its usage, and based on the marketer’s objective, specific brand-metric results highlight the choices between any specific online video advertising campaign will tend to get repurposed ads vs. the web-only kind. Which performed better on better results for one brand metric over most of the others, such the internet: repurposed TV commercials or video ads made just as awareness getting greater lift than purchase intent. for the web? Online Advertising's Effect on Brand Metrics As with the other brand-metric variables, the answer depends on in the US, by Format, Q4 2009* context, audience and objective. For instance, online ad awareness average delta** above control gets a bigger lift from repurposed video ads than made-for-web Online ad awareness video. Also, purchase intent is higher for made-for-web ads among 3.2 those ages 18 to 34 but flat among the other two age groups. 2.4 1.8 Online Video Advertising's Effect on Brand Metrics Brand favorability Among US Internet Users, by Type of Video and Age, 1.5 Q4 2009* 0.7 average delta** above control 0.2 18-34 18-34 repurposed TV made-for-web video Aided brand awareness Online ad awareness 5.9 4.6 1.3 Aided brand awareness 2.5 2.0 1.0 Purchase intent/consideration 1.1 2.8 0.6 Brand favorability 0.4 1.3 Purchase intent/consideration 35-49 35-49 1.1 repurposed TV made-for-web video 0.7 Online ad awareness 4.6 3.4 0.4 Aided brand awareness 3.3 1.2 Message association Purchase intent/consideration 0.7 0.6 0.8 Brand favorability 1.5 2.0 1.0 50+ 50+ 0.8 repurposed TV made-for-web video Online ad awareness 4.7 3.7 Online video Rich media Simple Flash Aided brand awareness 3.0 1.7 Note: online video n=307 campaigns and 362,098 respondents; rich media Purchase intent/consideration 0.7 0.5 n=1,203 campaigns and 1,511,268 respondents; simple Flash n=1,183 campaigns and 1,507,596 respondents; *includes 3 years through Q4 2009; Brand favorability 1.0 1.4 **delta defined as point difference in exposed vs. control groups Note: repurposed TV n=59 campaigns and 75,045 respondents; made for Source: Dynamic Logic and TubeMogul, "The State of Online Video," June web video n=135 campaigns and 150,028 respondents; *includes 3 years 2010 through Q4 2009; **delta defined as point difference in exposed vs. 119473 www.eMarketer.com control groups 119473 Source: comScore, Inc., "Getting Beyond Big in Online Video" as cited by Dynamic Logic and TubeMogul, "The State of Online Video," June 2010 Several factors will influence the potential range of results in 119479 www.eMarketer.com brand-health studies. These include: 119479 I The advertiser’s industry I The type of the creative I The quality of the creative I The site where the ad runs I The targeting of the video ad campaign I The advertiser’s objectives, such as awareness vs. purchase intent One unresolved issue for online video advertising: Do brand marketers benefit more from recycled TV commercials or from videos made for online usage? Dynamic Logic research released in September 2010 found that “repurposed TV spots result in higher brand awareness metrics; however, video content produced specifically for the online space is far more likely to influence purchase decisions.” Measuring Video Ads 11
- 12. Another influence on the various survey metrics is where a Two Branding Funnels marketer’s particular goals fall within the branding funnel. Two points of interest: There are two basic ways to build an advertising objective funnel: By using traditional brand-health I Well-known brands got less of a lift for all four metrics than metrics like awareness and intent, or using a more brands with a lower profile, since the more-familiar brands have direct response-focused branding-ROI perspective. less room for growth. Having a clear picture of branding goals—and their I Online video had greater effect on awareness, in most cases, place in the funnel relative to audience size—helps marketers filter the data they gather to best than on other points in the funnel, such as favorability or interpret video ad metrics. purchase intent. Online Video Advertising's Effect on Brand Metrics in the US, by Type of Video and Brand, Q4 2009* Two Branding Funnels average delta** above control Medium/low-awareness brands on repurposed TV Advertising Objective Funnel #1 5.7 Audience Size 5.4 1.4 Awareness 1.2 Medium/low-awareness brands on made-for-web video Attitude 5.2 Favorability 5.0 3.1 Intent 1.9 High-awareness*** brands on repurposed TV Preference 4.2 0.6 Advertising Objective Funnel #2 1.1 0.6 Audience Size High-awareness*** brands on made-for-web video Exposure 4.0 1.2 Awareness 1.2 1.3 Attitude change Online ad Aided brand Brand Purchase intent/ Sales awareness awareness favorability consideration Note: n=307 campaigns and 362,098 respondents; *includes 3 years through Profit Q4 2009; **delta defined as point difference in exposed vs. control groups; ***brands that are well-known Source: Dynamic Logic and TubeMogul, "The State of Online Video," www.eMarketer.com June 2010 120440 119476 www.eMarketer.com 119476 At this stage in video’s development, marketers rarely use more complex forms of interactive targeting with video ads, particularly behavioral. However, traditional demographic and contextual targeting choices affect video branding results online just as they do with television spots. Measuring Video Ads 12
- 13. Data from the Online Publishers Association (OPA) and Dynamic The consequences of targeting for effective video advertising Logic shows that video advertising on 77 OPA member sites— measurement was emphasized by 46.4% of the marketers typically major media companies—had a greater lift for all metrics surveyed by Datran, who said accurate audience measurement is than on portals or the average MarketNorms database. very important for driving increased brand awareness. Online Video Advertising's Effect on Brand Metrics in Importance of Accurate Online Audience the US, Q4 2009 (average delta* above control) Measurement in Driving Increased Brand Awareness, Branded MarketNorms® Portals Revenues and/or Performance According to Marketers content sites database Worldwide, December 2009 (OPA members) % of respondents Aided brand awareness 3.7 1.3 1.9 Not at all Online ad awareness 7.8 3.4 4.1 3.2% Unsure 9.6% Message association 3.8 1.3 2.6 Brand favorability 2.4 1.2 1.8 Very Purchase intent 2.6 0.8 1.3 46.4% Note: OPA n=77, MarketNorms® n=294 and Portals n=113; *delta defined Somewhat as point difference in exposed vs. control groups 40.8% Source: Online Publishers Association (OPA) and Dynamic Logic, "Improving Ad Performance Online: The Impact of Advertising on Quality Content Sites Wave IV," April 27, 2010 114862 www.eMarketer.com 114862 Source: Datran Media, "4th Annual Marketing & Media Survey," April 1, 2010 113783 www.eMarketer.com For additional information on this chart, see the Endnotes section. 113783 “Since a lot of our clients are focused on branding, we had to hold ourselves to metrics beyond conversion. We needed to find ways to measure awareness and favorability.” —Mary Shirley, director of client services at Horizon Media, in an interview with eMarketer, September 2010 Note that most of the charts used in this section came from Dynamic Logic, largely because it publishes more branding metric data than its competitors, including InsightExpress, comScore, Vizu, KN Dimestore and Nielsen. However, the trends shown are not unique to Dynamic Logic’s system for divining how consumers feel about brands. The classic control-exposed methodology is common to most brand-health studies. Furthermore, online brand metrics are gathered through audience panels or surveys—typically pop-up windows that ask users if they would answer a few questions.(For more info on each firm’s offerings, see the “Video Measurement Companies” section of the report.) Since several of the brand-health measurement vendors depend on audience survey data for their results, accurate ad targeting is essential for getting the most viable results. For example, a poorly targeted video ad might get significant lift for awareness—simply because the ad was entertaining—but purchase intent could be flat if the audience was not right. Imagine the brand-lift results for a great woman’s beauty product commercial on a men’s-oriented video site like Break. Measuring Video Ads 13
- 14. Video Clicks and Other Concerns Even more telling, 97.6% of the Datran respondents said click-throughs are very or somewhat important.With such attitudes, a focus on clicks often becomes pervasive, even when they offer little real While clicks are useful for direct response understanding of a video ad campaign’s effectiveness. objectives, brand marketers need to gauge more Level of Importance of Online Measurement Metrics subtle metrics. And while clicks may gain more According to Marketers Worldwide, December 2009 % of respondents currency with clickable-video ads, at this point Conversions 1.6% they’re relevant mainly for online retailers. 89.8% 7.9% 1.6% However, one might not realize how irrelevant clicks are to video ads Clickthroughs 3.1% if you looked at this data from Datran Media.While not video-specific, 56.7% 40.9% the result points to how clicks continue to capture the greatest 0.8% mindshare (72%) among online metrics, according to the survey. 3.1% Unique views 41.7% 41.7% 14.2% Online Measurement Metrics Used by Marketers Worldwide, December 2009 Audience composition 6.3% % of respondents 36.2% 52.8% Clicks 72.0% 6.3% Impressions 3.9% Conversions 59.2% 26.0% 56.7% 15.7% Impressions 58.4% Page views 2.4% Transactions 43.2% 24.4% 55.9% 21.3% Audience 43.2% Time spent with media 6.3% All of the above 44.8% 20.5% 50.4% 22.8% Source: Datran Media, "4th Annual Marketing & Media Survey," April 1, 2010 Very important Somewhat important 113780 www.eMarketer.com Not important I am not familiar with this metric 113780 Note: numbers may not add up to 100% due to rounding Source: Datran Media, "4th Annual Marketing & Media Survey," April 1, 2010 “The click is the most minimal form for 113784 www.eMarketer.com proving effectiveness.” —Jason Krebs, executive 113784 vice president at ScanScout, in an interview with eMarketer, September 2010 “When it comes down to how my campaign has helped my business, clicks are irrelevant.” —Stephen Strong, global interactive director at Alberto Culver, in an interview with eMarketer, September 2010 And yet the weak video advertising clickthrough rates are still tracked and reported, as in data from DoubleClick’s white paper “2009 Year-in-Review Benchmarks,” where the clickthrough rates top off at 0.18% for half-page expandable video ads. US In-Page and Expandable Online Video Advertising Clickthrough Rates (CTR), by Ad Size, Dec 2009 In-page Expandable Wide skyscraper (160x600) 0.10% 0.11% Skyscraper (120x600) 0.13% 0.10% Medium rectangle (300x250) 0.12% 0.12% Leaderboard (728x90) 0.06% 0.08% Large rectangle (336x280) 0.12% 0.15% Half-page ad (300x600) 0.11% 0.18% Source: DoubleClick, "2009 Year-in-Review Benchmarks," July 19, 2010 118099 www.eMarketer.com 118099 Measuring Video Ads 14
- 15. “The only metric that should be jettisoned Other Problems for online video advertising is clicks. Clicks Besides having a pervasive overemphasis on clicks, marketers have are dragging down brand advertising online, other issues when it comes to measuring online video advertising. and therefore video advertising.” —Jeff Smith, I Too much data. One snag is familiar for much of online vice president of solutions at Vizu, in an interview with advertising—more information than marketers can meaningfully eMarketer, September 2010 use.“Measurement is fine right now, there’s no lack of data available,” said Jason Krebs, executive vice president at ScanScout, However, clicks and video ads may be more useful than those in an interview with eMarketer.“In fact, there’s too much data, general datapoints show. Self-reported data from Experian Simmons which doesn’t tell an advertiser if their business is successful.” shows that over 1% of all respondents—and 1.69% of millennials— say they click very often on full-motion online video ads. I Not enough value. Sometimes the extra cost for online video advertising is not offset by equally valuable metrics. “Most of the Frequency of Clicking on Full-Motion Online Video time for video we’re paying premium. But we’re getting only the Ads, Dec 2009 % of US millennial internet users vs. total internet users same metrics we get with banners,” said Draftfcb’s Haygood. “We wish we could place more pixels so we could know more, Very often like when people mute midstream. Video is such an easy 1.69% 1.07% translation for clients, but they’re paying premium and not Often getting enough learning out of it.” 2.99% I Inaccurate data. Even basic metrics such as impressions can 1.92% be misleading for marketers. “We think the impression is a very Somewhat often 4.30% difficult measure for the online world, because it can be so easily 2.91% gamed,” explained SAY Media’s Young. “Impressions can appear Not very often below the fold, on a background tab or some other place where 9.65% no one really sees them.” 8.02% Over one in five agency executives told BrightRoll that video Not at all 68.80% ads below the fold were the biggest problem affecting online 68.80% video advertising. Millennial internet users Total internet users Biggest Problem Affecting Credibility of Online Video Note: n=19,110 Advertising According to US Ad Agency Executives, Source: Experian Simmons, "National Consumer Study," provided to Q1 2010 eMarketer, July 15, 2010 % of respondents 120336 www.eMarketer.com 120336 The main takeaway here: Other 9% I If video ads draw click rates over 1%, it’s worth looking at why. Ads that appear Autostart below the fold 43% I If video ads draw click rates lower than 1%, don’t worry—look at 22% the more meaningful server-based metrics instead. Misrepresented preroll 26% Source: BrightRoll, "BrightRoll Video Advertising Report: Q1 2010," April 22, 2010 114572 www.eMarketer.com 114572 14Measuring Video Ads 15
- 16. “There are a lot of ways an impression is not Measuring Across Channels an impression, because people don’t see it.” —Troy Young, president of SAY Media, in an interview with Online video advertising’s similarity to TV eMarketer, September 2010 commercials—both in format and usage— I Limited targeting, limited measurement.“There’s a highlights the growing need to measure across common shortsight among marketers—they want to limit the both platforms. analysis of their advertising to their target market, like women 18 to 34 for CPGs,” said Dynamic Logic’s Zahtila. But if you focus on “It’s important to compare video online with broadcast and only your target market, he noted, you don’t know how well cable—not just the ads, but also the investment of online with TV,” you’re reaching those outside that group. You might, for said Horizon Media’s Shirley. “How much do we put against one example, be unaware of an unexpected demographic who might creative vs. another?” be interested in your product, like a husband buying goods for the household. And you miss the opportunity to target ads for Shirley also noted that the process of comparing the internet with those beyond your primary demographic. television is improving. “We’re getting a lot better at looking at the online video audience compared with TV, being able to talk about I Brand survey gaps. As more and more marketers hire vendors online metrics similarly to GRPs,” she said. to do brand-health studies, internet users are exposed to numerous surveys. Many say no. “The biggest challenge among GRPs calculate advertising exposure by multiplying reach times survey companies is to get completed surveys—traditionally the average frequency for a TV or video ad buy. While eMarketer done with banner companions running alongside video players,” has covered this prime cross-channel metric since our December said Vizu’s Smith. 2002 report, “Interactive Marketing: Stats, Strategies and Trends,” the digital GRP is still not fully mature. Even though some say online GRPs are not needed because they fail to take into account the internet’s unique interactive qualities, measurement companies like Nielsen and comScore introduced revamped GRP-oriented services in late September 2010.(For more on the various video ad measurement vendors, see the “Video Measurement Companies” section below.) “Media buyers say having an online GRP has the potential to give marketers a way to do apple-to-apple comparisons of media,” reported the Wall Street Journal in a September 2010 article about Nielsen’s new service. “Having the information, they say, could lead to advertisers shifting more of their ad budgets to the internet from other media like television.” Whether marketers are running repurposed TV commercials online, or creating new video ads just for the web, the need for more unified metrics is clear since typically it’s the same marketer trying to reach its target audience. Measuring Video Ads 16