SlideShare une entreprise Scribd logo
1  sur  43
Télécharger pour lire hors ligne
Current Environment ............................................................................................1
Industry Profile....................................................................................................12
Industry Trends ...................................................................................................17
How the Industry Operates...............................................................................21
Key Industry Ratios and Statistics...................................................................26
How to Analyze a Computer Hardware Company ........................................28
Glossary................................................................................................................32
Industry References...........................................................................................35
Comparative Company Analysis .........................................................Appendix
This issue updates the one dated April 22, 2010.
The next update of this Survey is scheduled for April 2011.
Industry Surveys
Computers: Hardware
Thomas W. Smith, CFA, Computer Hardware Analyst
October 28, 2010
CONTACTS:
INQUIRIES & CLIENT RELATIONS
800.852.1641
clientrelations@
standardandpoors.com
MEDIA
Michael Privitera
212.438.6679
michael_privitera@
standardandpoors.com
REPLACEMENT COPIES
800.852.1641
Standard & Poor’s
Equity Research Services
55 Water Street
New York, NY 10041
Topics Covered by Industry Surveys
Aerospace & Defense
Airlines
Alcoholic Beverages & Tobacco
Apparel & Footwear:
Retailers & Brands
Autos & Auto Parts
Banking
Biotechnology
Broadcasting, Cable & Satellite
Chemicals
Communications Equipment
Computers: Commercial Services
Computers: Consumer Services &
the Internet
Computers: Hardware
Computers: Software
Computers: Storage & Peripherals
Electric Utilities
Environmental & Waste Management
Financial Services: Diversified
Foods & Nonalcoholic Beverages
Healthcare: Facilities
Healthcare: Managed Care
Healthcare: Products & Supplies
Heavy Equipment & Trucks
Homebuilding
Household Durables
Household Nondurables
Industrial Machinery
Insurance: Life & Health
Insurance: Property-Casualty
Investment Services
Lodging & Gaming
Metals: Industrial
Movies & Entertainment
Natural Gas Distribution
Oil & Gas: Equipment & Services
Oil & Gas: Production & Marketing
Paper & Forest Products
Pharmaceuticals
Publishing & Advertising
Real Estate Investment Trusts
Restaurants
Retailing: General
Retailing: Specialty
Savings & Loans
Semiconductor Equipment
Semiconductors
Supermarkets & Drugstores
Telecommunications: Wireless
Telecommunications: Wireline
Transportation: Commercial
Global Industry Surveys
Airlines
Autos & Auto Parts
Banking
Food Retail
Foods & Beverages
Media
Oil & Gas
Pharmaceuticals
Telecommunications
Tobacco
Standard & Poor’s Industry Surveys
55 Water Street, New York, NY 10041
EXECUTIVE EDITOR: EILEEN M. BOSSONG-MARTINES ASSOCIATE EDITOR: CHARLES MACVEIGH STATISTICIAN: SALLY KATHRYN NUTTALL
CLIENT SUPPORT: 1-800-523-4534. ISSN 0196-4666. USPS NO. 517-780.
VISIT THE STANDARD & POOR’S WEBSITE: http://www.standardandpoors.com
STANDARD & POOR’S INDUSTRY SURVEYS (ISSN 0196-4666) is published weekly. Annual subscription: $10,500. Please call for special pricing: 1-800-852-1641,
option 2. Reproduction in whole or in part (including inputting into a computer) prohibited except by permission of Standard & Poor’s. Executive and Editorial
Office: Standard & Poor’s, 55 Water Street, New York, NY 10041. Officers of The McGraw-Hill Companies, Inc.: Harold McGraw III, Chairman, President, and
Chief Executive Officer; Kenneth M. Vittor, Executive Vice President and General Counsel; Robert J. Bahash, Executive Vice President and Chief Financial Officer;
John Weisenseel, Senior Vice President, Treasury Operations. Periodicals postage paid at New York, NY 10004 and additional mailing offices. Postmaster: Send
address changes to Standard & Poor’s, Industry Surveys, Attn: Mail Prep, 55 Water Street, New York, NY 10041. Information has been obtained by Standard &
Poor’s INDUSTRY SURVEYS from sources believed to be reliable. However, because of the possibility of human or mechanical error by our sources, INDUSTRY
SURVEYS, or others, INDUSTRY SURVEYS does not guarantee the accuracy, adequacy, or completeness of any information and is not responsible for any errors or
omissions or for the results obtained from the use of such information.
Copyright © 2010 Standard & Poor’s Financial Services LLC, a subsidiary of The McGraw-Hill Companies, Inc. All rights reserved.
STANDARD & POOR’S, S&P and S&P 500 are registered trademarks of Standard & Poor’s Financial Services LLC. S&P MIDCAP 400 and S&P SMALLCAP 600 are
trademarks of Standard & Poor’s Financial Services LLC.
INDUSTRY SURVEYS COMPUTERS: HARDWARE / OCTOBER 28, 2010 1
CURRENT ENVIRONMENT
Computer recovery races ahead, then taps the brakes
Computer hardware markets grew at a fast pace in the first half of 2010, then shifted to a slower speed
entering the second half due to several factors, in our opinion. The outlook for growth in gross domestic
product (GDP) dampened, hardware inventory levels caught up with end-demand levels, and consumer
demand for low-priced netbook PCs ebbed, thereby reducing the outlook for personal computer (PC) unit
shipment growth. The computer industry’s progress toward what we believe will be a multi-year expansion
began after a deep downturn in late 2008 and early 2009, and a period of demand stabilization near cycle-
trough levels in mid-2009. Demand drivers in the present expansion include improving price and
performance characteristics for PCs and servers, and the need to satisfy pent-up demand for updated
technology in homes and offices.
The computer hardware industry’s burst of growth in the first half of 2010 was most evident in the PC
industry. The growth rate for PC unit shipments in the first quarter of 2010 (versus Q1-2009) was very
brisk at 27.1%, and remained brisk in the second quarter at 22.9% (compared with Q2-2009), according to
data from market research firm IDC. In our view, any year with PC unit growth near 15% is a solid year
for the industry. The last year in which the industry achieved 15% PC unit shipment growth was 2007, the
last full year before the economic downturn set in. Therefore, a unit growth rate above 20% appears
unusually perky to us, and is probably unsustainable.
A partial reason for the likely drop-off in the unit sales pace in the third quarter of 2010 stems from a
cooling of interest in netbooks. We think the adoption of low-priced netbook computers, which drive up the
unit count without significantly boosting revenues and profits, began to level off in the summer, as the
novelty faded and as an alternative—the new tablet computers—became available. Tablets are small, like
netbooks, but have more robust computing capabilities. The iconic iPad from Apple Inc., introduced for sale
into the US market on April 3, 2010, and in nine other countries in May, sold in large volumes (almost 3.3
million units by June 26, accounting for about $2.2 billion in revenue) and is spurring development of rival
tablet products. We think that any reduction in the price of the iPad (perhaps in 2011, as a second-
generation iPad device evolves) would further erode demand for netbooks.
Reflecting the tone of the late summer reported results, market research firm Gartner Inc. announced on
August 31 a cut in its forecast for worldwide PC unit shipment growth for the second half of 2010 to
15.3%, down about 2% from its prior estimate; it estimated full-year 2010 unit shipment growth at 19.2%.
Gartner noted some inelasticity of demand for consumer PCs, as people have come to demand the most
updated PCs to get personal business done. Businesses, on the other hand, were viewed as tending to put off
PC upgrades to save money in hard times. However, aging equipment suggests that businesses may not be
able to delay much longer. The average age of PCs in use by professionals is at an all-time high, according
to Gartner, though it did not give a number. PC processor maker Intel Corp. estimates the average age of
PCs to be about four to five years, which seems rickety to us, considering that both processors and
operating systems have been through several upgrades over that time.
Similar in direction and size to Gartner’s PC forecast trimming, IDC on September 2 knocked down its full-
year 2010 PC unit shipment estimate to 17% from 19.8%. Both research shops’ views were revised shortly
after Intel warned on August 27 that its third-quarter revenues were likely to be below the outlook it set on
July 13, when the company described its Q2-2010 results as its “best quarter ever.” Monthly sales data
released in mid-August by some Asian parts suppliers also telegraphed a turn towards sluggish demand for
the industry.
As this Survey was finalized in mid-October, Standard & Poor’s Equity Research was estimating global PC
unit shipments to rise about 18% in 2010, followed by an increase of 15% in 2011, reflecting further
economic recovery and the persistent need to maintain effective information technology (IT) systems. As
2 COMPUTERS: HARDWARE / OCTOBER 28, 2010 INDUSTRY SURVEYS
usual, we expect PC industry revenues to grow more slowly than unit shipments, reflecting the continuation of
a long-term trend toward lower average selling prices per unit. We project global PC industry revenue growth
near 12% in 2010 and 9% in 2011.
On a worldwide basis, PCs are the largest
segment of the computer hardware industry.
Despite a savage slump in the first half of
2009, the upswing in computer markets late
that year was sufficient to bring worldwide
PC unit shipments for all of 2009 up 3.0% to
about 296 million units, according to IDC’s
June 2010 tally. Nevertheless, 2009 appears
as a deep valley in the accompanying chart of
global PC unit shipment growth estimates
from IDC. (These charted numbers do not
include the September downtick in IDC’s PC
unit shipment estimates for 2010 that were
discussed above.) Broadly speaking, IDC is
forecasting a return to an era of rapid
growth, marked by double-digit increases from 2010 to 2014, similar to what the industry experienced in
2002 through 2008.
In line with the economic recovery from the global downturn of 2009, we expect a boost in IT spending
overall in 2010 and 2011, but with a more visible rebound for computer hardware goods than for the
software and services categories, which suffered less during the downturn. Spending on IT should grow
about 6% in 2010, according to IDC’s view in early August, which would bring the IT industry back to its
2008 size of about $1.5 trillion. In this scenario, hardware spending would increase by about 11% to some
$624 billion. In August and September 2010, however, there was much discussion among industry observers
about whether there would be a pause or an interruption in the global economic recovery (the “double-dip”
recession scenario) or a more steady recovery. A hiccup in the recovery could lead to a flat year in 2011,
whereas continued economic growth could mean another 6% growth for IT spending in 2011 and better
performance for computing hardware.
Emerging markets, particularly in the Asia/Pacific region, should be a faster engine for PC sales during the
recovery year of 2010 and the period of continued expansion that we see for 2011 and perhaps several years
thereafter—given that it has some hotspots of economic growth and some first-time adopters. According to
IDC’s June 2010 industry snapshot, PC unit shipments in the Asia/Pacific region (excluding Japan) are
forecast to grow about 32% in 2010, faster than the 19.8% increase that the research firm projects for the
worldwide PC industry as a whole. (PC unit shipments to the Asia/Pacific region rose 13.9% in 2009, 8.8%
in 2008, and nearly 22% in 2007.) Similarly, for IDC’s “rest of the world” (ROW) category, which includes
Eastern Europe, Latin America, and the Middle East, PC unit shipments are forecast to outpace the industry
in 2010, with growth near 19%; in the following years, however, ROW growth might not keep up with that
of Asia/Pacific. Japan is the region expected to show the most modest growth in PC units over the next few
years, reflecting its economic prospects and mature PC market profile.
Rate of ASP decline normalizes in 2010
As usual, growth in worldwide PC unit shipments translates into a less robust tale in terms of dollar value,
given lower average selling prices per unit. Price competition was particularly lively in 2009 for several
reasons: the wave of lower-cost mini-notebook PCs, the intense competition for sales during a recession,
and an offensive strategy by Asia-based PC makers, notably Acer Inc. and Lenovo Group Ltd., to gain
market share in the US.
IDC estimates that average system prices (ASPs) for desktops and portables will decline only about 5% in
2010 and 6% in 2011, following decreases of almost 14% in 2009, 4.3% in 2008, and 1.3% in 2007—thus
continuing a multiyear downtrend. Reasons for the reversion to ASP declines more in line with historical
CHART H04
WORLDWIDE PC
SHIPMENT
GROWTH
WORLDWIDE PC SHIPMENT GROWTH
(In percent, based on units shipped)
11.110.7
15.2
10.0
3.0
14.4 12.8
12.0
19.8
0
2
4
6
8
10
12
14
16
18
20
22
2006 2007 2008 2009 2010 2011 2012 2013 2014
Source: IDC's Forecast Update published July 2010.
INDUSTRY SURVEYS COMPUTERS: HARDWARE / OCTOBER 28, 2010 3
trends would include greater demand for PCs as the economy improves and a relatively smaller presence of
ultraportable PCs (netbooks or mini-notebooks) in the mix. Mini-notebooks typically sell near $400 apiece,
compared with about $900 for a traditional notebook PC, which weighs on the overall ASP statistics.
Researcher Gartner expects that netbooks, which approached 20% of the PC market by unit sales in the
heyday of their early adoption in late 2009 and early 2010, will remain on the scene, but fade back to
represent only about 10% of sales in the next four or five years.
We think that average system prices for all PCs will decrease about 6% in 2010. Combined with our
projected increase in PC unit sales of 18%, this drop in ASPs will result in a 12% increase in the worldwide
dollar value of PC sales. This would represent a good year for the PC makers, and certainly a big
improvement over 2009, when the value of global PC shipments fell about 11% by IDC’s reckoning (a 3%
unit shipment gain combined with a 14% ASP decline). Most companies in the PC supply chain undertook
significant cost-cutting campaigns during the downturn that should help make the most out of any
improvement in sales or pricing as we head into 2011. We foresee the moderation in component prices since
summer 2010 helping PC makers’ profitability in the second half of 2010. We think the component
shortages appeared in the first half of this year as the PC industry ramped up unit shipments have faded, as
inventories and end-demand have come into better balance.
Portability with added features drives demand
We expect that underlying demand for PCs will be aided by ongoing adoption of operating system updates
from Microsoft Corp. (Windows 7) and Apple Inc. (Snow Leopard); a rebound in growth in emerging
economies around the world; and a continuing shift toward notebook, netbook, and tablet computers, and
wireless connectivity. Portability has been a key driver: more and more people want their own computer
and the ability to take it with them easily. PC users want to clear their desks of cords, which further drives
demand for portable PCs and wireless
accessories. In 2009, for the first time,
portables accounted for more than half of
worldwide PC shipments. In 2010, the race is
on to add touch-screen capabilities, better
video, and more robust features.
We think the variables that could dim or
brighten PC industry growth over the next
few years are largely economic growth
factors, such as unemployment levels, energy
prices, and the pace of patching up the
financial industry. Additional factors might
include a possible substitution effect, wherein
the purchase of an item such as a netbook, a
smartphone, an electronic book (e-reader), or
a tablet PC (such as Apple’s iPad) defers or
eliminates the need to buy a more expensive
desktop or full-size notebook PC. The iPad
did seem to take some wind out of the sails of the netbook boom through summer 2010. Nevertheless, we
believe the smaller-form computing devices are often an add-on purchase, rather than a substitute for a
personal computer. We think 2011 could see some swings in consumer preferences, as rival tablets and
smarter phones compete for the attention of buyers of traditional PCs.
MATURE MARKETS MAY LAG OTHER REGIONS IN PC SALES
PC unit shipments in the US grew at a modest pace of 7.0% in 2009, reflecting sales of 70.1 million units,
and could see growth rebound to 13.9% in 2010, according to a June 2010 IDC estimate. As noted earlier,
in subsequent comments, IDC tamped down its overall 2010 estimate a bit, but we have retained the earlier,
more comprehensive data shown in the table “Worldwide PC shipments forecast by region,” because this
presentation shows the relative strength of regional markets.
CHART H05:
WORLDWIDE PC
SHIPMENTS, BY
FORM FACTOR
0
100
200
300
400
500
600
2005 2006 2007 2008 2009 2010 2011 2012 2013 2014
Desktops Portables
Source: IDC's Forecast Update published July 2010.
WORLDWIDE PC SHIPMENTS, BY FORM FACTOR
(In millions of units)
4 COMPUTERS: HARDWARE / OCTOBER 28, 2010 INDUSTRY SURVEYS
Broadly speaking, the 2005–07 period was one of strong unit growth for the PC industry, with the
Asia/Pacific (excluding Japan) and rest of world (ROW) regions leading the charge, often with growth rates
exceeding 20%. The industry’s slowdown during 2008–09 hurt growth in every region. From 2010 through
2014, the pattern of the Asia/Pacific region leading growth will return, in our view, as will the pattern of
Japan showing the least growth. The other regions—US, Western Europe, and the ROW—should have some
good innings ahead, often surpassing 10% annual growth.
Beyond the economic growth factors driving PC sales, PC penetration levels are important. Mature markets
tend to have more PCs per household or per person, which traditionally has implied a more saturated market
with less growth potential. However, as more gadgets appear with some of the functions of traditional PCs
(such as netbooks, tablets, e-readers, and smartphones), many people may choose to have more than one
machine or gadget, thus expanding the market for consumer electronics with PC-like functions (if not for
traditional PCs). Thus, some mature markets may not be as saturated as previously believed.
Asia/Pacific may gain PC market share as industry rebounds
In 2009, regions outside the US accounted for over 76% of worldwide PC unit shipments. Given our
outlook for more rapid growth ahead for Asia and some other markets, we expect to see this percentage
increase toward 80% over the next five years, while the US share dwindles toward 20%. In 2009, by IDC’s
estimates, the Asia/Pacific region (excluding Japan) represented about 28% of global PC shipments; it might
grow to a 31% share in 2010 and, looking further out, a 36% share in 2014. In our view, such an increase
would reflect relatively rapid economic growth in China and its neighboring countries, and rising
penetration of PCs in the Asian regional markets.
Regions that might maintain something near their present market share while Asia grows include Western
Europe, with a 22% share in 2009 and 20% estimated for 2014, according to IDC, and the rest of world
(ROW), also with about 22% share for 2009 and 20% estimated for 2014. Japan’s share may slip from
about 5% in 2009 to roughly 3%. These numbers illustrate a significant turnabout from 2004, when the US
was the biggest region, with about 31% PC unit market share, and Asia/Pacific had 21%.
TABLE B08: WORLDWIDE
PC SHIPMENTS FORECAST
BY REGION
WORLDWIDE PC SHIPMENTS FORECAST BY REGION
2008 2009 2010 2011 2012 2013 2014
UNITS SHIPPED (THOUS.)
United States 65,554 70,131 79,897 90,320 100,878 111,183 121,345
Western Europe 65,220 65,109 73,968 83,271 93,521 103,743 112,943
Japan 14,246 13,428 15,152 14,977 15,096 15,027 14,675
Other Asia/Pacific 72,922 83,038 109,410 130,989 153,236 178,461 207,481
Rest of World 69,490 64,385 76,375 86,298 95,246 104,343 113,170
Total 287,432 296,091 354,802 405,855 457,977 512,757 569,614
MARKET SHARE (%)
United States 22.8 23.7 22.5 22.3 22.0 21.7 21.3
Western Europe 22.7 22.0 20.8 20.5 20.4 20.2 19.8
Japan 5.0 4.5 4.3 3.7 3.3 2.9 2.6
Other Asia/Pacific 25.4 28.0 30.8 32.3 33.5 34.8 36.4
Rest of World 24.2 21.7 21.5 21.3 20.8 20.3 19.9
Total 100.0 100.0 100.0 100.0 100.0 100.0 100.0
YEAR-TO-YEAR % CHANGE
United States 2.1 7.0 13.9 13.0 11.7 10.2 9.1
Western Europe 17.0 (0.2) 13.6 12.6 12.3 10.9 8.9
Japan 4.8 (5.7) 12.8 (1.2) 0.8 (0.5) (2.3)
Other Asia/Pacific 8.8 13.9 31.8 19.7 17.0 16.5 16.3
Rest of World 14.5 (7.3) 18.6 13.0 10.4 9.6 8.5
Total 10.0 3.0 19.8 14.4 12.8 12.0 11.1
Totals may not add due to rounding.
Source: IDC's Forecast Update published July 2010.
INDUSTRY SURVEYS COMPUTERS: HARDWARE / OCTOBER 28, 2010 5
PC market share: Dell duels with Acer
Comparing the market-share stories for the second quarter of 2010 and the prior-year period, the
incumbent top-six PC vendors managed to increase their market share, with the exception of Hewlett-
Packard Co. (HP) and Dell Inc., according to data from market research firm Gartner. Together, the top six
PC makers accounted for about 63.2% of worldwide PC unit shipments in Q2-2010, up from 59.9% in
Q2-2009. Thus, the long-term trend for the big to get bigger at the expense of “white box” PCs seemed on
track midway through 2010. There are several reasons for this, in our view. For one, scale advantages help
the big players extend their reach. In addition, as average selling prices fall and the absolute price difference
between a brand-name PC and a brand-X PC shrinks, customers may gravitate toward the brand names for
reputation, reliability, and service.
In the race to be top dog in the global PC
market in Q2-2010, HP was the clear winner
with 17.4% of unit shipments in the quarter,
according to Gartner. However, HP’s share of
unit shipments slipped from 18.8% in Q2-
2009, which may reflect a strong period for
netbook sales by Acer, ASUStek Computer
Inc., and others. Netbooks sell at a lower
price than traditional PCs, and can help
create a strong showing in unit shipment
counts for vendors that specialize in
netbooks. In a dogfight for second place, Acer
had 13.0% unit share in Q2-2010, up from
12.0% in Q2-2009, compared with Dell’s
12.4% (down from 12.6% a year earlier),
according to Gartner. [We note that by IDC’s
tally, Dell had 13.0% share in Q2-2010 compared to 12.6% for Acer, so maybe we should call it a tie.]
Lenovo was No. 4 with a 10.0% share of unit shipments, up from 8.2% a year earlier. ASUStek ranked
fifth, with 5.2% share, up from 3.5%. Toshiba Corp. was No. 6, with 5.1% share, up from 4.8%,
according to Gartner. The next four PC makers in order, as ranked by IDC, were Apple Inc., Samsung, Sony
Corp., and Fujitsu Ltd.
Looking at the market share pies for the second quarter of 2010, in a comparison of worldwide and US
markets, we see Hewlett-Packard as the market leader in both market segments, although its lead over its
closest rival is less in the US market. HP had a 17.4% share of worldwide PC unit shipments in Q2-2010, and
a 25.7% share of the US market. Dell is decisively the No. 2 vendor in the US market, with about 23.7%
share, compared with 11.3% for No. 3 Acer. Dell and Acer are much closer in worldwide unit count (where
Chart H08:
VENDOR PC
SHIPMENTS
0
5
10
15
20
25
30
35
HP Acer
Group
Dell Lenovo ASUS Toshiba Others
Q22009 Q22010
VENDOR PC SHIPMENTS—SECOND QUARTER
(In millions of units)
Source: Gartner.
H02: US AND WORLDWIDE PC
SHIPMENTS MARKET SHARES
Others
20.8% Hewlett-Packard
25.7%
Toshiba
8.7%
Acer
11.3%
Dell
23.7%
Apple
9.8%
US AND WORLDWIDE PC SHIPMENTS MARKET SHARES—SECOND QUARTER 2010
(Based on units shipped)
US
Totals may not add due to rounding.
Source: Gartner.
Total units: 17.9 million
Others
36.8%
Hewlett-
Packard
17.4%
Toshiba
5.1%
Acer
13.0%
Dell
12.4%
ASUS
5.2%
Lenovo
10.0%
Total units: 82.9 million
WORLD
6 COMPUTERS: HARDWARE / OCTOBER 28, 2010 INDUSTRY SURVEYS
Acer is No. 2). Apple appears as No. 4 in the US market, with about 9.8% share by Gartner’s count, whereas
it misses the top-six list for the world. By IDC figures, Apple is seventh in global PC market share by unit
shipments, with about a 4.3% share. In the No. 5 spot in the world according to Gartner is ASUStek, with a
5.2% share; however, ASUStek is not among the top-six US vendors. Toshiba has a 5.1% share of the
worldwide market and an 8.7% share of the US market.
Looking ahead, a key question for the PC industry is whether HP and Dell can maintain market leadership in
the face of lively competition from Asia-based rivals at the low end of the market. They are also in competition
with Apple, with its Mac PCs at the high end of the market and its innovative iPad line of tablets at the low
end. Interestingly, Gartner’s Q2-2010 research found that iPads did tend to take potential sales away from the
netbook category, but did not seem to cannibalize Mac sales. Overall, we see a very competitive marketplace
for PCs and believe market share positions could shift around in surprising ways over the next few years.
Together, the top five vendors of PCs in the US (Hewlett-Packard Co., Dell Inc., Acer Inc., Apple, and
Toshiba Corp. (the same names in the same order as a year ago) held US PC unit market share of 79.2% for
Q2-2010. This is lower than the 80.4% top-five concentration a year earlier, suggesting that some smaller
players—perhaps netbook-focused sellers that saw unit shipments accelerate in the early-adoption era for
netbooks—are making some headway in the US market, in contrast to the general long-term trend toward
an industry where the big players are getting bigger.
Looking ahead, we think the top-tier PC makers continue to have an opportunity to outpace the industry as
a whole, at the expense of white box vendors. We believe this is due mainly to the advantages of economies
of scale: more bargaining power with component suppliers, better global marketing and distribution networks,
bigger research and development budgets, a greater ability to shift production costs and tax liabilities to the
most advantageous countries, and more consistency in attracting top managerial talent, among others.
Following are some comments on the performance of top PC vendors so far in 2010.
 Hewlett-Packard. HP remains clearly in the lead in terms of global PC unit volume, with 17.4%
worldwide market share in PC unit shipments as of the second quarter of 2010, according to Gartner data.
We think that HP has done fairly well defending its top position in the face of an onslaught of competition
in the netbook or mini-notebook area over the past year. New netbook products, combined with competitive
pricing and marketing, helped HP to parry the threat posed by Asia-based netbook-focused challengers such
as Acer and ASUStek.
Looking at the challenge from US-based rival Dell, HP has some advantage due to its regional focus. HP
typically sells about two-thirds of its PCs outside the US, so if overseas PC market growth is stronger for the
next few years, as we expect, HP should have an edge over Dell’s more US-centric sales pattern. Of course,
Dell is shifting its distribution strategies and may gain ground in overseas markets in the future. We think
HP may need some product development to combat Apple in higher-end PCs, and it is already moving on
tablet products that may dull the threat from iPad. HP’s July 2010 acquisition of Palm Inc. added a mobile
operating system that can be used with handheld computing hardware as well as smartphones.
 Dell. In the second quarter of 2010, Dell’s global PC unit shipments grew 19.0% from the year-earlier
period, slightly underperforming the industry’s average pace of 20.7%, according to Gartner data. We think
this performance suggests that Dell needs to find a new strategy in order to catch up with HP or to keep
from being surpassed definitively by Acer. Dell has some strength in its corporate accounts that could help
boost unit sales numbers in the second half of 2010.
The company has pursued improvements in its PC distribution model in the past couple of years by creating
a network of retail partners to boost sales and thus permit greater economies of scale. We believe Dell is
succeeding in lifting its volumes, but we still observe fluctuations in various margin and expense levels from
quarter to quarter, suggesting to us that Dell has not yet fully arrived at its new operating model.
Beyond PCs, Dell is offering its first smartphone product, dubbed the “Aero,” for the US market. The phone
is based on Dell’s Mini 3 phone being sold in China and Brazil. While smartphones are an increasingly
crowded market, we think Dell’s marketing experience may give it a chance.
INDUSTRY SURVEYS COMPUTERS: HARDWARE / OCTOBER 28, 2010 7
 Acer. Taiwan-based Acer has moved up to second place on the worldwide PC market share list for Q2-
2010, by Gartner’s tally, with a unit shipment share of 13.0%, up from 12.0% a year earlier. Acer’s unit
shipment growth rate was 31.6%, topping the industry pace of 20.7%. If Acer can sustain its success in
netbooks as that product category evolves in its lifecycle and as early-adopter sales trail off, it should
continue to be an important rival in the mix. Acer is doing well enough in consumer markets, but still faces
some challenges in entering the corporate market, which requires different marketing and support strategies.
 Lenovo. Acer’s close rival Lenovo held on to fourth place in the global list in Q2-2010. Lenovo grew
sales at more than twice the pace of the market in Q2-2010 versus the year-earlier period.
 Apple. California-based Apple remains somewhat small among global PC vendors, at the No. 7 spot on
the list of vendors by worldwide PC unit sales, with a market share near 4.3% in Q2-2010 by IDC numbers,
up from about 4.0% a year earlier. The company showed growth of 31.7%, well above the 22.9% pace of
the industry, as tracked by IDC. Unit sales of the company’s Macintosh (Mac) line of computers have been
faster than the industry pace in the past several years.
We think product differentiation via innovative design and elegant styling has helped Apple, as has the
distinctive retail experience available at its Apple stores. While other PC makers rely heavily on mass-
market retailers, Apple has its own outlets. Store count grew to 293 stores as of June 2010, up from 273
stores as of its September 2009 fiscal year end, and up from 116 in 2005. Aiding Apple’s computer sales are
the popularity of its complementary iPod and iTunes music offerings, as well as the iPhone and iPad
products, which are setting new standards for rapid adoption of consumer electronic gadgets.
The tablet wave
Apple launched its iPad brand tablet computer in April 2010. With more than three million units sold just
through June, the iPad is finding success in the middle of the form-factor continuum between notebook
computers and smartphones. A main advantage that the iPad has over rival entrants is the large number of
software applications already available.
Rivals are responding with tablet computers of their own. Dell’s Streak was launched in August 2010.
Research in Motion Ltd. introduced its BlackBerry PlayBook tablet at its developers’ conference in September,
but the PlayBook won’t be available until early next year. Samsung may have an entry as soon as October
2010. Hewlett-Packard planned to launch a tablet computer platform, known as Slate, sometime in 2010.
Acer, ASUStek, Lenovo, Toshiba, and Cisco Systems Inc. are all planning their own tablet products.
Note that the competition in tablets is coming down the form-factor continuum from the PC and server
makers, as well as up from the smartphone makers, which makes for a crowded playing field. We expect
that Apple may try to rise above the fray with a second-generation iPad launch sometime in the first half of
2011, attempting to compete on even higher functionality. Stirring up consumer interest in tablets is the
notion of having personal access to the Internet in a very portable device. Touch screen features, a variety of
screen sizes, and a rising tide of video content add appeal to the tablet format.
SERVER MARKET STARTS TO RECOVER
During the second quarter of 2010, worldwide server market revenue increased 11.0% from Q2-2009 and
reached nearly $10.9 billion, compared with $9.8 billion a year earlier, according to IDC data. This was the
second quarter in a row to show year-over-year improvement in server sales, following a tough industry
downturn in 2009. Worldwide server units increased 23.8% in Q2-2010 versus Q2-2009.
In 2009, the server market shrank 19.0%, with factory revenue hitting $43.1 billion, down from $53.2
billion for 2008. We view the server market in 2010 as having entered a period of moderate growth that
should last several years, given new products, pent-up demand, and gradually improving global economic
growth. We project growth near 7% for 2010 and think it may take a couple more years to recapture the
total revenue level achieved in 2008, partly reflecting the popularization of lower-priced servers in the mix.
8 COMPUTERS: HARDWARE / OCTOBER 28, 2010 INDUSTRY SURVEYS
Of the three segments making up the server market, the volume server segment showed the sharpest recovery
in year-over-year revenue growth in Q2-2010, rising 32.0%. For the midrange server category (servers priced
in the $25,000 to $250,000 range, as tracked by IDC), the revenue pickup was smaller, at 6.9%. The high-end
server segment, which suffered the most over the course of the downturn, continues to experience slow
demand, and saw a 23.6% decrease in worldwide factory revenue in Q2-2010 versus the prior-year period.
Customers have been waiting for a round of product releases in 2010, including updates in IBM’s System z
servers and Power7 Express, which arrived in September 2010. Thus, the lower-priced servers are leading the
way to industry recovery.
Demand drivers include a need for a wide range of server systems to handle customers’ computing tasks, as
well as by customer interest in blade products from IBM, HP, and Dell. Although enterprise customers are
favoring volume servers, price competition tends to hinder revenue advances in this segment. With sales
depressed for more than a year during the downturn, the need to update an aging installed base of servers is
building; this should help to spur sales if the economy improves over the next few years, as we expect.
The need for improved system performance continues to drive demand for servers, with customers also
looking to keep complexity and cost at manageable levels. Another factor in industry growth is server
“virtualization,” in which a software application splits a server into multiple operating environments for
greater capacity and efficiency. We think that a trend toward virtualization somewhat tempers demand for
new server systems.
Blade servers continue to be a relatively strong niche segment in the server arena, as they address common
problems of energy consumption and space limitations. In the second quarter of 2010, blade servers
represented 14.0% of quarterly server revenue. The growth pace for blade servers in Q2-2010 (versus the
vear-earlier period) was 30.9% in revenue terms and 13.6% in unit shipments. Hewlett-Packard and IBM
are the largest blade server vendors, with market shares of 55.8% and 24.2%, respectively.
Before the big downturn in 2009, the server industry rose at about a 2% pace for several years. We expect a
rebound to pre-downturn levels over the next few years, before a return to a long-term trend of slow
growth. The speed of the projected rebound would vary with the global economy and amount of pent-up
demand that may exist for modern data center equipment.
Server market share at mid-2010: HP and Dell make hay
In a snapshot of the server industry as of the second quarter of 2010, Hewlett-Packard was in focus with year-
over-year revenue growth of 26.0%, versus 11.0% for all vendors, and the top market share at 32.5%, which
was an improvement from a 28.6% share in Q2-2009. IBM held the No. 2 spot in market share at 29.8%,
down from 34.2% in the prior-year period. IBM’s revenue in Q2-2010 dipped 3.2%, but we think that largely
CHART H03:
SERVER VENDOR
MARKET SHARES
Others
11.1%
Oracle
10.2%
Dell
12.4%
IBM
34.2%
Hewlett-Packard
28.6%Fujitsu
3.5%
SERVER VENDOR MARKET SHARES—SECOND QUARTER
(Based on factory revenues)
2009
Totals may not add duetorounding.
Source: IDC.
Total revenues: $9.8 million
Dell
15.6%
Oracle
8.6%
Fujitsu
3.4%
Hewlett-Packard
32.5%
Others
10.1%
IBM
29.8%
Total revenues: $10.9 million
2010
INDUSTRY SURVEYS COMPUTERS: HARDWARE / OCTOBER 28, 2010 9
reflected customers waiting for product updates coming in the third quarter. We should bear in mind that IBM
has been the server market share leader on a full-year basis for a number of years, and we would be surprised
to see that change. Dell was in third place, with 15.6% market share in Q2-2010, an improvement from
12.4% in the prior-year period. Dell experienced a server revenue spurt of 39.1%, which was the fastest
growth among the top-five vendors in Q2-2010.
Oracle, now the owner of the Sun Microsystems server products, had 8.6% market share in Q2-2010, down
from 10.2% a year earlier. The Oracle/Sun line showed a revenue drop of 5.9% in Q2-2010, which was the
weakest revenue performance among the top-five vendors. The drop might be explained by the fact that rivals
had more than a year and a half to pitch their products to Oracle/Sun customers while Sun was in transition:
first during the nine-month wait from announcement to completion of Oracle’s acquisition, and second as
Oracle initially integrated the Sun operations. In late September 2010, Oracle held its annual Open World
conference in San Francisco, which might be a starting point for Oracle’s offensive in touting its servers.
As a group, the top five server makers held about 90% of the server market in Q2-2010. They took about 1%
of market share from the ever-smaller “other” category over the previous year.
M&A WHEELS TURN AS TECH CONGLOMERATES SEEK COMPLETE DATA CENTER OFFERINGS
To date in 2010, one of the most dramatic themes in the computer hardware industry has been the larger
companies’ strategic moves to offer more comprehensive data center offerings. IBM, HP, Dell, and Oracle
have all engaged in merger and acquisition (M&A) activities aimed at filling voids and adding complementary
strengths in their data center capabilities. Simply put, a company needs to be able to offer a client a
comprehensive data center solution, consisting of hardware, software, and services.
Within hardware, the server is the central machine, but storage and networking capabilities must match up. In
the software segment, there are many categories: system software to run the machines, application software to
accomplish the tasks, security software to keep it all safe, compliance software to keep it all organized, and so
on. Within services, there are set-up and support services to keep systems running, consulting services for
getting the most benefit out of the machines and from a company’s stored data, and so forth. Finally, once a
data center has everything all ready for one technical standard, it should keep adding expertise to have it ready
for all the legacy systems and new systems or standards that are evolving.
If a computer company seeks to own most of this data center technology (rather than partner with specialists,
as has been the more common method until recently), it would have a lot to buy. Indeed, the biggest outfits
have been doing 10 or more acquisitions a year in the past five years. However, the deal action stepped up in
2010 as the comprehensive data center strategy began to play out for the top server vendors.
Among the major deals in 2010 was the January completion of Oracle’s buyout of Sun, which dramatically
threw a prominent software heavyweight into the hardware business. Another key string of deals was made by
HP, which added networking with 3COM Corp. (acquired in April), smartphones and a mobile operating
system with Palm Inc. (July), data storage with 3PAR (September), and security and compliance software with
ArcSight Inc. (acquisition expected by end of year) and Fortify Software (acquired in September). The 3PAR
acquisition turned out to be quite contentious, with Dell initiating the acquisition only to lose in an expensive
bidding war to HP. The 3PAR deal might be viewed as a sign that push finally came to shove in the race to
build out data center operations by buying the building blocks. Dell has made a few other acquisitions in 2010
to date, but is perhaps conspicuous for being less aggressive in its buildout. IBM has also made a number of
smaller deals in 2010 that appear to be extending its existing capabilities (mainly in software), rather than
adding a completely new capability.
New heavyweights in the fight
Looking at these deal patterns, we can make some tentative conclusions about server industry evolution in
2010. First, there are some fresh names among the big companies contending in the total-solution data center
business. The Oracle/Sun combination is now a prime competitor for total data center solutions. Following a
half-year period of integrating the Sun Microsystems operations, Oracle announced new server products in
September. The next move for Oracle, a long-time leader in software, might be to fill in missing building
10 COMPUTERS: HARDWARE / OCTOBER 28, 2010 INDUSTRY SURVEYS
blocks in hardware (networking and
possibly storage) and in services
(consulting with clients on business
analytics and learning how to make
the most productive use of a data
system).
Cisco Systems, the long-time leader in
networking equipment, has now been
on the scene in other data center
hardware for a year. So far, it seems
to have gone no further into the fray.
Rather, the company has focused on
video communications, such as the
Tandberg acquisition (in April 2010).
We think Cisco has the clout to be a
bigger competitor in data center
hardware, and it will be interesting to
see if it chooses that path. Perhaps the
capability in video communications
that Cisco is pursuing will evolve as
another must-have building block for
data centers.
Overseas, there seems to be little
interest in building a complete data
center operation. Fujitsu is already in
the server game, and SAP is big in
software, but neither company has
entered the race to offer total data
center product lines. It will be
interesting to see if any non-US
companies step up to the challenge or
are daunted by the sight of entrenched
incumbent competitors.
IBM: the most robust incumbent
Another pattern in the 2010 deals is
for companies established in an area
of data-center expertise to continue to
add know-how. For example, we
view IBM as already having a
presence in most of the hardware,
software, and services niches in the
data center business, yet it continues
to make small and midsize acquisitions to keep initiatives moving forward. It is on track to do more than 10
acquisitions in 2010. We would also note that the company’s capabilities also expand as a result of its hefty
R&D budget, which, at about $6 billion a year, is the largest among the server makers.
At its May investors’ day meeting, IBM came out with a five-year strategic plan, largely an extension of recent
plans, which aimed at making about $20 billion in acquisitions through 2015. Looking at the recent pace of
deals, IBM noted that it had made 33 acquisitions for a total cost of about $9 billion in the 2007–09 period,
with many of the deals in the business analytics software area. Therefore, it looks like IBM plans to increase its
pace of deals, from about $3 billion a year recently to roughly $4 billion a year going forward. We believe this
represents a tough challenge for other companies, even Oracle, to meet.
Table B07: SELECTED
ACQUISITIONS IN THE
COMPUTER HARDWARE
INDUSTRY
SELECTED ACQUISITIONS IN THE
COMPUTER HARDWARE INDUSTRY
ACQUIRER COST DATE
TARGET SPECIALTY OF TARGET ($BIL.) CLOSED
HEWLETT-PACKARD
ArcSight Security, compliance software 1.5 Pending
Stratavia Systems management software NA Pending
3PAR Storage 2.4 Sep-10
Fortify Software Security, compliance software NA Sep-10
3 Com Corp. Networking 3.3 Apr-10
Palm Inc. Smartphones and mobile
operating systems
1.8 Jul-10
Electronic Data Systems Services 13.0 Aug-08
Compaq Personal computers 24.2 May-02
IBM
BLADE Network
Technologies
Data center switches NA Pending
Netezza Corp. Business intelligence software 1.7 Pending
OpenPages Security, compliance software NA Pending
Datacap Inc. Document capture and
management software
NA Pending
Unica Corp. Business intelligence software 0.5 Pending
Sterling Commerce Customer Relationship
Management (CRM) Software
1.4 Pending
SPSS, Inc. Business intelligence software 1.2 Oct-09
Telelogic AB Software 0.9 Apr-09
Cognos Inc. Business intelligence software 5.0 Feb-08
DELL
Ocarina Networks Inc. Storage < 0.3 Jul-10
KACE Networks Inc. Systems management software < 0.3 1st half
Scalent Systems Inc. Systems management software < 0.3 1st half
Perot Systems Corp. Services 3.9 Nov-09
EqualLogic Inc. Storage 1.4 Jan-08
ORACLE
Sun Microsystems Server, storage hardware; Java
software
7.4 Jan-10
BEA Systems Software 8.5 Apr-08
Hyperion Solutions Business intelligence software 3.3 Apr-07
Siebel Systems Customer Relationship
Management (CRM) Software
5.9 Jan-06
PeopleSoft Software 11.1 Jan-05
CISCO SYSTEMS
Tandberg ASA Video communications 3.3 Apr-10
Starent Networks Corp. Mobile systems 2.6 Dec-09
Pure Digital Technologies Digital camcorders 0.5 May-09
IronPort Systems Inc. Enterprise messaging security 0.7 Jun-07
WebEx Communications On-demand collaboration 3.0 May-07
Scientific-Atlanta Cable set-top boxes 7.1 Feb-06
NA-Not available.
Source: Company reports.
INDUSTRY SURVEYS COMPUTERS: HARDWARE / OCTOBER 28, 2010 11
Competition to acquire remaining independent specialists: the scramble for 3PAR
A development from the M&A activity this year is that the squeeze is on for late movers in the process of
adding building blocks for data centers. The rapidly escalating price for storage technology provider 3PAR,
brought on by a bidding war, illustrates the problem. Can Dell, lacking the storage building block it sought,
still find a comparable independent company specializing in storage? Would it have to pay up for it? Beyond
the storage category, we speculate that there may be more bidding competitions as other areas of data center
operations become hot, perhaps networking or any of several types of software or services. Most of the
computer hardware heavyweights have plenty of cash and borrowing ability, especially at today’s low interest
rates, to finance a lot of acquisition activity.
A twist in the leadership story
On August 6, 2010, the server industry was startled by news that the HP board had ousted chairman and
CEO Mark Hurd for conduct contrary to company policy in his handling of expense accounts. This left a
major Silicon Valley company suddenly leaderless. In a subsequent twist to the story, Oracle hired Mark Hurd
as a co-president and a director, which to our mind fills a gap in leadership for hardware operations at the
software giant. We feel that, at that point, because of the switch in leadership, HP looked weaker and Oracle
stronger.
On September 30, HP’s search for a successor yielded Leo Apoteker, a long-time leader at German software
giant SAP AG, as the choice for CEO. It also came up with Ray Lane, a venture capitalist with leadership
experience at Oracle, as a board member. We think the selections indicate that HP’s next strategic offensive
will be to build out their software offerings, a segment that appears to us to have been relatively overlooked in
the recent mix of acquisitions. With software segment revenue only 3% of HP’s revenue in FY 2009, we think
there is a need for HP to rebalance its strengths by expanding in software.
In the time between Mark Hurd’s departure and the announcement of Leo Apoteker’s election as CEO (which
is effective November 1), HP made both the 3PAR and ArcSight acquisitions, authorized another $10 billion
for buybacks of HP shares, and issued three notes to raise a total of $3 billion at various interest rates (the rate
on one tranche due in 2013 was 1.25%, which looks low by historical norms). While we see these actions as
generally in line with HP’s strategic trajectory and not far out of line with industry practices, the 3PAR deal’s
high price tag and Mark Hurd’s ejection generated some criticism. In an unusually outspoken statement, IBM
CEO Sam Palmisano took HP to task for paying too much severance to Mr. Hurd and too much to acquire
3PAR, as well as for investing too little in R&D (which tends to prompt M&A to make up for innovative
deficiencies). Noting that IBM sold off its PC operations to Lenovo back in 2005 for about $1.75 billion, he
said, “I couldn’t give it away today”—a pointed comment on the strategies of PC-heavy HP and Dell. Indeed,
Mr. Palmisano’s competitive concerns seemed to focus more on Oracle, in part because “Oracle invests.”
Meanwhile, we think that Oracle, lacking PCs and printers, tends to view IBM as its most direct competitor.
What does it take to succeed?
Since 2002, IBM had been showing the way to the new IT conglomerate model: shedding low-margin
hardware, and adding higher-margin software and services to complement the remaining high-margin
hardware. Over the last few years, the other top players have started to adopt this model as well, and this
trend was as strong as ever in 2010. We expect to see more M&A, probably a few bidding wars, and a tumult
of rearranged partnerships as the big server companies begin to favor their own brands as they attempt bigger-
package sales in the data center market.
Despite all the merger activity in the computer hardware industry, we note that there is more than one way to
achieve growth. Apple has managed to attain the largest market capitalization in the industry while making
very few acquisitions. Key contributors to its growth are internal innovation, the combination of hardware
with self-owned operating systems and, where possible, control of the content that goes through the hardware.
The data center conglomerates are trying, at the least, to emulate combining hardware with self-owned
systems. 
12 COMPUTERS: HARDWARE / OCTOBER 28, 2010 INDUSTRY SURVEYS
INDUSTRY PROFILE
Volume expansion paused for recession, while pricing pressure persists
During each evolutionary phase of the computer hardware industry, the price for computing power has
decreased, usability has improved, and the market has broadened. Business spending largely drove growth
in computer hardware sales throughout the 1990s. The consumer market became increasingly important
during the latter half of that decade, as the Internet boom contributed to rising consumer demand for
personal computers (PCs), and that trend has continued. Since 2000, increasing use of computers for audio-
visual media is contributing to hardware demand.
Looking back to the 1970s, during the early stages of the industry’s evolution, businesses used computers to
automate back-office operations such as accounting. Continued advances in technology led to increased
computing power, while the size of computers decreased. By the 1980s, computers were small enough to sit
on a desktop, and the PC was introduced. Although largely a productivity tool for front-office tasks such as
word processing, the new devices also spurred consumer demand for computers.
Network computing, the most recent stage in the computer hardware industry’s evolution, has presented a
strategic inflection point in the proliferation of PCs and servers. Initially, networked computers attracted a
growing base of corporate users. The emergence of the Internet gave this market another shot in the arm
and added an unprecedented number of consumers to the mix.
Cloud computing—in which users buy processing power as a service via the Internet, rather than having to
buy and maintain hardware—is an emerging part of the business. The cloud approach to delivering
computing has the potential to offer users a lower-cost alternative and to create a breed of data centers that
would cater to cloud users.
Rapid proliferation of the Internet culminated in strong growth for the computer hardware industry in 1999
and most of 2000. However, the industry’s fortunes reversed in 2001, and demand remained soft in 2002,
reflecting the global economic downturn. From 2003 through about mid-September 2008, the market
staged an expansion. Then a global economic downturn knocked information technology (IT) spending
down about 4.5% for 2009, with hardware suffering more than software or services. From the vantage
point of early autumn 2010, we think this should prove to be a year when the computer hardware industry
rebound begins, followed by several years of relatively healthy growth. Standard & Poor’s believes this
forecast is achievable, though we expect the pace of growth to vary by segment and region, with Asia
leading the way.
The computer hardware industry can be divided into two main segments: PCs (including notebooks) and
servers (ranging up to large-scale systems such as mainframes and supercomputers), with workstations as a
minor third category. Based on estimates from IDC, the value of worldwide PC shipments in 2009 was
about $219 billion, and servers were worth about $43 billion, for a total of roughly $262 billion in
computer hardware sales in 2009. This indicates that computer hardware is a substantial portion
(approximately a fifth) of about $1.43 trillion spent worldwide on IT in 2009, which includes spending on
software and services, and some near-cousins of the traditional computing industry (data storage machines,
printers, ATMs and retail kiosks, and other increasingly sophisticated office electronics).
PC SEGMENT IS LARGEST, MOST COMPETITIVE
The highly competitive PC market is the largest sector of the computer hardware industry in terms of both
units and dollars. It represented over 80% of the total amount spent on PCs, servers, and workstations in
2009. As estimated by IDC, the number of PC units shipped worldwide in 2009 totaled about 296 million
and were worth approximately $219 billion. Unit shipments rose about 3.0%, indicating a growth year for
the PC industry despite a sharp downturn that began in late 2008 and started to turn around in the second
INDUSTRY SURVEYS COMPUTERS: HARDWARE / OCTOBER 28, 2010 13
half of 2009. Although dodging an actual loss in unit shipment terms, 2009 is apt to be remembered as a
landmark bearish year for the industry, stemming from the severe economic downturn. The year 2010
should be widely welcomed as a return to more solid growth.
The PC’s heyday was in the early 1990s. Between 1991 and 1995, growth in worldwide PC shipments
averaged more than 20% annually, driven largely by the machines’ increasing affordability and capabilities.
After a 26% surge in 1995, however, growth trended downward to about 13% by 1998, and the industry
was widely deemed to be maturing.
In 1999, when shipments surged 23% worldwide, PC makers enjoyed a flashback to the heady growth days
of the mid-1990s. However, the unit growth rate slowed to 15% in 2000. While consumers continued to
buy PCs, corporate demand started to ebb. The trends that fueled growth in 1999 were also catalysts for
much of the healthy growth seen in the first nine months of 2000. Most important were continued price and
performance improvements of PCs, which enabled a larger addressable market and sustained demand for
upgrades, Internet-driven demand, and greater PC penetration in consumer and emerging international
markets. Limiting factors included a weaker European market and a slowing US economy, which depressed
growth considerably toward the end of 2000. In 2001, PC unit sales fell on an annual basis for the first time
since 1985, declining 4.1%, according to IDC.
After a year of modest 1.5% unit growth in 2002, the market gained momentum in 2003 and rose 12%, led
by strength in consumer demand and the replacement of desktop computers with notebooks. These factors
remained key drivers in PC unit growth in subsequent years—near 15% in 2004, 17% in 2005, 11% in
2006, 15% in 2007, 10% in 2008—though growth slowed to just 3% in 2009.
As of October 2010, Standard & Poor’s was projecting PC unit shipments to increase about 18% for the
year, in light of continued user demand for laptops and mobile Internet access, and interest in new operating
systems from Microsoft Corp. (Windows 7) and Apple (Snow Leopard). For 2011, we project an increase of
15%, reflecting further economic recovery.
PC prices in long-term downtrend
Cheaper PC prices have been a key contributor to expanding the addressable market for the devices.
According to estimates from IDC, the average system price (ASP) for PCs fell 9.5% to $1,699 in 1999, and
another 6.1% in 2000 to $1,596. The average system price declined 11.0% in both 2001 and 2002, and
another 9.0% to $1,165 in 2003. Price declines were less pronounced in 2004, with the ASP down 4.2%.
In 2005, however, price declines accelerated again to 5.9%, and continued at a 5.4% pace in 2006, before
easing somewhat to a 1.3% decline for 2007, when the average system price for PCs was $887, according to
IDC estimates. Estimates for 2008 showed an ASP decline of 4.3% to $849. In this context, the downshift
in 2009 was notable. Driven by the competitive dynamics in the marketplace, the greater presence of
netbooks, and the lackluster global economy, the average system price declined almost 14% to $731.
Standard & Poor’s expects the pace of ASP drops to return to a more typical pace near 6% for 2010, as the
economy picks up and slowing growth in netbook sales curtails the unusual ASP pressure seen in 2009.
To some extent, price declines may reflect the pass-through of savings from cost-cutting efforts. Given the
long-term downtrend in PC pricing, major players likely will remain under pressure to squeeze costs out of
their businesses, in our opinion.
PC market share trends
With consistent pricing pressure in the industry, the PC market has witnessed rising market share
concentration among the top vendors. Only the fittest PC producers have survived. In 1992, the top 10
worldwide vendors accounted for roughly half of the market. From 1999 through 2002, however, just the
top five vendors commanded nearly half (45%) of the market. That level climbed further in 2006, 2007,
2008, and 2009, when the top five held 50%, 53%, 57%, and 60%, respectively, based on IDC data.
Many industry forecasters have long predicted that the top five vendors may hold 70% of the global PC
market in the future. This theory got a boost in September 2001, when HP announced plans to acquire
14 COMPUTERS: HARDWARE / OCTOBER 28, 2010 INDUSTRY SURVEYS
Compaq. The deal closed in May 2002, marrying the No. 2 (Compaq) and No. 3 (HP) PC vendors. This
combination enabled the two companies to leverage the scale of the merged entity, in an effort to create an
improved cost structure and greater distribution opportunities.
In terms of unit volume, Compaq was the leading worldwide PC vendor from 1994 through 2000. Dell Inc.
claimed the top spot in 2001, according to IDC. In the fourth quarter of 2002, the combined HP and
Compaq just barely edged out Dell, and temporarily held the No. 1 position again.
In 2003, Dell emerged as the market leader again with a 16.7% share of the market, versus 16.2% for HP.
This gap widened further in 2004. Dell’s market share grew to 17.9%, while HP’s share slipped to 15.8%.
Driving this trend, in our view, were HP’s publicly stated intentions to focus on profits over PC market share.
In 2005, HP’s share position seemed to have stabilized at 15.7%, but the gap between it and Dell widened
again, by a further 50 basis points. (Dell’s global PC share for the year was 18.2%, according to IDC.)
However, this trend reversed in 2006, reflecting what we believe to be continued momentum at HP and
missteps at Dell. As a result, the companies ended 2006 in a virtual tie, with each possessing about 16.5%
of the market. In 2007, HP’s share rose sharply to 18.8%, while Dell’s share dipped to 14.9%. Thus, HP
was the clear market share leader by units for 2007, with Dell a strong second; no other vendor had more
than a 10% share. In 2008, HP remained the clear leader, with a 19.2% market share of the global PC
market by units, with Dell a strong second at 15.0%, and Acer closer in third place at 11.0%.
In 2009, HP widened its PC market share lead to 20.3% of worldwide unit shipments, versus Dell’s 13.1%.
Acer was close on Dell’s heels, with a 13.0% share, and actually surpassed Dell in Q4-2009 unit sales.
Lenovo Group Ltd. of China was No. 4 in 2009 with a 9.2% share, followed by Toshiba at 5.6%. (IBM
sold its PC unit to Lenovo in May 2005.)
Apple Inc. (formerly Apple Computer Inc.) was absent from the list of top five global PC vendors from 1999
through 2009. This fact stands in sharp contrast with Apple’s position as of mid-1994, when the question was
whether Apple was No. 1 or No. 2 in worldwide PC shipments. Reasons for the company’s diminishing share
in that period included its well-publicized internal problems, aggravated by a fiercely competitive market.
More recently, however, things have been looking up for Apple. Its successful digital music player, the iPod,
and the new iPhone have created what some consider a “halo” effect: this thesis suggests that iPod and
iPhone customers may also buy Mac computers. This may also hold true for the iPad tablet computer,
which was launched in April 2010. We think this has been a key factor in Apple’s improvement in US
market share from 3.3% in 2004, to 4.0% in 2005, 4.7% in 2006, 6.2% in 2007, 7.9% in 2008, and 8.0%
in 2009. Other factors include the Mac’s innovative design, reputation for being reliable and user-friendly,
and popularity with the youth market. We expect continued market share gains for Apple in 2010.
SERVER MARKET FADES WITH ECONOMY
After two years of declines, the server market had a short-lived respite in 2000, when it advanced 6.5% to
$60 billion, boosted by the Internet build-out. However, it faced a dramatically different environment in
2001, when the market slid roughly 17.0% to $50.1 billion, according to IDC. In 2002, worldwide server
factory revenues declined another 12% to $44.1 billion, reflecting a slump in IT spending amid the US
economic downturn.
From 2003 to 2005, the server market improved, led by demand for volume servers. Worldwide server
revenues grew to $46 billion in 2003 and $49 billion in 2004, as the market witnessed strong growth in
volume servers. In 2005, the server market posted an increase to approximately $51 billion in revenues,
followed by a modest rise of about 1% to $52.5 billion in 2006, according to IDC data. Figures from IDC
show worldwide server revenues increasing about 5% to $55.1 billion in 2007, but then falling by 3.3% to
$53.2 billion in 2008, and by 19.0% to $43.1 billion in 2009. Standard & Poor’s projects that server sales
will rebound with IT spending in 2010, and recover further in 2011. Nevertheless, we expect pricing
pressure to limit revenue potential in servers in the long run, and submit that this is one factor driving the
INDUSTRY SURVEYS COMPUTERS: HARDWARE / OCTOBER 28, 2010 15
server makers to try “server-plus” growth
strategies, to coin a phrase, wherein the
server is a means to sell software and
services as a total data center package with
higher growth and margin potential.
IBM maintained its leadership position in
the server market during 2009, according to
IDC, with a 32.9% share of revenues, a
market share gain of about 1.1%. HP kept
its hold on the No. 2 spot, with a 29.9%
share, a gain of 0.3% from 2008 levels. Dell
was in third place with a 12.1% share, a
gain of about 0.5%. Sun Microsystems Inc.
was fourth, with market share of 8.8%,
down 1.3% from 2008. Somewhat distant in fifth place was Fujitsu/Fujitsu Siemens with market share of
5.1%, about 0.3% higher than in 2008.
Volume servers experience slowdown
As desktop computers have become increasingly powerful, the distinctions between hardware categories
have blurred. In the mid-1990s, PC vendors began broadening their product lines with high-performance
Wintel desktop machines capable of operating as servers. This caused explosive growth for the so-called
volume server segment (the low end of the server market), with double-digit revenue gains in 1996 and
1997. In 1998, revenue gains subsided as the overall sales mix reflected the increased proportion of these
servers based on processors from Intel Corp., among other factors.
In 1999, however, sales of volume servers rose 10% to more than $29 billion. Because these servers can be
used as front-end servers supporting both online offerings and commerce (or e-commerce), demand was
buoyed by the build-out of the Internet. Computer
hardware additions were required to support the
growing number of users accessing the Internet.
Following a slump during the economic recession,
the market began to recover in 2002. Revenues
advanced 4.9% in 2002, according to IDC, and
gained further momentum in 2003 to rise 9.7%. In
2004, the market accelerated and volume server
revenues rose 17.6% to $23 billion. In 2005, strong
unit growth pushed the volume server category to
represent 90% of all server units, and over half of
total server revenues, according to IDC. In 2009,
the volume server segment represented 98% of
total server unit shipments and more than half
(56.1%) of total server revenues.
Still, the revenue growth rate for volume servers
ebbed from the strong levels of 2004: 12.1% in
2005, a modest rise of 4.4% in 2006, an increase of
8.5% in 2007, and a decline of 5.4% for 2008.
Revenues totaled about $30.5 billion in 2007, then
fell to $29.1 billion in 2008 and $24.2 billion in
2009, according to IDC data.
For 2009, the leading market share winner in the volume server category by revenue was HP, which
experienced market share expansion to 38.2% (from 36.5% in 2008), as its revenue decreased about
13.0%, which was less than the pace of decline for the volume server industry (17.0%). Dell continued in
TABLE B10: WORLDWIDE
LEADING SERVER FACTORY
REVENUE, BY VENDOR
WORLDWIDE LEADING SERVER FACTORY REVENUE, BY VENDOR
(Ranked by 2009 factory revenues)
REVENUES MARKET
------------- (MIL. $) ------------- SHARE (%)
R2008 R2009 % CHG. R2008 R2009
IBM 16,911 14,161 (16.3) 31.8 32.9
Hewlett-Packard 15,759 12,887 (18.2) 29.6 29.9
Dell 6,196 5,226 (15.7) 11.6 12.1
Sun Microsystems 5,362 3,810 (28.9) 10.1 8.8
Fujitsu/Fujitsu Siemens 2,531 2,194 (13.3) 4.8 5.1
Others 6,447 4,818 (25.3) 12.1 11.2
Total 53,206 43,096 (19.0) 100.0 100.0
R-Revised.
Source: IDC.
Table B02:
WORLDWIDE
VOLUME SERVER
REVENUES
WORLDWIDE VOLUME SERVER REVENUES
(Ranked by 2009 factory revenues)
REVENUES MARKET
------------- (MIL. $) ------------- SHARE (%)
2008 2009 % CHG. 2008 2009
Hewlett-Packard 10,608 9,232 (13.0) 36.5 38.2
Dell 6,195 5,226 (15.6) 21.3 21.6
IBM 4,605 4,233 (8.1) 15.8 17.5
Sun Microsystems 2,253 1,570 (30.3) 7.7 6.5
Fujitsu 1,150 978 (15.0) 4.0 4.0
NEC 722 642 (11.1) 2.5 2.7
Hitachi Ltd. 184 147 (20.2) 0.6 0.6
Lenovo 107 122 14.0 0.4 0.5
Langchao 109 98 (10.7) 0.4 0.4
Apple 102 79 (23.0) 0.4 0.3
Rackable Systems 199 48 (75.7) 0.7 0.2
Powerleader 65 45 (30.0) 0.2 0.2
Founder 12 13 11.6 0.0 0.1
Maxdata 37 11 (70.4) 0.1 0.0
Other 2,745 1,715 (37.5) 9.4 7.1
Total 29,092 24,160 (17.0) 100.0 100.0
Totals may not add due to rounding. Percentages are based on
unrounded data.
Source: IDC.
16 COMPUTERS: HARDWARE / OCTOBER 28, 2010 INDUSTRY SURVEYS
the No. 2 spot, with 21.6% share in 2009, a minor improvement from its 21.3% share in 2008, and its
revenue decline in the segment was 15.6%, which was slightly better than the pace for the industry. IBM
stood in third place with 17.5% share in 2009 (up from 15.8%), and its revenue fell only 8.1%. Sun was
fourth with a 6.5% share in 2009 (down from 7.7% share in 2008), on a revenue decline of 30.3%. Of the
five largest competitors, HP and IBM seemed to make the most progress in terms of market share in the
volume server segment in 2009, while Sun lost the most. In our view, this partly reflects Sun’s marketplace
vulnerability as a lame duck during the lengthy nine-
month period before Oracle finally acquired Sun in
January 2010.
Midrange servers: battle among the top three
The midrange server market (enterprise servers with
average selling prices range of $25,000 to $249,999
per unit) suffered a hard blow from the IT slowdown
in 2001, and worldwide revenues remained under
pressure through much of the decade, as the
performance capabilities of volume servers kept
improving. Revenues for midrange servers were $8.2
billion in 2008, but fell 22.6% to $6.3 billion in
2009.
IBM, Sun, and HP continue to dominate this market,
according to IDC. In 2009, these three vendors
accounted for over 89% of revenues in the midrange
server market. IBM reported a revenue decrease of
13.8% in 2009, to about $2.7 billion, while its share
rose to 42.5% from 38.2% a year earlier, based on
IDC data. Sun’s revenues declined 21.9% in 2009,
near the pace of the midrange server industry’s
decline of 22.6%, and Sun’s share of this segment
grew fractionally to 25.4% from 25.2%. HP’s
revenues decreased more sharply, about 36.1%, and
its share of this market dipped to 21.6%, from
26.1%. The No. 4 player, Fujitsu/Fujitsu Siemens
saw its market share improve fractionally to 4.4%
from 4.2%, as its revenue decreased 19.5%.
High-end servers: IBM leads segment
The high-end server category includes a variety of
platforms—supercomputers, mainframes, and
minicomputers—in varying stages of maturity. While
total server market sales increased sharply in the late
1990s, the high end suffered as customers increasingly
off-loaded applications that were traditionally found
on mainframes and minicomputers to midrange
servers and even high-powered PC servers. Weak US
corporate profits in late 2000 through 2001 further
hurt demand, and the global economic downturn
muted results in 2002. IT budgets remained under
pressure in 2003. The market staged a modest
recovery in 2004, aided by strength in IBM’s
mainframe sales as the company transitioned its
mainframe line. The segment’s downward trend
resumed in the 2005–07 period. High-end server revenue reached $15.9 billion in 2008, but fell to $12.6
billion in 2009, for a drop of 20.9%.
Table B05: WORLDWIDE
MIDRANGE SERVER
REVENUES
WORLDWIDE MIDRANGE SERVER REVENUES
(Ranked by 2009 factory revenues)
REVENUES MARKET
------------- (MIL. $) ------------- SHARE (%)
2008 2009 % CHG. 2008 2009
IBM 3,128 2,696 (13.8) 38.2 42.5
Sun Microsystems 2,064 1,612 (21.9) 25.2 25.4
Hewlett-Packard 2,139 1,366 (36.1) 26.1 21.6
Fujitsu 347 279 (19.5) 4.2 4.4
NEC 142 114 (19.3) 1.7 1.8
Hitachi Ltd. 40 54 34.6 0.5 0.8
Unisys 69 45 (35.1) 0.8 0.7
Groupe Bull 70 34 (52.0) 0.9 0.5
Teradata 64 28 (55.4) 0.8 0.4
Mitsubishi 19 27 42.5 0.2 0.4
Stratus Computer 40 27 (32.7) 0.5 0.4
SGI 59 24 (59.0) 0.7 0.4
Toshiba 6 5 (23.1) 0.1 0.1
Cray … 3 … … 0.0
Other 6 24 277.9 0.1 0.4
Total 8,192 6,338 (22.6) 100.0 100.0
Totals may not add due to rounding. Percentages are based on
unrounded data.
Source: IDC.
Table B09:
HIGH-END
SERVER
REVENUES
HIGH-END SERVER REVENUES
(Ranked by 2009 factory revenues)
REVENUES MARKET
------------- (MIL. $) ------------- SHARE (%)
2008 2009 % CHG. 2008 2009
IBM 9,178 7,232 (21.2) 57.6 57.4
Hewlett-Packard 3,013 2,289 (24.0) 18.9 18.2
Fujitsu 1,034 937 (9.4) 6.5 7.4
Sun Microsystems 1,045 628 (39.9) 6.6 5.0
NEC 422 393 (6.8) 2.7 3.1
Hitachi Ltd. 287 362 26.0 1.8 2.9
Unisys 290 271 (6.5) 1.8 2.2
Cray Inc. 219 199 (9.1) 1.4 1.6
Groupe Bull 196 186 (5.0) 1.2 1.5
Teradata 129 53 (59.0) 0.8 0.4
SGI 84 26 (68.7) 0.5 0.2
Stratus Computer 9 10 9.9 0.1 0.1
Mitsubishi 14 2 (87) 0.1 0.0
Others … 10 … … 0.1
Total 15,921 12,599 (20.9) 100.0 100.0
Totals may not add due to rounding. Percentages are based on
unrounded data.
Source: IDC.
INDUSTRY SURVEYS COMPUTERS: HARDWARE / OCTOBER 28, 2010 17
For high-end servers, IBM remained the clear leader in 2009. Its market share dipped fractionally to 57.4% in
2009 from 57.6% in 2008, as revenues decreased 21.2%. HP followed with 18.2% of the market, down from
18.9% in 2008, as its revenues fell 24.0%. Fujitsu/Fujitsu Siemens was in the third spot, with a market share
of 7.4%, compared with 6.5% in 2008, as its revenue fell just 9.4%, compared to a 20.9% drop for the
overall high-end server category. Sun Microsystems saw its revenue drop 39.9%, contributing to a narrowing
of market share to 5.0% from 6.6%. Together, these top four vendors controlled 88% of the high-end server
market segment.
WORKSTATION MARKET SHIFTS TO LOWER-END PRODUCTS
In 2009, worldwide workstation shipments plummeted 23.7% to about 2.3 million units, according to IDC
figures. Revenues for the workstation market fell about 28.5% to $4.4 billion, as average selling prices
declined. Workstations should see unit growth of about 13% in the rebound year of 2010, and grow over
10% each year through 2013, reaching a value of near $6.5 billion, despite steady to slightly lower ASPs.
Workstations, the industry’s fastest-growing sector in the late 1980s, were unique in that they combined
powerful processors, networking, and graphical user interfaces in a single compelling package for the first
time. They were aimed at engineering, three-dimensional animation, and scientific applications; production
of 3D movies is a present-day task where workstations have some advantages. In the past, Unix vendors
dominated this area, accounting for 85%–90% of the market. However, as the segment has shifted to
lower-end personal workstations from higher-priced Unix workstations, Windows-based workstations came
to hold about 93% of the market in 2009, according to IDC data. Market leaders in workstation lines are
Dell and HP, with Lenovo and Sun also in the mix.
INDUSTRY TRENDS
Spending on computer hardware, defined as server and client (PCs and workstations) systems, represents
about a fifth of the worldwide spending on information technology (IT). More broadly defined to include
storage disk systems and tape, peripheral equipment such as printers, and networking equipment, as well as
the server and client computer systems, computer hardware is about 40% of total IT spending. According to
market researcher IDC, IT spending reached roughly $1.5 trillion in 2008, and then fell about 4.5% (in
constant currency terms) to about $1.43 trillion in 2009. In 2010, IDC projects that such spending might
rise about 3% to $1.48 trillion, thus not quite regaining the 2008 level. To put this current level of nearly
$1.5 trillion in perspective, the worldwide IT market was valued at nearly $1.0 trillion in 2001 and just
$360 billion in 1993.
What propelled this stellar growth? The Internet. Widespread use of the Internet stimulated demand for a
host of IT-related products and services. In 1998, an estimated $211 billion could be linked to technology
investments related to the build-out of the Internet, according to IDC. Spending for online infrastructure
was estimated at $600 billion in 2003.
While the investment boom may take a pause during years of slow economic growth, as occurred in 2001 and
2002 (with declines of 0.5% and 4.1%, respectively, according to IDC), and in 2009, we think the longer-term
outlook remains positive. We believe IT spending increased at a 6%–7% annual pace in 2005, 2006, and
2007, but dipped to a slower growth level near 3.6% in 2008, and decreased about 4.5% in 2009, as a result
of the global economic slowdown. Because infrastructure development is needed to meet growing demand
from new users and for new applications, Internet-related spending should continue to rise.
US PC MARKET GROWS IN SPURTS
Just when the computer hardware industry was considered mature in the latter half of the 1990s, the
industry witnessed a resurgence ushered in by the Internet age. Demand to get online—coupled with the
proliferation of low-priced (in some cases, even free) PCs—bolstered demand in the US through 1999.
According to IDC, US PC unit shipments increased by 27% and 24% in 1994 and 1995, respectively. When
18 COMPUTERS: HARDWARE / OCTOBER 28, 2010 INDUSTRY SURVEYS
annual growth slipped to 15% in 1998, many observers concluded that growth in the US was decelerating
because of a saturated market. Then, in 1999, US PC shipments surged 25%.
From 2000 through 2002, however, PC sales growth slumped in the US. According to Gartner Inc., an IT
market research firm, US PC shipments rose less than 8.0% in 2000, declined approximately 11.0% in
2001, and grew by 4.4% in 2002. Picking up the trail from there, figures from IDC show that US PC
shipments grew about 10.8% in 2003, 10.5% in 2004, and 8.5% in 2005. Growth decelerated in 2006,
with US unit shipments up only 3.6%. Growth improved in 2007, but only to about 7.6%. Results for 2008
were an increase of only 2.1%, followed by a similar lackluster increase near 3.0% in 2009. We expect a
substantially higher increase for 2010, perhaps as high as 18%.
Market concentration became noticeable by the late 1990s. It then became pronounced with the
combination of Hewlett-Packard Co. (HP) and Compaq Computer Corp. in 2002, Gateway Inc.’s
acquisition of eMachines Inc. in 2004, and International Business Machines Corp.’s (IBM’s) sale of its PC
unit to China-based Lenovo Group Ltd. in May 2005. The consolidation trend continued when Taiwan-
based Acer Inc. acquired Gateway Inc. in October 2007. In addition, computer hardware vendors have
broadened their product offerings to offset declining margins. These companies are now becoming more
focused on cash management and on higher inventory turns and returns on assets.
While the PC industry is certainly maturing, in Standard & Poor’s opinion, there are still geographic areas
where PC penetration is well below saturation levels. In addition, the introduction of higher performance
products and Internet services (including broadband access) will likely continue to boost demand over the
next several years, sustaining unit growth in the high single-digit range over that period.
CONSOLIDATION EXTENDS TO SERVICES
The computer industry has long experienced consolidation in hardware operations, and Standard & Poor’s
expects the consolidation trend to expand to emphasize software and services, as companies strive to produce
one-stop shopping convenience for information technology customers, add recurring revenue streams to aid
earnings stability, and increase economies of scale to help profitability.
The largest merger in the industry to date was the May 2002 acquisition of Compaq by HP, valued at some
$19 billion. Before that, the largest merger was Compaq’s June 1998 acquisition of Digital Equipment Corp.
(DEC), valued at $8.4 billion. Among other mergers, Packard Bell and NEC Corp. combined forces in 1997.
(After a series of investments of more than $1.3 billion, NEC shuttered the Packard Bell brand in the US in
1999.) Gateway acquired eMachines in March 2004 for an estimated $250 million, and China-based Lenovo
Group acquired IBM’s PC division in May 2005 for about $1.75 billion. Acer purchased Gateway in October
2007 for about $710 million.
Acquisition strategies have let companies broaden their customer base and offer a wider array of computing
products and services. Over the past several years, Sun added personnel to beef up its services offerings and
has forged alliances with computer services companies. Compaq’s acquisition of DEC provided it with high-
end Unix systems and a worldwide service organization. HP now holds not only the former Compaq service
assets, but also the large technology services capacity of Electronic Data Systems Corp., which HP acquired
in August 2008 for about $13.9 billion. This allows HP to present customers with broad offerings in
hardware, software, and services, along the lines of a model pursued by rival IBM.
IBM, the global leader in services, acquired the consulting unit of PricewaterhouseCoopers International
Ltd. in July 2002. (Some two years earlier, HP had been in discussions to acquire the unit.) Since then, IBM
has engaged in a string of software and service acquisitions. The company made 12 acquisitions in 2007 for
a total cost of $1.1 billion, of which six were in software and five were in services. A headline deal for IBM
was the February 2008 purchase of Ottawa-based Cognos for approximately $5 billion, which added
expertise in business intelligence software and services to help facilitate customers’ real-time decision-
making based on their data. IBM had announced at least 10 acquisitions in 2010 through September,
including two with price tags of over $1 billion each. IBM’s revenue in 2009 came 58% from services, 23%
from software, 17% from hardware, and 2% from financing, illustrating a diversification among segments,
INDUSTRY SURVEYS COMPUTERS: HARDWARE / OCTOBER 28, 2010 19
albeit with a tilt favoring services and software lately. Hardware appears to be something of a loss leader by
which IBM attracts business for its other segments.
As networks of computers have become larger and more complex, customers increasingly prefer to use a
single vendor for all of their computing platforms. This provides one source of accountability and enables
easier technology upgrades. Standard & Poor’s believes this trend will promote further consolidation ahead.
COMPETITIVE PRICING EVERYWHERE
Several factors have affected computer hardware pricing and sales trends. While chip prices continue to fall
and component prices decline steadily, the industry’s consolidation has also enabled computer companies to
trim operating expenses. Consolidation, however, has also contributed to a more intensely competitive
pricing environment that continues to weigh on all computer hardware categories. Vendors try to offset
price declines by achieving better volumes via market share gains, and the competitive cycle continues. In
the following discussion, we present some context for the pricing pressures at work in the various segments
of the computer hardware industry.
 PCs. Price competition has been the hallmark of the PC market. One reason is that PCs have become
more commodity-like with the standardization of their primary components. Microsoft Corp.’s Windows
operating system software is used in an estimated 85%–90% of PCs worldwide, and Intel Corp.’s
processors are used in approximately 80%.
Price competition in the PC market became fierce in 1992, when Compaq’s price actions precipitated a
shakeout among second- and third-tier suppliers. Compaq led the charge again in 1997, dominating the
sub-$1,000 PC market at the low end of the market and challenging the price points of direct sellers such as
Dell at the high end. Over the past few years, prices have continued to erode, particularly in the desktop
market, as demand for notebooks has accelerated.
Traditionally, direct sellers have been able to underprice indirect sellers like Compaq and HP, which sell
through retail channels. This is because direct sellers yield savings by maintaining low inventory levels. In
addition, they do not have to pay the incentives or price guarantees that indirect sellers typically pay
resellers. However, many PC makers who sell indirectly are now also using the direct sellers’ techniques—
such as online order capabilities and build-to-order strategies—to gain efficiencies and narrow price gaps, as
well as reduce their cost structures to compete better on price.
 Servers. In contrast to the PC market, the explosive growth in servers in the late 1990s attracted new
entrants. PC server participants, lured by growth rates of 25%+ projected for this segment, further
stimulated the market with dramatic price cuts. Demand also benefited from a technology migration to
systems with Intel’s server-based chips (originally Pentium Pro, followed by Pentium II/III processors and
the newer Pentium IV, launched in 2000, and Itanium in 2001) and Microsoft’s Windows NT Server and
Windows Server 2000 operating systems. Windows Server 2003, released in April 2003, witnessed traction
with users in 2004, as shipments of paid new licenses for this operating system more than doubled.
Additional gains of 23.7% and 13.8% were attained in 2005 and 2006, respectively.
 Workstations. Growth in this area has been challenged as manufacturers have faced PC-like pricing
pressures given the influx of PC-based units. Revenues have also been under pressure as the lower-priced
Windows NT workstations have grown at a faster pace than traditional workstations. [Traditional
workstations use the Unix operating system and reduced instruction set computer (RISC) microprocessors.]
 Large-scale systems. Pricing pressures on large-scale systems like mainframes have been well documented.
US businesses are actively moving mainframe applications to other computer platforms, mostly to
client/server systems and local area networks (LANs). The competition from the popular client/server and
LAN environments has forced mainframe vendors to become more price-competitive. In recent years,
however, mainframe makers, led by IBM, have introduced easier, cheaper systems that use complementary
metal oxide semiconductors (CMOS). Migration to these new machines should sustain unit growth, partly
offsetting the pressure on revenue growth.
20 COMPUTERS: HARDWARE / OCTOBER 28, 2010 INDUSTRY SURVEYS
PCs keep getting cheaper...
As the PC market matures, manufacturers have addressed affordability and innovated to expand market
opportunity. In the consumer market, industry studies through early 1997 showed that the majority of US
households with incomes higher than $50,000 had already purchased a PC. The typical price point for a PC
at that time—$2,000—was out of reach for many less affluent consumers, so analysts argued that the home
PC market was saturated.
Since then, however, PC vendors have responded with lower prices, and sales have proliferated. By the late
1990s, all major vendors offered a PC priced at less than $1,000. By 2006, desktop models could be bought
for less than $500, and laptops for less than $700. The sub-$1,000 PC has succeeded in raising the penetration
of PCs in the home market. According to technology market researcher Forrester Research, US household PC
penetration was more than 80% in 2010, and almost half of US households had more than one PC.
With the popularity of sub-$1,000 PCs, the outlook for PC vendors’ profitability became a critical issue in
1999. All major PC vendors have had to adjust their cost structures. The major indirect PC vendors have
enacted some form of build-to-order manufacturing strategy (as opposed to the prior build-to-forecast
method), in order to achieve savings by maintaining lower inventory levels. The drive to lower costs was
among the forces behind the 2002 merger of HP and Compaq. Indeed, in recent years, all the major PC
vendors have struggled to try to emulate some aspect of the low-cost business model perfected by Dell.
In addition, while lowering their base prices, PC vendors have tried to augment the potential add-ons for
each PC sold by increasingly offering system upgrades, software, peripherals, financing, warranties, and
other services to customers. Particularly in the business market, where PCs often are tied into network
systems, studies have revealed that the total cost of a PC is reflected less in the up-front price paid for the
device and more in the maintenance and support of the computer following the purchase.
...as do Intel processors
As Intel introduces each new processor, it aggressively drives down prices of older processors. This makes
PCs based on older chips more affordable to a broader market. For example, when the 233 megahertz
(MHz) version of Intel’s Pentium II was introduced in mid-1997, chips were priced at $636 each; by
January 1998, they were $268—a 58% drop in about six months. Similarly, the list price of a 600 MHz
Pentium III desktop processor was $615 in September 1999, but dropped 61% to $241 by February 2000.
Price cutting accelerated with the Pentium IV. In July 2001, Intel’s 1.8-gigahertz (GHz) Pentium IV
processor carried a list price of $562 each; by the end of August, it was $256, and, in March 2002, it was
$193. By February 2003, less than a year later, you could get a 2.5 GHz Pentium IV (a 40% hike in
computing power) for the same $193. By February 2004, a 2.8 GHz Pentium IV was $178; and by January
2006, that same $178 was the price point for a 3.0 GHz Pentium IV. As of September 2010, Intel could
offer its Pentium processor line for less than $80 per unit. An Intel Core i5 3.33 GHz was offered at $170,
and a low-power version (for laptops) was available at $190. Meanwhile the Intel Atom Dual-Core 1.5 GHz
processor for netbooks, was offered in September 2010 for $86. (For further discussion of semiconductors,
see the Semiconductors Industry Survey.)
WINTEL’S ROLE IN THE UPGRADE CYCLE
Demand for new computers typically accelerates as users migrate to faster processors and/or new operating
systems. This is known as the “upgrade cycle,” a trend that has proven powerful in the PC business. The
upgrade cycle assumes that users will trade up to PCs that are more powerful when a new operating system
is released, thus stimulating hardware sales. This happened in 1995, when the introduction of Microsoft’s
Windows 95 caused a surge in PC shipments: in order to handle the new operating system, consumers
needed to upgrade to more robust PCs.
The upgrade cycle was again apparent in the first quarter of 1997, when US PC shipments grew 20%, the
highest year-to-year increase since 1995. This growth was buoyed by migration to MMX (Intel’s
multimedia software instruction set), as well as by a continuing wave of corporate upgrades to Pentium Pro
machines with Windows NT.
INDUSTRY SURVEYS COMPUTERS: HARDWARE / OCTOBER 28, 2010 21
The combination of Windows operating systems and Intel processors has been nicknamed “Wintel.” The
Wintel dynamic is permeating almost all computer platforms, because of its compelling price/performance
compared with the alternative: the reduced instruction set computer (RISC) processor/Unix operating
system combination, which had long dominated multiuser systems and workstations.
Another upgrade cycle was launched with Microsoft’s Windows 2000. However, there was a much more
gradual uptake than in prior cycles. The operating system was officially launched in early 2000, but the
momentum in user upgrades to the platform was less robust than early predictions. The industry was also
expected to witness an upgrade cycle in 2002 with the introduction of Windows XP, which was launched
on October 25, 2001. Both of these upgrade cycles—the former aimed at the business market and the latter
at consumers—were limited by the US economic downturn in 2001 and 2002.
The next major upgrade from Microsoft began with the launch of Vista. The enterprise version was released in
November 2006 and the consumer-based offering debuted in January 2007. Adoption rates have been slower
than in previous Microsoft versions; reasons include mixed reviews of the product, and what we view as a lack
of compelling new technological features, despite some product enhancements. The latest PC operating system
from Microsoft is Windows 7, available since autumn 2009. This version has been generally well received and
may release some pent-up demand from PC users who sought to skip the Vista era and thus have aging PCs.
INTERNATIONAL MARKETS OFFER LONG-TERM GROWTH
International markets present a promising opportunity for computer hardware vendors in the years ahead.
We think the growth trajectory for the Asia/Pacific region still looks positive, following the 2009 slowdown.
Indeed, over the next several years, the Asia/Pacific market should continue to expand faster than the US
market. Market research firm IDC projects that PC unit shipments to Asia/Pacific (excluding Japan) will
increase at a compound annual growth rate (CAGR) of 20% from 2010 to 2014. Meanwhile, the more
mature markets in the US and Western Europe, as well as the rest of world (ROW) category, are projected
to grow at a less lively pace in the 11%–12% range. The outlook for Japan is for a significantly slower
growth rate (near 2%) for the 2010–14 period.
The Asia/Pacific region has generally been exhibiting superior growth since 2000. In 2007, Asia/Pacific
captured the largest share of the global PC market by unit shipments, according to IDC figures. By 2012,
IDC estimates Asia/Pacific will account for one-third of PC shipments, and continue to grow share for at
least a few years after that. International markets can show favorable growth patterns because emerging
economies may have faster growth rates, and because such markets are less saturated with PCs.
HOW THE INDUSTRY OPERATES
The modern computer hardware industry began in the early 1980s with the introduction of the personal
computer (PC). Before then, computing was dominated by International Business Machines Corp.’s (IBM’s)
mainframes and confined mostly to computer professionals and scientists.
The Altair 8800—the first commercially successful PC in the early 1970s—spawned much of what is
thought of as modern computing. In a general sense, the Altair 8800 provided the seeds for the eventual
introduction in 1981 of IBM’s PC. In a more narrow sense, the Altair introduced two key concepts that
remain critical to computer hardware manufacturers to this day. First, because the Altair was mass-
produced, the manufacturer was able (eventually) to obtain Intel Corp.’s 8080 chips at an attractive price.
Second, the Altair was based on an open-systems architecture.
Furthermore, it was the Altair, gracing the cover of Popular Electronics, a magazine aimed at the electronics
hobbyist, on January 1, 1975, that inspired Bill Gates and Paul Allen to develop a version of BASIC, the
first language program for a PC. Following the Altair, there was a rash of introductions of other personal
computing devices, including the Commodore PET, RadioShack Corp.’s TRS-80, and the Apple II from
Steve Wozniak and Steve Jobs. At that time, however, these PC devices were mainly the province of
hobbyists.
22 COMPUTERS: HARDWARE / OCTOBER 28, 2010 INDUSTRY SURVEYS
In 1981, IBM introduced the IBM PC, launching the PC market and transforming the industry forever. The
PC not only brought computers to a broader customer base, it also was one of the first IBM products to
adopt an “open architecture,” in which IBM revealed the instructions and specifications. This enabled other
companies to develop their own PC “clones” that would be compatible with IBM’s machine, as well as
peripheral devices, such as external storage, printers, and video and sound devices, among others.
This open architecture quickly evolved into a de facto industry standard. It included a microprocessor from
Intel and the Windows operating system from Microsoft Corp. with its graphical user interface, which
eliminated the need for users to remember the arcane commands required by its predecessor operating
system, MS-DOS. Once computer makers were able to clone IBM’s PC based on its open-standard
architecture, PC sales took off and prices came down. This effectively began the “commoditization” of the
PC, which is still a major force in the economics of the industry.
The development of the PC coincided roughly with the birth of today’s other major computing platforms:
servers and workstations. Servers, which at their most basic function closely resemble PCs, are used in
corporations and governmental or educational enterprises to handle large computing needs. They have
become so widespread that mainframes, while technologically distinct, are now categorized as another class
of server. Together with the PC, servers created a new model of computing known as the client/server
model, in which a “client,” normally a PC, requests a file or other information from a server via a network
connecting the two. This allows the more powerful server to share its resources with many other, less
powerful client computers.
Workstations are the other major computing platform. Introduced in 1982 by Sun Microsystems Inc.
(which was acquired by Oracle in January 2010), they too are closely related to PCs. Essentially, they are
high-end PCs with advanced graphics capabilities that are designed to handle data-intensive scientific and
engineering applications. Of the three categories that now make up the computer hardware industry, PCs
represent over 80% of global revenues.
COMPUTER FORM FACTORS
Just about every kind of computer comes in a variety of “form factors”—physical designs that play a large
role in determining the computer’s potential uses and markets. The most common form factor distinction in
the PC market is that between desktop and laptop (or portable) computers. Laptops contain similar
electronics to desktops, but they must also meet a unique set of requirements, such as reduced power usage
and heat generation. Historically, a laptop or portable PC typically meant a notebook-sized computer, but
in recent years, a smaller “ultraportable” form factor—often called a mini-notebook or netbook—began to
emerge as another type of laptop that allows users to connect to the Internet while on the go. Tablet
computers are a form factor somewhere between netbooks and laptops. In 2010, Apple scored a hit in the
tablet category with the introduction of its iPad product. With many other vendors also introducing tablets,
the netbook boom of 2009 and early 2010 has cooled.
Servers and workstations also come in a variety of form factors. In recent years, “blade” or rack-optimized
servers, which are simply circuit boards designed to standard specifications, have grown popular with
corporations and other enterprises. They allow customers to create standardized, expandable computer
racks and easily add or remove individual servers.
ASSEMBLERS, MARKETERS, AND MANUFACTURERS
The companies that produce PCs, servers, and workstations are often thought of as manufacturing
companies, yet in reality, they do little more than assemble a standard set of components bought from
various third parties. Since these components are often sourced from the same manufacturers, there is little
real difference in the functional performance of most similarly equipped computers.
Computers are made from a relatively small list of components. At the heart of a computer is the
motherboard—a circuit board that holds the essential electronics of the computer. These include the
microprocessor or central processing unit (CPU), memory chips, the program needed to start the computer,
Standard & Poor's Industry Surveys: Computers, Hardware - October 28, 2010

Contenu connexe

Tendances

Icron Technologies tactical strategic report
Icron Technologies tactical strategic reportIcron Technologies tactical strategic report
Icron Technologies tactical strategic reportalicia_obbi
 
IT Barometer 2010 - Survey report
IT Barometer 2010 - Survey reportIT Barometer 2010 - Survey report
IT Barometer 2010 - Survey reportTIVIA ry
 
World Bank Report 2014- Doing business in Switzerland
World Bank Report 2014- Doing business in Switzerland World Bank Report 2014- Doing business in Switzerland
World Bank Report 2014- Doing business in Switzerland Shiv ognito
 
Software Industry Project MRP PPT
Software Industry Project MRP PPTSoftware Industry Project MRP PPT
Software Industry Project MRP PPTKAMAL PRAJAPATI
 
Doing Business in Estonia
Doing Business in EstoniaDoing Business in Estonia
Doing Business in EstoniaMartha Olsen
 

Tendances (7)

2015-05 Industry News
2015-05 Industry News2015-05 Industry News
2015-05 Industry News
 
E grc market
E grc marketE grc market
E grc market
 
Icron Technologies tactical strategic report
Icron Technologies tactical strategic reportIcron Technologies tactical strategic report
Icron Technologies tactical strategic report
 
IT Barometer 2010 - Survey report
IT Barometer 2010 - Survey reportIT Barometer 2010 - Survey report
IT Barometer 2010 - Survey report
 
World Bank Report 2014- Doing business in Switzerland
World Bank Report 2014- Doing business in Switzerland World Bank Report 2014- Doing business in Switzerland
World Bank Report 2014- Doing business in Switzerland
 
Software Industry Project MRP PPT
Software Industry Project MRP PPTSoftware Industry Project MRP PPT
Software Industry Project MRP PPT
 
Doing Business in Estonia
Doing Business in EstoniaDoing Business in Estonia
Doing Business in Estonia
 

Similaire à Standard & Poor's Industry Surveys: Computers, Hardware - October 28, 2010

The Internet of Things: The next growth engine for the semiconductor industry
The Internet of Things: The next growth engine for the semiconductor industryThe Internet of Things: The next growth engine for the semiconductor industry
The Internet of Things: The next growth engine for the semiconductor industryPwC
 
U.S. Electronic Computer Market. Analysis And Forecast to 2020
U.S. Electronic Computer Market. Analysis And Forecast to 2020U.S. Electronic Computer Market. Analysis And Forecast to 2020
U.S. Electronic Computer Market. Analysis And Forecast to 2020IndexBox Marketing
 
Sample Bridging Local IT Consulting Market Report
Sample Bridging Local IT Consulting Market ReportSample Bridging Local IT Consulting Market Report
Sample Bridging Local IT Consulting Market ReportBridging Local
 
MelihKomuscu_Intel Corporation Company Project
MelihKomuscu_Intel Corporation Company ProjectMelihKomuscu_Intel Corporation Company Project
MelihKomuscu_Intel Corporation Company ProjectMelih Komuscu
 
Week 3 in manufacturing news
Week 3 in manufacturing newsWeek 3 in manufacturing news
Week 3 in manufacturing newsMRPeasy
 
Global tech ipo review q2 2013
Global tech ipo review q2 2013Global tech ipo review q2 2013
Global tech ipo review q2 2013PwC Russia
 
WEEK 3 ASSIGNMENT RESEARCH ANALYSIS FOR BUSINESS1WEEK 3 ASSIGN.docx
WEEK 3 ASSIGNMENT RESEARCH ANALYSIS FOR BUSINESS1WEEK 3 ASSIGN.docxWEEK 3 ASSIGNMENT RESEARCH ANALYSIS FOR BUSINESS1WEEK 3 ASSIGN.docx
WEEK 3 ASSIGNMENT RESEARCH ANALYSIS FOR BUSINESS1WEEK 3 ASSIGN.docxjessiehampson
 
Eastman Kodak Case Analysis
Eastman Kodak Case AnalysisEastman Kodak Case Analysis
Eastman Kodak Case AnalysisWilliam Duncan
 
It spending set for rise after 2013 dip
It spending set for rise after 2013 dipIt spending set for rise after 2013 dip
It spending set for rise after 2013 dipJohn Davis
 
U.S. Photographic And Photocopying Equipment Market. Analysis And Forecast to...
U.S. Photographic And Photocopying Equipment Market. Analysis And Forecast to...U.S. Photographic And Photocopying Equipment Market. Analysis And Forecast to...
U.S. Photographic And Photocopying Equipment Market. Analysis And Forecast to...IndexBox Marketing
 
Big data & advanced analytics in Telecom: A multi-billion-dollar revenue oppo...
Big data & advanced analytics in Telecom: A multi-billion-dollar revenue oppo...Big data & advanced analytics in Telecom: A multi-billion-dollar revenue oppo...
Big data & advanced analytics in Telecom: A multi-billion-dollar revenue oppo...mustafa sarac
 
Printed Electronics Markets in China By Asia Market Information & Development...
Printed Electronics Markets in China By Asia Market Information & Development...Printed Electronics Markets in China By Asia Market Information & Development...
Printed Electronics Markets in China By Asia Market Information & Development...MarketResearch.com
 
What’s Chipping Away at Automotive Production
What’s Chipping Away at Automotive ProductionWhat’s Chipping Away at Automotive Production
What’s Chipping Away at Automotive ProductionBoston Consulting Group
 
China iron ore mining industry, 2013
China iron ore mining industry, 2013China iron ore mining industry, 2013
China iron ore mining industry, 2013ReportLinker.com
 
U.S. Printed Circuit Assembly (Electronic Assembly) Market. Analysis And Fore...
U.S. Printed Circuit Assembly (Electronic Assembly) Market. Analysis And Fore...U.S. Printed Circuit Assembly (Electronic Assembly) Market. Analysis And Fore...
U.S. Printed Circuit Assembly (Electronic Assembly) Market. Analysis And Fore...IndexBox Marketing
 
U.S. Semiconductor Machinery Market. Analysis And Forecast to 2020
U.S. Semiconductor Machinery Market. Analysis And Forecast to 2020U.S. Semiconductor Machinery Market. Analysis And Forecast to 2020
U.S. Semiconductor Machinery Market. Analysis And Forecast to 2020IndexBox Marketing
 

Similaire à Standard & Poor's Industry Surveys: Computers, Hardware - October 28, 2010 (20)

Laptop
LaptopLaptop
Laptop
 
The Internet of Things: The next growth engine for the semiconductor industry
The Internet of Things: The next growth engine for the semiconductor industryThe Internet of Things: The next growth engine for the semiconductor industry
The Internet of Things: The next growth engine for the semiconductor industry
 
U.S. Electronic Computer Market. Analysis And Forecast to 2020
U.S. Electronic Computer Market. Analysis And Forecast to 2020U.S. Electronic Computer Market. Analysis And Forecast to 2020
U.S. Electronic Computer Market. Analysis And Forecast to 2020
 
Sample Bridging Local IT Consulting Market Report
Sample Bridging Local IT Consulting Market ReportSample Bridging Local IT Consulting Market Report
Sample Bridging Local IT Consulting Market Report
 
MelihKomuscu_Intel Corporation Company Project
MelihKomuscu_Intel Corporation Company ProjectMelihKomuscu_Intel Corporation Company Project
MelihKomuscu_Intel Corporation Company Project
 
Week 3 in manufacturing news
Week 3 in manufacturing newsWeek 3 in manufacturing news
Week 3 in manufacturing news
 
Global tech ipo review q2 2013
Global tech ipo review q2 2013Global tech ipo review q2 2013
Global tech ipo review q2 2013
 
WEEK 3 ASSIGNMENT RESEARCH ANALYSIS FOR BUSINESS1WEEK 3 ASSIGN.docx
WEEK 3 ASSIGNMENT RESEARCH ANALYSIS FOR BUSINESS1WEEK 3 ASSIGN.docxWEEK 3 ASSIGNMENT RESEARCH ANALYSIS FOR BUSINESS1WEEK 3 ASSIGN.docx
WEEK 3 ASSIGNMENT RESEARCH ANALYSIS FOR BUSINESS1WEEK 3 ASSIGN.docx
 
Eastman Kodak Case Analysis
Eastman Kodak Case AnalysisEastman Kodak Case Analysis
Eastman Kodak Case Analysis
 
It spending set for rise after 2013 dip
It spending set for rise after 2013 dipIt spending set for rise after 2013 dip
It spending set for rise after 2013 dip
 
semiconductor_industry
semiconductor_industrysemiconductor_industry
semiconductor_industry
 
U.S. Photographic And Photocopying Equipment Market. Analysis And Forecast to...
U.S. Photographic And Photocopying Equipment Market. Analysis And Forecast to...U.S. Photographic And Photocopying Equipment Market. Analysis And Forecast to...
U.S. Photographic And Photocopying Equipment Market. Analysis And Forecast to...
 
Big data & advanced analytics in Telecom: A multi-billion-dollar revenue oppo...
Big data & advanced analytics in Telecom: A multi-billion-dollar revenue oppo...Big data & advanced analytics in Telecom: A multi-billion-dollar revenue oppo...
Big data & advanced analytics in Telecom: A multi-billion-dollar revenue oppo...
 
Printed Electronics Markets in China By Asia Market Information & Development...
Printed Electronics Markets in China By Asia Market Information & Development...Printed Electronics Markets in China By Asia Market Information & Development...
Printed Electronics Markets in China By Asia Market Information & Development...
 
What’s Chipping Away at Automotive Production
What’s Chipping Away at Automotive ProductionWhat’s Chipping Away at Automotive Production
What’s Chipping Away at Automotive Production
 
China iron ore mining industry, 2013
China iron ore mining industry, 2013China iron ore mining industry, 2013
China iron ore mining industry, 2013
 
Global Office Electronics
Global Office ElectronicsGlobal Office Electronics
Global Office Electronics
 
U.S. Printed Circuit Assembly (Electronic Assembly) Market. Analysis And Fore...
U.S. Printed Circuit Assembly (Electronic Assembly) Market. Analysis And Fore...U.S. Printed Circuit Assembly (Electronic Assembly) Market. Analysis And Fore...
U.S. Printed Circuit Assembly (Electronic Assembly) Market. Analysis And Fore...
 
HP Sales Presentation
HP Sales PresentationHP Sales Presentation
HP Sales Presentation
 
U.S. Semiconductor Machinery Market. Analysis And Forecast to 2020
U.S. Semiconductor Machinery Market. Analysis And Forecast to 2020U.S. Semiconductor Machinery Market. Analysis And Forecast to 2020
U.S. Semiconductor Machinery Market. Analysis And Forecast to 2020
 

Plus de Steven Duque

12 Recruiting & Candidate Sourcing Stats to Know in 2016 | Happie | gethappie.me
12 Recruiting & Candidate Sourcing Stats to Know in 2016 | Happie | gethappie.me12 Recruiting & Candidate Sourcing Stats to Know in 2016 | Happie | gethappie.me
12 Recruiting & Candidate Sourcing Stats to Know in 2016 | Happie | gethappie.meSteven Duque
 
2013 State Of The Vending Industry Report - VendingMarketWatch.com - Automati...
2013 State Of The Vending Industry Report - VendingMarketWatch.com - Automati...2013 State Of The Vending Industry Report - VendingMarketWatch.com - Automati...
2013 State Of The Vending Industry Report - VendingMarketWatch.com - Automati...Steven Duque
 
2013 State of Inbound Marketing Report - HubSpot
2013 State of Inbound Marketing Report - HubSpot2013 State of Inbound Marketing Report - HubSpot
2013 State of Inbound Marketing Report - HubSpotSteven Duque
 
Today’s consumer and how contact data affects relationships - An Experian QAS...
Today’s consumer and how contact data affects relationships - An Experian QAS...Today’s consumer and how contact data affects relationships - An Experian QAS...
Today’s consumer and how contact data affects relationships - An Experian QAS...Steven Duque
 
2012 State of the Vending Industry Report - Automatic Merchandiser - June / J...
2012 State of the Vending Industry Report - Automatic Merchandiser - June / J...2012 State of the Vending Industry Report - Automatic Merchandiser - June / J...
2012 State of the Vending Industry Report - Automatic Merchandiser - June / J...Steven Duque
 
From Stretched to Strengthened: Insights from the Global Chief Marketing Offi...
From Stretched to Strengthened: Insights from the Global Chief Marketing Offi...From Stretched to Strengthened: Insights from the Global Chief Marketing Offi...
From Stretched to Strengthened: Insights from the Global Chief Marketing Offi...Steven Duque
 
Amp Agency - The Psychology of Social - February 2012
Amp Agency - The Psychology of Social - February 2012Amp Agency - The Psychology of Social - February 2012
Amp Agency - The Psychology of Social - February 2012Steven Duque
 
Quantum Workplace - 2012 Employee Engagement Trends Report
Quantum Workplace - 2012 Employee Engagement Trends ReportQuantum Workplace - 2012 Employee Engagement Trends Report
Quantum Workplace - 2012 Employee Engagement Trends ReportSteven Duque
 
Bullhorn Reach: 2012 Activity Report | Social Media Recruiting
Bullhorn Reach: 2012 Activity Report | Social Media RecruitingBullhorn Reach: 2012 Activity Report | Social Media Recruiting
Bullhorn Reach: 2012 Activity Report | Social Media RecruitingSteven Duque
 
Social Recruiting for HR Execs Made Simple | by Bullhorn Reach Evangelist Ste...
Social Recruiting for HR Execs Made Simple | by Bullhorn Reach Evangelist Ste...Social Recruiting for HR Execs Made Simple | by Bullhorn Reach Evangelist Ste...
Social Recruiting for HR Execs Made Simple | by Bullhorn Reach Evangelist Ste...Steven Duque
 
Social Recruiting for IT Consulting Made Simple | by Bullhorn Reach Evangelis...
Social Recruiting for IT Consulting Made Simple | by Bullhorn Reach Evangelis...Social Recruiting for IT Consulting Made Simple | by Bullhorn Reach Evangelis...
Social Recruiting for IT Consulting Made Simple | by Bullhorn Reach Evangelis...Steven Duque
 
Social Recruiting | How to Get Started | a Free e-Book by Bullhorn Reach
Social Recruiting | How to Get Started | a Free e-Book by Bullhorn ReachSocial Recruiting | How to Get Started | a Free e-Book by Bullhorn Reach
Social Recruiting | How to Get Started | a Free e-Book by Bullhorn ReachSteven Duque
 
33 Essential Social Recruiting Stats - 2011
33 Essential Social Recruiting Stats - 201133 Essential Social Recruiting Stats - 2011
33 Essential Social Recruiting Stats - 2011Steven Duque
 
White Paper: Embracing Social Media and Being Smart about It by Laurie Reuttiman
White Paper: Embracing Social Media and Being Smart about It by Laurie ReuttimanWhite Paper: Embracing Social Media and Being Smart about It by Laurie Reuttiman
White Paper: Embracing Social Media and Being Smart about It by Laurie ReuttimanSteven Duque
 
2011 Social Recruiting Trends & Strategies
2011 Social Recruiting Trends & Strategies2011 Social Recruiting Trends & Strategies
2011 Social Recruiting Trends & StrategiesSteven Duque
 
Jobvite Social Recruiting Survey Results - 2011
Jobvite Social Recruiting Survey Results - 2011Jobvite Social Recruiting Survey Results - 2011
Jobvite Social Recruiting Survey Results - 2011Steven Duque
 
Seven Steps to Better Brainstorming - by Kevin Coyne & Shawn Coyne - McKinsey...
Seven Steps to Better Brainstorming - by Kevin Coyne & Shawn Coyne - McKinsey...Seven Steps to Better Brainstorming - by Kevin Coyne & Shawn Coyne - McKinsey...
Seven Steps to Better Brainstorming - by Kevin Coyne & Shawn Coyne - McKinsey...Steven Duque
 
Presentation Secrets of Steve Jobs - Carmine Gallo - BusinessWeek Columnist
Presentation Secrets of Steve Jobs - Carmine Gallo - BusinessWeek ColumnistPresentation Secrets of Steve Jobs - Carmine Gallo - BusinessWeek Columnist
Presentation Secrets of Steve Jobs - Carmine Gallo - BusinessWeek ColumnistSteven Duque
 
The State of Inbound Marketing - HubSpot Report - January 2009
The State of Inbound Marketing - HubSpot Report - January 2009The State of Inbound Marketing - HubSpot Report - January 2009
The State of Inbound Marketing - HubSpot Report - January 2009Steven Duque
 
Future of Consumerism - MITX FutureM Conference 2010 - AMP Agency Presentation
Future of Consumerism - MITX FutureM Conference 2010 - AMP Agency Presentation Future of Consumerism - MITX FutureM Conference 2010 - AMP Agency Presentation
Future of Consumerism - MITX FutureM Conference 2010 - AMP Agency Presentation Steven Duque
 

Plus de Steven Duque (20)

12 Recruiting & Candidate Sourcing Stats to Know in 2016 | Happie | gethappie.me
12 Recruiting & Candidate Sourcing Stats to Know in 2016 | Happie | gethappie.me12 Recruiting & Candidate Sourcing Stats to Know in 2016 | Happie | gethappie.me
12 Recruiting & Candidate Sourcing Stats to Know in 2016 | Happie | gethappie.me
 
2013 State Of The Vending Industry Report - VendingMarketWatch.com - Automati...
2013 State Of The Vending Industry Report - VendingMarketWatch.com - Automati...2013 State Of The Vending Industry Report - VendingMarketWatch.com - Automati...
2013 State Of The Vending Industry Report - VendingMarketWatch.com - Automati...
 
2013 State of Inbound Marketing Report - HubSpot
2013 State of Inbound Marketing Report - HubSpot2013 State of Inbound Marketing Report - HubSpot
2013 State of Inbound Marketing Report - HubSpot
 
Today’s consumer and how contact data affects relationships - An Experian QAS...
Today’s consumer and how contact data affects relationships - An Experian QAS...Today’s consumer and how contact data affects relationships - An Experian QAS...
Today’s consumer and how contact data affects relationships - An Experian QAS...
 
2012 State of the Vending Industry Report - Automatic Merchandiser - June / J...
2012 State of the Vending Industry Report - Automatic Merchandiser - June / J...2012 State of the Vending Industry Report - Automatic Merchandiser - June / J...
2012 State of the Vending Industry Report - Automatic Merchandiser - June / J...
 
From Stretched to Strengthened: Insights from the Global Chief Marketing Offi...
From Stretched to Strengthened: Insights from the Global Chief Marketing Offi...From Stretched to Strengthened: Insights from the Global Chief Marketing Offi...
From Stretched to Strengthened: Insights from the Global Chief Marketing Offi...
 
Amp Agency - The Psychology of Social - February 2012
Amp Agency - The Psychology of Social - February 2012Amp Agency - The Psychology of Social - February 2012
Amp Agency - The Psychology of Social - February 2012
 
Quantum Workplace - 2012 Employee Engagement Trends Report
Quantum Workplace - 2012 Employee Engagement Trends ReportQuantum Workplace - 2012 Employee Engagement Trends Report
Quantum Workplace - 2012 Employee Engagement Trends Report
 
Bullhorn Reach: 2012 Activity Report | Social Media Recruiting
Bullhorn Reach: 2012 Activity Report | Social Media RecruitingBullhorn Reach: 2012 Activity Report | Social Media Recruiting
Bullhorn Reach: 2012 Activity Report | Social Media Recruiting
 
Social Recruiting for HR Execs Made Simple | by Bullhorn Reach Evangelist Ste...
Social Recruiting for HR Execs Made Simple | by Bullhorn Reach Evangelist Ste...Social Recruiting for HR Execs Made Simple | by Bullhorn Reach Evangelist Ste...
Social Recruiting for HR Execs Made Simple | by Bullhorn Reach Evangelist Ste...
 
Social Recruiting for IT Consulting Made Simple | by Bullhorn Reach Evangelis...
Social Recruiting for IT Consulting Made Simple | by Bullhorn Reach Evangelis...Social Recruiting for IT Consulting Made Simple | by Bullhorn Reach Evangelis...
Social Recruiting for IT Consulting Made Simple | by Bullhorn Reach Evangelis...
 
Social Recruiting | How to Get Started | a Free e-Book by Bullhorn Reach
Social Recruiting | How to Get Started | a Free e-Book by Bullhorn ReachSocial Recruiting | How to Get Started | a Free e-Book by Bullhorn Reach
Social Recruiting | How to Get Started | a Free e-Book by Bullhorn Reach
 
33 Essential Social Recruiting Stats - 2011
33 Essential Social Recruiting Stats - 201133 Essential Social Recruiting Stats - 2011
33 Essential Social Recruiting Stats - 2011
 
White Paper: Embracing Social Media and Being Smart about It by Laurie Reuttiman
White Paper: Embracing Social Media and Being Smart about It by Laurie ReuttimanWhite Paper: Embracing Social Media and Being Smart about It by Laurie Reuttiman
White Paper: Embracing Social Media and Being Smart about It by Laurie Reuttiman
 
2011 Social Recruiting Trends & Strategies
2011 Social Recruiting Trends & Strategies2011 Social Recruiting Trends & Strategies
2011 Social Recruiting Trends & Strategies
 
Jobvite Social Recruiting Survey Results - 2011
Jobvite Social Recruiting Survey Results - 2011Jobvite Social Recruiting Survey Results - 2011
Jobvite Social Recruiting Survey Results - 2011
 
Seven Steps to Better Brainstorming - by Kevin Coyne & Shawn Coyne - McKinsey...
Seven Steps to Better Brainstorming - by Kevin Coyne & Shawn Coyne - McKinsey...Seven Steps to Better Brainstorming - by Kevin Coyne & Shawn Coyne - McKinsey...
Seven Steps to Better Brainstorming - by Kevin Coyne & Shawn Coyne - McKinsey...
 
Presentation Secrets of Steve Jobs - Carmine Gallo - BusinessWeek Columnist
Presentation Secrets of Steve Jobs - Carmine Gallo - BusinessWeek ColumnistPresentation Secrets of Steve Jobs - Carmine Gallo - BusinessWeek Columnist
Presentation Secrets of Steve Jobs - Carmine Gallo - BusinessWeek Columnist
 
The State of Inbound Marketing - HubSpot Report - January 2009
The State of Inbound Marketing - HubSpot Report - January 2009The State of Inbound Marketing - HubSpot Report - January 2009
The State of Inbound Marketing - HubSpot Report - January 2009
 
Future of Consumerism - MITX FutureM Conference 2010 - AMP Agency Presentation
Future of Consumerism - MITX FutureM Conference 2010 - AMP Agency Presentation Future of Consumerism - MITX FutureM Conference 2010 - AMP Agency Presentation
Future of Consumerism - MITX FutureM Conference 2010 - AMP Agency Presentation
 

Dernier

Boost PC performance: How more available memory can improve productivity
Boost PC performance: How more available memory can improve productivityBoost PC performance: How more available memory can improve productivity
Boost PC performance: How more available memory can improve productivityPrincipled Technologies
 
Exploring the Future Potential of AI-Enabled Smartphone Processors
Exploring the Future Potential of AI-Enabled Smartphone ProcessorsExploring the Future Potential of AI-Enabled Smartphone Processors
Exploring the Future Potential of AI-Enabled Smartphone Processorsdebabhi2
 
Workshop - Best of Both Worlds_ Combine KG and Vector search for enhanced R...
Workshop - Best of Both Worlds_ Combine  KG and Vector search for  enhanced R...Workshop - Best of Both Worlds_ Combine  KG and Vector search for  enhanced R...
Workshop - Best of Both Worlds_ Combine KG and Vector search for enhanced R...Neo4j
 
The 7 Things I Know About Cyber Security After 25 Years | April 2024
The 7 Things I Know About Cyber Security After 25 Years | April 2024The 7 Things I Know About Cyber Security After 25 Years | April 2024
The 7 Things I Know About Cyber Security After 25 Years | April 2024Rafal Los
 
The Codex of Business Writing Software for Real-World Solutions 2.pptx
The Codex of Business Writing Software for Real-World Solutions 2.pptxThe Codex of Business Writing Software for Real-World Solutions 2.pptx
The Codex of Business Writing Software for Real-World Solutions 2.pptxMalak Abu Hammad
 
08448380779 Call Girls In Civil Lines Women Seeking Men
08448380779 Call Girls In Civil Lines Women Seeking Men08448380779 Call Girls In Civil Lines Women Seeking Men
08448380779 Call Girls In Civil Lines Women Seeking MenDelhi Call girls
 
Unblocking The Main Thread Solving ANRs and Frozen Frames
Unblocking The Main Thread Solving ANRs and Frozen FramesUnblocking The Main Thread Solving ANRs and Frozen Frames
Unblocking The Main Thread Solving ANRs and Frozen FramesSinan KOZAK
 
Histor y of HAM Radio presentation slide
Histor y of HAM Radio presentation slideHistor y of HAM Radio presentation slide
Histor y of HAM Radio presentation slidevu2urc
 
08448380779 Call Girls In Friends Colony Women Seeking Men
08448380779 Call Girls In Friends Colony Women Seeking Men08448380779 Call Girls In Friends Colony Women Seeking Men
08448380779 Call Girls In Friends Colony Women Seeking MenDelhi Call girls
 
CNv6 Instructor Chapter 6 Quality of Service
CNv6 Instructor Chapter 6 Quality of ServiceCNv6 Instructor Chapter 6 Quality of Service
CNv6 Instructor Chapter 6 Quality of Servicegiselly40
 
Handwritten Text Recognition for manuscripts and early printed texts
Handwritten Text Recognition for manuscripts and early printed textsHandwritten Text Recognition for manuscripts and early printed texts
Handwritten Text Recognition for manuscripts and early printed textsMaria Levchenko
 
Partners Life - Insurer Innovation Award 2024
Partners Life - Insurer Innovation Award 2024Partners Life - Insurer Innovation Award 2024
Partners Life - Insurer Innovation Award 2024The Digital Insurer
 
Apidays Singapore 2024 - Building Digital Trust in a Digital Economy by Veron...
Apidays Singapore 2024 - Building Digital Trust in a Digital Economy by Veron...Apidays Singapore 2024 - Building Digital Trust in a Digital Economy by Veron...
Apidays Singapore 2024 - Building Digital Trust in a Digital Economy by Veron...apidays
 
Salesforce Community Group Quito, Salesforce 101
Salesforce Community Group Quito, Salesforce 101Salesforce Community Group Quito, Salesforce 101
Salesforce Community Group Quito, Salesforce 101Paola De la Torre
 
The Role of Taxonomy and Ontology in Semantic Layers - Heather Hedden.pdf
The Role of Taxonomy and Ontology in Semantic Layers - Heather Hedden.pdfThe Role of Taxonomy and Ontology in Semantic Layers - Heather Hedden.pdf
The Role of Taxonomy and Ontology in Semantic Layers - Heather Hedden.pdfEnterprise Knowledge
 
Driving Behavioral Change for Information Management through Data-Driven Gree...
Driving Behavioral Change for Information Management through Data-Driven Gree...Driving Behavioral Change for Information Management through Data-Driven Gree...
Driving Behavioral Change for Information Management through Data-Driven Gree...Enterprise Knowledge
 
Automating Google Workspace (GWS) & more with Apps Script
Automating Google Workspace (GWS) & more with Apps ScriptAutomating Google Workspace (GWS) & more with Apps Script
Automating Google Workspace (GWS) & more with Apps Scriptwesley chun
 
Data Cloud, More than a CDP by Matt Robison
Data Cloud, More than a CDP by Matt RobisonData Cloud, More than a CDP by Matt Robison
Data Cloud, More than a CDP by Matt RobisonAnna Loughnan Colquhoun
 
Tata AIG General Insurance Company - Insurer Innovation Award 2024
Tata AIG General Insurance Company - Insurer Innovation Award 2024Tata AIG General Insurance Company - Insurer Innovation Award 2024
Tata AIG General Insurance Company - Insurer Innovation Award 2024The Digital Insurer
 
EIS-Webinar-Prompt-Knowledge-Eng-2024-04-08.pptx
EIS-Webinar-Prompt-Knowledge-Eng-2024-04-08.pptxEIS-Webinar-Prompt-Knowledge-Eng-2024-04-08.pptx
EIS-Webinar-Prompt-Knowledge-Eng-2024-04-08.pptxEarley Information Science
 

Dernier (20)

Boost PC performance: How more available memory can improve productivity
Boost PC performance: How more available memory can improve productivityBoost PC performance: How more available memory can improve productivity
Boost PC performance: How more available memory can improve productivity
 
Exploring the Future Potential of AI-Enabled Smartphone Processors
Exploring the Future Potential of AI-Enabled Smartphone ProcessorsExploring the Future Potential of AI-Enabled Smartphone Processors
Exploring the Future Potential of AI-Enabled Smartphone Processors
 
Workshop - Best of Both Worlds_ Combine KG and Vector search for enhanced R...
Workshop - Best of Both Worlds_ Combine  KG and Vector search for  enhanced R...Workshop - Best of Both Worlds_ Combine  KG and Vector search for  enhanced R...
Workshop - Best of Both Worlds_ Combine KG and Vector search for enhanced R...
 
The 7 Things I Know About Cyber Security After 25 Years | April 2024
The 7 Things I Know About Cyber Security After 25 Years | April 2024The 7 Things I Know About Cyber Security After 25 Years | April 2024
The 7 Things I Know About Cyber Security After 25 Years | April 2024
 
The Codex of Business Writing Software for Real-World Solutions 2.pptx
The Codex of Business Writing Software for Real-World Solutions 2.pptxThe Codex of Business Writing Software for Real-World Solutions 2.pptx
The Codex of Business Writing Software for Real-World Solutions 2.pptx
 
08448380779 Call Girls In Civil Lines Women Seeking Men
08448380779 Call Girls In Civil Lines Women Seeking Men08448380779 Call Girls In Civil Lines Women Seeking Men
08448380779 Call Girls In Civil Lines Women Seeking Men
 
Unblocking The Main Thread Solving ANRs and Frozen Frames
Unblocking The Main Thread Solving ANRs and Frozen FramesUnblocking The Main Thread Solving ANRs and Frozen Frames
Unblocking The Main Thread Solving ANRs and Frozen Frames
 
Histor y of HAM Radio presentation slide
Histor y of HAM Radio presentation slideHistor y of HAM Radio presentation slide
Histor y of HAM Radio presentation slide
 
08448380779 Call Girls In Friends Colony Women Seeking Men
08448380779 Call Girls In Friends Colony Women Seeking Men08448380779 Call Girls In Friends Colony Women Seeking Men
08448380779 Call Girls In Friends Colony Women Seeking Men
 
CNv6 Instructor Chapter 6 Quality of Service
CNv6 Instructor Chapter 6 Quality of ServiceCNv6 Instructor Chapter 6 Quality of Service
CNv6 Instructor Chapter 6 Quality of Service
 
Handwritten Text Recognition for manuscripts and early printed texts
Handwritten Text Recognition for manuscripts and early printed textsHandwritten Text Recognition for manuscripts and early printed texts
Handwritten Text Recognition for manuscripts and early printed texts
 
Partners Life - Insurer Innovation Award 2024
Partners Life - Insurer Innovation Award 2024Partners Life - Insurer Innovation Award 2024
Partners Life - Insurer Innovation Award 2024
 
Apidays Singapore 2024 - Building Digital Trust in a Digital Economy by Veron...
Apidays Singapore 2024 - Building Digital Trust in a Digital Economy by Veron...Apidays Singapore 2024 - Building Digital Trust in a Digital Economy by Veron...
Apidays Singapore 2024 - Building Digital Trust in a Digital Economy by Veron...
 
Salesforce Community Group Quito, Salesforce 101
Salesforce Community Group Quito, Salesforce 101Salesforce Community Group Quito, Salesforce 101
Salesforce Community Group Quito, Salesforce 101
 
The Role of Taxonomy and Ontology in Semantic Layers - Heather Hedden.pdf
The Role of Taxonomy and Ontology in Semantic Layers - Heather Hedden.pdfThe Role of Taxonomy and Ontology in Semantic Layers - Heather Hedden.pdf
The Role of Taxonomy and Ontology in Semantic Layers - Heather Hedden.pdf
 
Driving Behavioral Change for Information Management through Data-Driven Gree...
Driving Behavioral Change for Information Management through Data-Driven Gree...Driving Behavioral Change for Information Management through Data-Driven Gree...
Driving Behavioral Change for Information Management through Data-Driven Gree...
 
Automating Google Workspace (GWS) & more with Apps Script
Automating Google Workspace (GWS) & more with Apps ScriptAutomating Google Workspace (GWS) & more with Apps Script
Automating Google Workspace (GWS) & more with Apps Script
 
Data Cloud, More than a CDP by Matt Robison
Data Cloud, More than a CDP by Matt RobisonData Cloud, More than a CDP by Matt Robison
Data Cloud, More than a CDP by Matt Robison
 
Tata AIG General Insurance Company - Insurer Innovation Award 2024
Tata AIG General Insurance Company - Insurer Innovation Award 2024Tata AIG General Insurance Company - Insurer Innovation Award 2024
Tata AIG General Insurance Company - Insurer Innovation Award 2024
 
EIS-Webinar-Prompt-Knowledge-Eng-2024-04-08.pptx
EIS-Webinar-Prompt-Knowledge-Eng-2024-04-08.pptxEIS-Webinar-Prompt-Knowledge-Eng-2024-04-08.pptx
EIS-Webinar-Prompt-Knowledge-Eng-2024-04-08.pptx
 

Standard & Poor's Industry Surveys: Computers, Hardware - October 28, 2010

  • 1. Current Environment ............................................................................................1 Industry Profile....................................................................................................12 Industry Trends ...................................................................................................17 How the Industry Operates...............................................................................21 Key Industry Ratios and Statistics...................................................................26 How to Analyze a Computer Hardware Company ........................................28 Glossary................................................................................................................32 Industry References...........................................................................................35 Comparative Company Analysis .........................................................Appendix This issue updates the one dated April 22, 2010. The next update of this Survey is scheduled for April 2011. Industry Surveys Computers: Hardware Thomas W. Smith, CFA, Computer Hardware Analyst October 28, 2010 CONTACTS: INQUIRIES & CLIENT RELATIONS 800.852.1641 clientrelations@ standardandpoors.com MEDIA Michael Privitera 212.438.6679 michael_privitera@ standardandpoors.com REPLACEMENT COPIES 800.852.1641 Standard & Poor’s Equity Research Services 55 Water Street New York, NY 10041
  • 2. Topics Covered by Industry Surveys Aerospace & Defense Airlines Alcoholic Beverages & Tobacco Apparel & Footwear: Retailers & Brands Autos & Auto Parts Banking Biotechnology Broadcasting, Cable & Satellite Chemicals Communications Equipment Computers: Commercial Services Computers: Consumer Services & the Internet Computers: Hardware Computers: Software Computers: Storage & Peripherals Electric Utilities Environmental & Waste Management Financial Services: Diversified Foods & Nonalcoholic Beverages Healthcare: Facilities Healthcare: Managed Care Healthcare: Products & Supplies Heavy Equipment & Trucks Homebuilding Household Durables Household Nondurables Industrial Machinery Insurance: Life & Health Insurance: Property-Casualty Investment Services Lodging & Gaming Metals: Industrial Movies & Entertainment Natural Gas Distribution Oil & Gas: Equipment & Services Oil & Gas: Production & Marketing Paper & Forest Products Pharmaceuticals Publishing & Advertising Real Estate Investment Trusts Restaurants Retailing: General Retailing: Specialty Savings & Loans Semiconductor Equipment Semiconductors Supermarkets & Drugstores Telecommunications: Wireless Telecommunications: Wireline Transportation: Commercial Global Industry Surveys Airlines Autos & Auto Parts Banking Food Retail Foods & Beverages Media Oil & Gas Pharmaceuticals Telecommunications Tobacco Standard & Poor’s Industry Surveys 55 Water Street, New York, NY 10041 EXECUTIVE EDITOR: EILEEN M. BOSSONG-MARTINES ASSOCIATE EDITOR: CHARLES MACVEIGH STATISTICIAN: SALLY KATHRYN NUTTALL CLIENT SUPPORT: 1-800-523-4534. ISSN 0196-4666. USPS NO. 517-780. VISIT THE STANDARD & POOR’S WEBSITE: http://www.standardandpoors.com STANDARD & POOR’S INDUSTRY SURVEYS (ISSN 0196-4666) is published weekly. Annual subscription: $10,500. Please call for special pricing: 1-800-852-1641, option 2. Reproduction in whole or in part (including inputting into a computer) prohibited except by permission of Standard & Poor’s. Executive and Editorial Office: Standard & Poor’s, 55 Water Street, New York, NY 10041. Officers of The McGraw-Hill Companies, Inc.: Harold McGraw III, Chairman, President, and Chief Executive Officer; Kenneth M. Vittor, Executive Vice President and General Counsel; Robert J. Bahash, Executive Vice President and Chief Financial Officer; John Weisenseel, Senior Vice President, Treasury Operations. Periodicals postage paid at New York, NY 10004 and additional mailing offices. Postmaster: Send address changes to Standard & Poor’s, Industry Surveys, Attn: Mail Prep, 55 Water Street, New York, NY 10041. Information has been obtained by Standard & Poor’s INDUSTRY SURVEYS from sources believed to be reliable. However, because of the possibility of human or mechanical error by our sources, INDUSTRY SURVEYS, or others, INDUSTRY SURVEYS does not guarantee the accuracy, adequacy, or completeness of any information and is not responsible for any errors or omissions or for the results obtained from the use of such information. Copyright © 2010 Standard & Poor’s Financial Services LLC, a subsidiary of The McGraw-Hill Companies, Inc. All rights reserved. STANDARD & POOR’S, S&P and S&P 500 are registered trademarks of Standard & Poor’s Financial Services LLC. S&P MIDCAP 400 and S&P SMALLCAP 600 are trademarks of Standard & Poor’s Financial Services LLC.
  • 3. INDUSTRY SURVEYS COMPUTERS: HARDWARE / OCTOBER 28, 2010 1 CURRENT ENVIRONMENT Computer recovery races ahead, then taps the brakes Computer hardware markets grew at a fast pace in the first half of 2010, then shifted to a slower speed entering the second half due to several factors, in our opinion. The outlook for growth in gross domestic product (GDP) dampened, hardware inventory levels caught up with end-demand levels, and consumer demand for low-priced netbook PCs ebbed, thereby reducing the outlook for personal computer (PC) unit shipment growth. The computer industry’s progress toward what we believe will be a multi-year expansion began after a deep downturn in late 2008 and early 2009, and a period of demand stabilization near cycle- trough levels in mid-2009. Demand drivers in the present expansion include improving price and performance characteristics for PCs and servers, and the need to satisfy pent-up demand for updated technology in homes and offices. The computer hardware industry’s burst of growth in the first half of 2010 was most evident in the PC industry. The growth rate for PC unit shipments in the first quarter of 2010 (versus Q1-2009) was very brisk at 27.1%, and remained brisk in the second quarter at 22.9% (compared with Q2-2009), according to data from market research firm IDC. In our view, any year with PC unit growth near 15% is a solid year for the industry. The last year in which the industry achieved 15% PC unit shipment growth was 2007, the last full year before the economic downturn set in. Therefore, a unit growth rate above 20% appears unusually perky to us, and is probably unsustainable. A partial reason for the likely drop-off in the unit sales pace in the third quarter of 2010 stems from a cooling of interest in netbooks. We think the adoption of low-priced netbook computers, which drive up the unit count without significantly boosting revenues and profits, began to level off in the summer, as the novelty faded and as an alternative—the new tablet computers—became available. Tablets are small, like netbooks, but have more robust computing capabilities. The iconic iPad from Apple Inc., introduced for sale into the US market on April 3, 2010, and in nine other countries in May, sold in large volumes (almost 3.3 million units by June 26, accounting for about $2.2 billion in revenue) and is spurring development of rival tablet products. We think that any reduction in the price of the iPad (perhaps in 2011, as a second- generation iPad device evolves) would further erode demand for netbooks. Reflecting the tone of the late summer reported results, market research firm Gartner Inc. announced on August 31 a cut in its forecast for worldwide PC unit shipment growth for the second half of 2010 to 15.3%, down about 2% from its prior estimate; it estimated full-year 2010 unit shipment growth at 19.2%. Gartner noted some inelasticity of demand for consumer PCs, as people have come to demand the most updated PCs to get personal business done. Businesses, on the other hand, were viewed as tending to put off PC upgrades to save money in hard times. However, aging equipment suggests that businesses may not be able to delay much longer. The average age of PCs in use by professionals is at an all-time high, according to Gartner, though it did not give a number. PC processor maker Intel Corp. estimates the average age of PCs to be about four to five years, which seems rickety to us, considering that both processors and operating systems have been through several upgrades over that time. Similar in direction and size to Gartner’s PC forecast trimming, IDC on September 2 knocked down its full- year 2010 PC unit shipment estimate to 17% from 19.8%. Both research shops’ views were revised shortly after Intel warned on August 27 that its third-quarter revenues were likely to be below the outlook it set on July 13, when the company described its Q2-2010 results as its “best quarter ever.” Monthly sales data released in mid-August by some Asian parts suppliers also telegraphed a turn towards sluggish demand for the industry. As this Survey was finalized in mid-October, Standard & Poor’s Equity Research was estimating global PC unit shipments to rise about 18% in 2010, followed by an increase of 15% in 2011, reflecting further economic recovery and the persistent need to maintain effective information technology (IT) systems. As
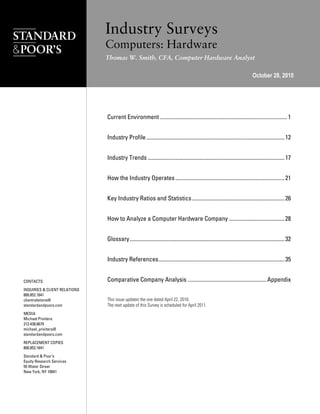
  • 4. 2 COMPUTERS: HARDWARE / OCTOBER 28, 2010 INDUSTRY SURVEYS usual, we expect PC industry revenues to grow more slowly than unit shipments, reflecting the continuation of a long-term trend toward lower average selling prices per unit. We project global PC industry revenue growth near 12% in 2010 and 9% in 2011. On a worldwide basis, PCs are the largest segment of the computer hardware industry. Despite a savage slump in the first half of 2009, the upswing in computer markets late that year was sufficient to bring worldwide PC unit shipments for all of 2009 up 3.0% to about 296 million units, according to IDC’s June 2010 tally. Nevertheless, 2009 appears as a deep valley in the accompanying chart of global PC unit shipment growth estimates from IDC. (These charted numbers do not include the September downtick in IDC’s PC unit shipment estimates for 2010 that were discussed above.) Broadly speaking, IDC is forecasting a return to an era of rapid growth, marked by double-digit increases from 2010 to 2014, similar to what the industry experienced in 2002 through 2008. In line with the economic recovery from the global downturn of 2009, we expect a boost in IT spending overall in 2010 and 2011, but with a more visible rebound for computer hardware goods than for the software and services categories, which suffered less during the downturn. Spending on IT should grow about 6% in 2010, according to IDC’s view in early August, which would bring the IT industry back to its 2008 size of about $1.5 trillion. In this scenario, hardware spending would increase by about 11% to some $624 billion. In August and September 2010, however, there was much discussion among industry observers about whether there would be a pause or an interruption in the global economic recovery (the “double-dip” recession scenario) or a more steady recovery. A hiccup in the recovery could lead to a flat year in 2011, whereas continued economic growth could mean another 6% growth for IT spending in 2011 and better performance for computing hardware. Emerging markets, particularly in the Asia/Pacific region, should be a faster engine for PC sales during the recovery year of 2010 and the period of continued expansion that we see for 2011 and perhaps several years thereafter—given that it has some hotspots of economic growth and some first-time adopters. According to IDC’s June 2010 industry snapshot, PC unit shipments in the Asia/Pacific region (excluding Japan) are forecast to grow about 32% in 2010, faster than the 19.8% increase that the research firm projects for the worldwide PC industry as a whole. (PC unit shipments to the Asia/Pacific region rose 13.9% in 2009, 8.8% in 2008, and nearly 22% in 2007.) Similarly, for IDC’s “rest of the world” (ROW) category, which includes Eastern Europe, Latin America, and the Middle East, PC unit shipments are forecast to outpace the industry in 2010, with growth near 19%; in the following years, however, ROW growth might not keep up with that of Asia/Pacific. Japan is the region expected to show the most modest growth in PC units over the next few years, reflecting its economic prospects and mature PC market profile. Rate of ASP decline normalizes in 2010 As usual, growth in worldwide PC unit shipments translates into a less robust tale in terms of dollar value, given lower average selling prices per unit. Price competition was particularly lively in 2009 for several reasons: the wave of lower-cost mini-notebook PCs, the intense competition for sales during a recession, and an offensive strategy by Asia-based PC makers, notably Acer Inc. and Lenovo Group Ltd., to gain market share in the US. IDC estimates that average system prices (ASPs) for desktops and portables will decline only about 5% in 2010 and 6% in 2011, following decreases of almost 14% in 2009, 4.3% in 2008, and 1.3% in 2007—thus continuing a multiyear downtrend. Reasons for the reversion to ASP declines more in line with historical CHART H04 WORLDWIDE PC SHIPMENT GROWTH WORLDWIDE PC SHIPMENT GROWTH (In percent, based on units shipped) 11.110.7 15.2 10.0 3.0 14.4 12.8 12.0 19.8 0 2 4 6 8 10 12 14 16 18 20 22 2006 2007 2008 2009 2010 2011 2012 2013 2014 Source: IDC's Forecast Update published July 2010.
  • 5. INDUSTRY SURVEYS COMPUTERS: HARDWARE / OCTOBER 28, 2010 3 trends would include greater demand for PCs as the economy improves and a relatively smaller presence of ultraportable PCs (netbooks or mini-notebooks) in the mix. Mini-notebooks typically sell near $400 apiece, compared with about $900 for a traditional notebook PC, which weighs on the overall ASP statistics. Researcher Gartner expects that netbooks, which approached 20% of the PC market by unit sales in the heyday of their early adoption in late 2009 and early 2010, will remain on the scene, but fade back to represent only about 10% of sales in the next four or five years. We think that average system prices for all PCs will decrease about 6% in 2010. Combined with our projected increase in PC unit sales of 18%, this drop in ASPs will result in a 12% increase in the worldwide dollar value of PC sales. This would represent a good year for the PC makers, and certainly a big improvement over 2009, when the value of global PC shipments fell about 11% by IDC’s reckoning (a 3% unit shipment gain combined with a 14% ASP decline). Most companies in the PC supply chain undertook significant cost-cutting campaigns during the downturn that should help make the most out of any improvement in sales or pricing as we head into 2011. We foresee the moderation in component prices since summer 2010 helping PC makers’ profitability in the second half of 2010. We think the component shortages appeared in the first half of this year as the PC industry ramped up unit shipments have faded, as inventories and end-demand have come into better balance. Portability with added features drives demand We expect that underlying demand for PCs will be aided by ongoing adoption of operating system updates from Microsoft Corp. (Windows 7) and Apple Inc. (Snow Leopard); a rebound in growth in emerging economies around the world; and a continuing shift toward notebook, netbook, and tablet computers, and wireless connectivity. Portability has been a key driver: more and more people want their own computer and the ability to take it with them easily. PC users want to clear their desks of cords, which further drives demand for portable PCs and wireless accessories. In 2009, for the first time, portables accounted for more than half of worldwide PC shipments. In 2010, the race is on to add touch-screen capabilities, better video, and more robust features. We think the variables that could dim or brighten PC industry growth over the next few years are largely economic growth factors, such as unemployment levels, energy prices, and the pace of patching up the financial industry. Additional factors might include a possible substitution effect, wherein the purchase of an item such as a netbook, a smartphone, an electronic book (e-reader), or a tablet PC (such as Apple’s iPad) defers or eliminates the need to buy a more expensive desktop or full-size notebook PC. The iPad did seem to take some wind out of the sails of the netbook boom through summer 2010. Nevertheless, we believe the smaller-form computing devices are often an add-on purchase, rather than a substitute for a personal computer. We think 2011 could see some swings in consumer preferences, as rival tablets and smarter phones compete for the attention of buyers of traditional PCs. MATURE MARKETS MAY LAG OTHER REGIONS IN PC SALES PC unit shipments in the US grew at a modest pace of 7.0% in 2009, reflecting sales of 70.1 million units, and could see growth rebound to 13.9% in 2010, according to a June 2010 IDC estimate. As noted earlier, in subsequent comments, IDC tamped down its overall 2010 estimate a bit, but we have retained the earlier, more comprehensive data shown in the table “Worldwide PC shipments forecast by region,” because this presentation shows the relative strength of regional markets. CHART H05: WORLDWIDE PC SHIPMENTS, BY FORM FACTOR 0 100 200 300 400 500 600 2005 2006 2007 2008 2009 2010 2011 2012 2013 2014 Desktops Portables Source: IDC's Forecast Update published July 2010. WORLDWIDE PC SHIPMENTS, BY FORM FACTOR (In millions of units)
  • 6. 4 COMPUTERS: HARDWARE / OCTOBER 28, 2010 INDUSTRY SURVEYS Broadly speaking, the 2005–07 period was one of strong unit growth for the PC industry, with the Asia/Pacific (excluding Japan) and rest of world (ROW) regions leading the charge, often with growth rates exceeding 20%. The industry’s slowdown during 2008–09 hurt growth in every region. From 2010 through 2014, the pattern of the Asia/Pacific region leading growth will return, in our view, as will the pattern of Japan showing the least growth. The other regions—US, Western Europe, and the ROW—should have some good innings ahead, often surpassing 10% annual growth. Beyond the economic growth factors driving PC sales, PC penetration levels are important. Mature markets tend to have more PCs per household or per person, which traditionally has implied a more saturated market with less growth potential. However, as more gadgets appear with some of the functions of traditional PCs (such as netbooks, tablets, e-readers, and smartphones), many people may choose to have more than one machine or gadget, thus expanding the market for consumer electronics with PC-like functions (if not for traditional PCs). Thus, some mature markets may not be as saturated as previously believed. Asia/Pacific may gain PC market share as industry rebounds In 2009, regions outside the US accounted for over 76% of worldwide PC unit shipments. Given our outlook for more rapid growth ahead for Asia and some other markets, we expect to see this percentage increase toward 80% over the next five years, while the US share dwindles toward 20%. In 2009, by IDC’s estimates, the Asia/Pacific region (excluding Japan) represented about 28% of global PC shipments; it might grow to a 31% share in 2010 and, looking further out, a 36% share in 2014. In our view, such an increase would reflect relatively rapid economic growth in China and its neighboring countries, and rising penetration of PCs in the Asian regional markets. Regions that might maintain something near their present market share while Asia grows include Western Europe, with a 22% share in 2009 and 20% estimated for 2014, according to IDC, and the rest of world (ROW), also with about 22% share for 2009 and 20% estimated for 2014. Japan’s share may slip from about 5% in 2009 to roughly 3%. These numbers illustrate a significant turnabout from 2004, when the US was the biggest region, with about 31% PC unit market share, and Asia/Pacific had 21%. TABLE B08: WORLDWIDE PC SHIPMENTS FORECAST BY REGION WORLDWIDE PC SHIPMENTS FORECAST BY REGION 2008 2009 2010 2011 2012 2013 2014 UNITS SHIPPED (THOUS.) United States 65,554 70,131 79,897 90,320 100,878 111,183 121,345 Western Europe 65,220 65,109 73,968 83,271 93,521 103,743 112,943 Japan 14,246 13,428 15,152 14,977 15,096 15,027 14,675 Other Asia/Pacific 72,922 83,038 109,410 130,989 153,236 178,461 207,481 Rest of World 69,490 64,385 76,375 86,298 95,246 104,343 113,170 Total 287,432 296,091 354,802 405,855 457,977 512,757 569,614 MARKET SHARE (%) United States 22.8 23.7 22.5 22.3 22.0 21.7 21.3 Western Europe 22.7 22.0 20.8 20.5 20.4 20.2 19.8 Japan 5.0 4.5 4.3 3.7 3.3 2.9 2.6 Other Asia/Pacific 25.4 28.0 30.8 32.3 33.5 34.8 36.4 Rest of World 24.2 21.7 21.5 21.3 20.8 20.3 19.9 Total 100.0 100.0 100.0 100.0 100.0 100.0 100.0 YEAR-TO-YEAR % CHANGE United States 2.1 7.0 13.9 13.0 11.7 10.2 9.1 Western Europe 17.0 (0.2) 13.6 12.6 12.3 10.9 8.9 Japan 4.8 (5.7) 12.8 (1.2) 0.8 (0.5) (2.3) Other Asia/Pacific 8.8 13.9 31.8 19.7 17.0 16.5 16.3 Rest of World 14.5 (7.3) 18.6 13.0 10.4 9.6 8.5 Total 10.0 3.0 19.8 14.4 12.8 12.0 11.1 Totals may not add due to rounding. Source: IDC's Forecast Update published July 2010.
  • 7. INDUSTRY SURVEYS COMPUTERS: HARDWARE / OCTOBER 28, 2010 5 PC market share: Dell duels with Acer Comparing the market-share stories for the second quarter of 2010 and the prior-year period, the incumbent top-six PC vendors managed to increase their market share, with the exception of Hewlett- Packard Co. (HP) and Dell Inc., according to data from market research firm Gartner. Together, the top six PC makers accounted for about 63.2% of worldwide PC unit shipments in Q2-2010, up from 59.9% in Q2-2009. Thus, the long-term trend for the big to get bigger at the expense of “white box” PCs seemed on track midway through 2010. There are several reasons for this, in our view. For one, scale advantages help the big players extend their reach. In addition, as average selling prices fall and the absolute price difference between a brand-name PC and a brand-X PC shrinks, customers may gravitate toward the brand names for reputation, reliability, and service. In the race to be top dog in the global PC market in Q2-2010, HP was the clear winner with 17.4% of unit shipments in the quarter, according to Gartner. However, HP’s share of unit shipments slipped from 18.8% in Q2- 2009, which may reflect a strong period for netbook sales by Acer, ASUStek Computer Inc., and others. Netbooks sell at a lower price than traditional PCs, and can help create a strong showing in unit shipment counts for vendors that specialize in netbooks. In a dogfight for second place, Acer had 13.0% unit share in Q2-2010, up from 12.0% in Q2-2009, compared with Dell’s 12.4% (down from 12.6% a year earlier), according to Gartner. [We note that by IDC’s tally, Dell had 13.0% share in Q2-2010 compared to 12.6% for Acer, so maybe we should call it a tie.] Lenovo was No. 4 with a 10.0% share of unit shipments, up from 8.2% a year earlier. ASUStek ranked fifth, with 5.2% share, up from 3.5%. Toshiba Corp. was No. 6, with 5.1% share, up from 4.8%, according to Gartner. The next four PC makers in order, as ranked by IDC, were Apple Inc., Samsung, Sony Corp., and Fujitsu Ltd. Looking at the market share pies for the second quarter of 2010, in a comparison of worldwide and US markets, we see Hewlett-Packard as the market leader in both market segments, although its lead over its closest rival is less in the US market. HP had a 17.4% share of worldwide PC unit shipments in Q2-2010, and a 25.7% share of the US market. Dell is decisively the No. 2 vendor in the US market, with about 23.7% share, compared with 11.3% for No. 3 Acer. Dell and Acer are much closer in worldwide unit count (where Chart H08: VENDOR PC SHIPMENTS 0 5 10 15 20 25 30 35 HP Acer Group Dell Lenovo ASUS Toshiba Others Q22009 Q22010 VENDOR PC SHIPMENTS—SECOND QUARTER (In millions of units) Source: Gartner. H02: US AND WORLDWIDE PC SHIPMENTS MARKET SHARES Others 20.8% Hewlett-Packard 25.7% Toshiba 8.7% Acer 11.3% Dell 23.7% Apple 9.8% US AND WORLDWIDE PC SHIPMENTS MARKET SHARES—SECOND QUARTER 2010 (Based on units shipped) US Totals may not add due to rounding. Source: Gartner. Total units: 17.9 million Others 36.8% Hewlett- Packard 17.4% Toshiba 5.1% Acer 13.0% Dell 12.4% ASUS 5.2% Lenovo 10.0% Total units: 82.9 million WORLD
  • 8. 6 COMPUTERS: HARDWARE / OCTOBER 28, 2010 INDUSTRY SURVEYS Acer is No. 2). Apple appears as No. 4 in the US market, with about 9.8% share by Gartner’s count, whereas it misses the top-six list for the world. By IDC figures, Apple is seventh in global PC market share by unit shipments, with about a 4.3% share. In the No. 5 spot in the world according to Gartner is ASUStek, with a 5.2% share; however, ASUStek is not among the top-six US vendors. Toshiba has a 5.1% share of the worldwide market and an 8.7% share of the US market. Looking ahead, a key question for the PC industry is whether HP and Dell can maintain market leadership in the face of lively competition from Asia-based rivals at the low end of the market. They are also in competition with Apple, with its Mac PCs at the high end of the market and its innovative iPad line of tablets at the low end. Interestingly, Gartner’s Q2-2010 research found that iPads did tend to take potential sales away from the netbook category, but did not seem to cannibalize Mac sales. Overall, we see a very competitive marketplace for PCs and believe market share positions could shift around in surprising ways over the next few years. Together, the top five vendors of PCs in the US (Hewlett-Packard Co., Dell Inc., Acer Inc., Apple, and Toshiba Corp. (the same names in the same order as a year ago) held US PC unit market share of 79.2% for Q2-2010. This is lower than the 80.4% top-five concentration a year earlier, suggesting that some smaller players—perhaps netbook-focused sellers that saw unit shipments accelerate in the early-adoption era for netbooks—are making some headway in the US market, in contrast to the general long-term trend toward an industry where the big players are getting bigger. Looking ahead, we think the top-tier PC makers continue to have an opportunity to outpace the industry as a whole, at the expense of white box vendors. We believe this is due mainly to the advantages of economies of scale: more bargaining power with component suppliers, better global marketing and distribution networks, bigger research and development budgets, a greater ability to shift production costs and tax liabilities to the most advantageous countries, and more consistency in attracting top managerial talent, among others. Following are some comments on the performance of top PC vendors so far in 2010.  Hewlett-Packard. HP remains clearly in the lead in terms of global PC unit volume, with 17.4% worldwide market share in PC unit shipments as of the second quarter of 2010, according to Gartner data. We think that HP has done fairly well defending its top position in the face of an onslaught of competition in the netbook or mini-notebook area over the past year. New netbook products, combined with competitive pricing and marketing, helped HP to parry the threat posed by Asia-based netbook-focused challengers such as Acer and ASUStek. Looking at the challenge from US-based rival Dell, HP has some advantage due to its regional focus. HP typically sells about two-thirds of its PCs outside the US, so if overseas PC market growth is stronger for the next few years, as we expect, HP should have an edge over Dell’s more US-centric sales pattern. Of course, Dell is shifting its distribution strategies and may gain ground in overseas markets in the future. We think HP may need some product development to combat Apple in higher-end PCs, and it is already moving on tablet products that may dull the threat from iPad. HP’s July 2010 acquisition of Palm Inc. added a mobile operating system that can be used with handheld computing hardware as well as smartphones.  Dell. In the second quarter of 2010, Dell’s global PC unit shipments grew 19.0% from the year-earlier period, slightly underperforming the industry’s average pace of 20.7%, according to Gartner data. We think this performance suggests that Dell needs to find a new strategy in order to catch up with HP or to keep from being surpassed definitively by Acer. Dell has some strength in its corporate accounts that could help boost unit sales numbers in the second half of 2010. The company has pursued improvements in its PC distribution model in the past couple of years by creating a network of retail partners to boost sales and thus permit greater economies of scale. We believe Dell is succeeding in lifting its volumes, but we still observe fluctuations in various margin and expense levels from quarter to quarter, suggesting to us that Dell has not yet fully arrived at its new operating model. Beyond PCs, Dell is offering its first smartphone product, dubbed the “Aero,” for the US market. The phone is based on Dell’s Mini 3 phone being sold in China and Brazil. While smartphones are an increasingly crowded market, we think Dell’s marketing experience may give it a chance.
  • 9. INDUSTRY SURVEYS COMPUTERS: HARDWARE / OCTOBER 28, 2010 7  Acer. Taiwan-based Acer has moved up to second place on the worldwide PC market share list for Q2- 2010, by Gartner’s tally, with a unit shipment share of 13.0%, up from 12.0% a year earlier. Acer’s unit shipment growth rate was 31.6%, topping the industry pace of 20.7%. If Acer can sustain its success in netbooks as that product category evolves in its lifecycle and as early-adopter sales trail off, it should continue to be an important rival in the mix. Acer is doing well enough in consumer markets, but still faces some challenges in entering the corporate market, which requires different marketing and support strategies.  Lenovo. Acer’s close rival Lenovo held on to fourth place in the global list in Q2-2010. Lenovo grew sales at more than twice the pace of the market in Q2-2010 versus the year-earlier period.  Apple. California-based Apple remains somewhat small among global PC vendors, at the No. 7 spot on the list of vendors by worldwide PC unit sales, with a market share near 4.3% in Q2-2010 by IDC numbers, up from about 4.0% a year earlier. The company showed growth of 31.7%, well above the 22.9% pace of the industry, as tracked by IDC. Unit sales of the company’s Macintosh (Mac) line of computers have been faster than the industry pace in the past several years. We think product differentiation via innovative design and elegant styling has helped Apple, as has the distinctive retail experience available at its Apple stores. While other PC makers rely heavily on mass- market retailers, Apple has its own outlets. Store count grew to 293 stores as of June 2010, up from 273 stores as of its September 2009 fiscal year end, and up from 116 in 2005. Aiding Apple’s computer sales are the popularity of its complementary iPod and iTunes music offerings, as well as the iPhone and iPad products, which are setting new standards for rapid adoption of consumer electronic gadgets. The tablet wave Apple launched its iPad brand tablet computer in April 2010. With more than three million units sold just through June, the iPad is finding success in the middle of the form-factor continuum between notebook computers and smartphones. A main advantage that the iPad has over rival entrants is the large number of software applications already available. Rivals are responding with tablet computers of their own. Dell’s Streak was launched in August 2010. Research in Motion Ltd. introduced its BlackBerry PlayBook tablet at its developers’ conference in September, but the PlayBook won’t be available until early next year. Samsung may have an entry as soon as October 2010. Hewlett-Packard planned to launch a tablet computer platform, known as Slate, sometime in 2010. Acer, ASUStek, Lenovo, Toshiba, and Cisco Systems Inc. are all planning their own tablet products. Note that the competition in tablets is coming down the form-factor continuum from the PC and server makers, as well as up from the smartphone makers, which makes for a crowded playing field. We expect that Apple may try to rise above the fray with a second-generation iPad launch sometime in the first half of 2011, attempting to compete on even higher functionality. Stirring up consumer interest in tablets is the notion of having personal access to the Internet in a very portable device. Touch screen features, a variety of screen sizes, and a rising tide of video content add appeal to the tablet format. SERVER MARKET STARTS TO RECOVER During the second quarter of 2010, worldwide server market revenue increased 11.0% from Q2-2009 and reached nearly $10.9 billion, compared with $9.8 billion a year earlier, according to IDC data. This was the second quarter in a row to show year-over-year improvement in server sales, following a tough industry downturn in 2009. Worldwide server units increased 23.8% in Q2-2010 versus Q2-2009. In 2009, the server market shrank 19.0%, with factory revenue hitting $43.1 billion, down from $53.2 billion for 2008. We view the server market in 2010 as having entered a period of moderate growth that should last several years, given new products, pent-up demand, and gradually improving global economic growth. We project growth near 7% for 2010 and think it may take a couple more years to recapture the total revenue level achieved in 2008, partly reflecting the popularization of lower-priced servers in the mix.
  • 10. 8 COMPUTERS: HARDWARE / OCTOBER 28, 2010 INDUSTRY SURVEYS Of the three segments making up the server market, the volume server segment showed the sharpest recovery in year-over-year revenue growth in Q2-2010, rising 32.0%. For the midrange server category (servers priced in the $25,000 to $250,000 range, as tracked by IDC), the revenue pickup was smaller, at 6.9%. The high-end server segment, which suffered the most over the course of the downturn, continues to experience slow demand, and saw a 23.6% decrease in worldwide factory revenue in Q2-2010 versus the prior-year period. Customers have been waiting for a round of product releases in 2010, including updates in IBM’s System z servers and Power7 Express, which arrived in September 2010. Thus, the lower-priced servers are leading the way to industry recovery. Demand drivers include a need for a wide range of server systems to handle customers’ computing tasks, as well as by customer interest in blade products from IBM, HP, and Dell. Although enterprise customers are favoring volume servers, price competition tends to hinder revenue advances in this segment. With sales depressed for more than a year during the downturn, the need to update an aging installed base of servers is building; this should help to spur sales if the economy improves over the next few years, as we expect. The need for improved system performance continues to drive demand for servers, with customers also looking to keep complexity and cost at manageable levels. Another factor in industry growth is server “virtualization,” in which a software application splits a server into multiple operating environments for greater capacity and efficiency. We think that a trend toward virtualization somewhat tempers demand for new server systems. Blade servers continue to be a relatively strong niche segment in the server arena, as they address common problems of energy consumption and space limitations. In the second quarter of 2010, blade servers represented 14.0% of quarterly server revenue. The growth pace for blade servers in Q2-2010 (versus the vear-earlier period) was 30.9% in revenue terms and 13.6% in unit shipments. Hewlett-Packard and IBM are the largest blade server vendors, with market shares of 55.8% and 24.2%, respectively. Before the big downturn in 2009, the server industry rose at about a 2% pace for several years. We expect a rebound to pre-downturn levels over the next few years, before a return to a long-term trend of slow growth. The speed of the projected rebound would vary with the global economy and amount of pent-up demand that may exist for modern data center equipment. Server market share at mid-2010: HP and Dell make hay In a snapshot of the server industry as of the second quarter of 2010, Hewlett-Packard was in focus with year- over-year revenue growth of 26.0%, versus 11.0% for all vendors, and the top market share at 32.5%, which was an improvement from a 28.6% share in Q2-2009. IBM held the No. 2 spot in market share at 29.8%, down from 34.2% in the prior-year period. IBM’s revenue in Q2-2010 dipped 3.2%, but we think that largely CHART H03: SERVER VENDOR MARKET SHARES Others 11.1% Oracle 10.2% Dell 12.4% IBM 34.2% Hewlett-Packard 28.6%Fujitsu 3.5% SERVER VENDOR MARKET SHARES—SECOND QUARTER (Based on factory revenues) 2009 Totals may not add duetorounding. Source: IDC. Total revenues: $9.8 million Dell 15.6% Oracle 8.6% Fujitsu 3.4% Hewlett-Packard 32.5% Others 10.1% IBM 29.8% Total revenues: $10.9 million 2010
  • 11. INDUSTRY SURVEYS COMPUTERS: HARDWARE / OCTOBER 28, 2010 9 reflected customers waiting for product updates coming in the third quarter. We should bear in mind that IBM has been the server market share leader on a full-year basis for a number of years, and we would be surprised to see that change. Dell was in third place, with 15.6% market share in Q2-2010, an improvement from 12.4% in the prior-year period. Dell experienced a server revenue spurt of 39.1%, which was the fastest growth among the top-five vendors in Q2-2010. Oracle, now the owner of the Sun Microsystems server products, had 8.6% market share in Q2-2010, down from 10.2% a year earlier. The Oracle/Sun line showed a revenue drop of 5.9% in Q2-2010, which was the weakest revenue performance among the top-five vendors. The drop might be explained by the fact that rivals had more than a year and a half to pitch their products to Oracle/Sun customers while Sun was in transition: first during the nine-month wait from announcement to completion of Oracle’s acquisition, and second as Oracle initially integrated the Sun operations. In late September 2010, Oracle held its annual Open World conference in San Francisco, which might be a starting point for Oracle’s offensive in touting its servers. As a group, the top five server makers held about 90% of the server market in Q2-2010. They took about 1% of market share from the ever-smaller “other” category over the previous year. M&A WHEELS TURN AS TECH CONGLOMERATES SEEK COMPLETE DATA CENTER OFFERINGS To date in 2010, one of the most dramatic themes in the computer hardware industry has been the larger companies’ strategic moves to offer more comprehensive data center offerings. IBM, HP, Dell, and Oracle have all engaged in merger and acquisition (M&A) activities aimed at filling voids and adding complementary strengths in their data center capabilities. Simply put, a company needs to be able to offer a client a comprehensive data center solution, consisting of hardware, software, and services. Within hardware, the server is the central machine, but storage and networking capabilities must match up. In the software segment, there are many categories: system software to run the machines, application software to accomplish the tasks, security software to keep it all safe, compliance software to keep it all organized, and so on. Within services, there are set-up and support services to keep systems running, consulting services for getting the most benefit out of the machines and from a company’s stored data, and so forth. Finally, once a data center has everything all ready for one technical standard, it should keep adding expertise to have it ready for all the legacy systems and new systems or standards that are evolving. If a computer company seeks to own most of this data center technology (rather than partner with specialists, as has been the more common method until recently), it would have a lot to buy. Indeed, the biggest outfits have been doing 10 or more acquisitions a year in the past five years. However, the deal action stepped up in 2010 as the comprehensive data center strategy began to play out for the top server vendors. Among the major deals in 2010 was the January completion of Oracle’s buyout of Sun, which dramatically threw a prominent software heavyweight into the hardware business. Another key string of deals was made by HP, which added networking with 3COM Corp. (acquired in April), smartphones and a mobile operating system with Palm Inc. (July), data storage with 3PAR (September), and security and compliance software with ArcSight Inc. (acquisition expected by end of year) and Fortify Software (acquired in September). The 3PAR acquisition turned out to be quite contentious, with Dell initiating the acquisition only to lose in an expensive bidding war to HP. The 3PAR deal might be viewed as a sign that push finally came to shove in the race to build out data center operations by buying the building blocks. Dell has made a few other acquisitions in 2010 to date, but is perhaps conspicuous for being less aggressive in its buildout. IBM has also made a number of smaller deals in 2010 that appear to be extending its existing capabilities (mainly in software), rather than adding a completely new capability. New heavyweights in the fight Looking at these deal patterns, we can make some tentative conclusions about server industry evolution in 2010. First, there are some fresh names among the big companies contending in the total-solution data center business. The Oracle/Sun combination is now a prime competitor for total data center solutions. Following a half-year period of integrating the Sun Microsystems operations, Oracle announced new server products in September. The next move for Oracle, a long-time leader in software, might be to fill in missing building
  • 12. 10 COMPUTERS: HARDWARE / OCTOBER 28, 2010 INDUSTRY SURVEYS blocks in hardware (networking and possibly storage) and in services (consulting with clients on business analytics and learning how to make the most productive use of a data system). Cisco Systems, the long-time leader in networking equipment, has now been on the scene in other data center hardware for a year. So far, it seems to have gone no further into the fray. Rather, the company has focused on video communications, such as the Tandberg acquisition (in April 2010). We think Cisco has the clout to be a bigger competitor in data center hardware, and it will be interesting to see if it chooses that path. Perhaps the capability in video communications that Cisco is pursuing will evolve as another must-have building block for data centers. Overseas, there seems to be little interest in building a complete data center operation. Fujitsu is already in the server game, and SAP is big in software, but neither company has entered the race to offer total data center product lines. It will be interesting to see if any non-US companies step up to the challenge or are daunted by the sight of entrenched incumbent competitors. IBM: the most robust incumbent Another pattern in the 2010 deals is for companies established in an area of data-center expertise to continue to add know-how. For example, we view IBM as already having a presence in most of the hardware, software, and services niches in the data center business, yet it continues to make small and midsize acquisitions to keep initiatives moving forward. It is on track to do more than 10 acquisitions in 2010. We would also note that the company’s capabilities also expand as a result of its hefty R&D budget, which, at about $6 billion a year, is the largest among the server makers. At its May investors’ day meeting, IBM came out with a five-year strategic plan, largely an extension of recent plans, which aimed at making about $20 billion in acquisitions through 2015. Looking at the recent pace of deals, IBM noted that it had made 33 acquisitions for a total cost of about $9 billion in the 2007–09 period, with many of the deals in the business analytics software area. Therefore, it looks like IBM plans to increase its pace of deals, from about $3 billion a year recently to roughly $4 billion a year going forward. We believe this represents a tough challenge for other companies, even Oracle, to meet. Table B07: SELECTED ACQUISITIONS IN THE COMPUTER HARDWARE INDUSTRY SELECTED ACQUISITIONS IN THE COMPUTER HARDWARE INDUSTRY ACQUIRER COST DATE TARGET SPECIALTY OF TARGET ($BIL.) CLOSED HEWLETT-PACKARD ArcSight Security, compliance software 1.5 Pending Stratavia Systems management software NA Pending 3PAR Storage 2.4 Sep-10 Fortify Software Security, compliance software NA Sep-10 3 Com Corp. Networking 3.3 Apr-10 Palm Inc. Smartphones and mobile operating systems 1.8 Jul-10 Electronic Data Systems Services 13.0 Aug-08 Compaq Personal computers 24.2 May-02 IBM BLADE Network Technologies Data center switches NA Pending Netezza Corp. Business intelligence software 1.7 Pending OpenPages Security, compliance software NA Pending Datacap Inc. Document capture and management software NA Pending Unica Corp. Business intelligence software 0.5 Pending Sterling Commerce Customer Relationship Management (CRM) Software 1.4 Pending SPSS, Inc. Business intelligence software 1.2 Oct-09 Telelogic AB Software 0.9 Apr-09 Cognos Inc. Business intelligence software 5.0 Feb-08 DELL Ocarina Networks Inc. Storage < 0.3 Jul-10 KACE Networks Inc. Systems management software < 0.3 1st half Scalent Systems Inc. Systems management software < 0.3 1st half Perot Systems Corp. Services 3.9 Nov-09 EqualLogic Inc. Storage 1.4 Jan-08 ORACLE Sun Microsystems Server, storage hardware; Java software 7.4 Jan-10 BEA Systems Software 8.5 Apr-08 Hyperion Solutions Business intelligence software 3.3 Apr-07 Siebel Systems Customer Relationship Management (CRM) Software 5.9 Jan-06 PeopleSoft Software 11.1 Jan-05 CISCO SYSTEMS Tandberg ASA Video communications 3.3 Apr-10 Starent Networks Corp. Mobile systems 2.6 Dec-09 Pure Digital Technologies Digital camcorders 0.5 May-09 IronPort Systems Inc. Enterprise messaging security 0.7 Jun-07 WebEx Communications On-demand collaboration 3.0 May-07 Scientific-Atlanta Cable set-top boxes 7.1 Feb-06 NA-Not available. Source: Company reports.
  • 13. INDUSTRY SURVEYS COMPUTERS: HARDWARE / OCTOBER 28, 2010 11 Competition to acquire remaining independent specialists: the scramble for 3PAR A development from the M&A activity this year is that the squeeze is on for late movers in the process of adding building blocks for data centers. The rapidly escalating price for storage technology provider 3PAR, brought on by a bidding war, illustrates the problem. Can Dell, lacking the storage building block it sought, still find a comparable independent company specializing in storage? Would it have to pay up for it? Beyond the storage category, we speculate that there may be more bidding competitions as other areas of data center operations become hot, perhaps networking or any of several types of software or services. Most of the computer hardware heavyweights have plenty of cash and borrowing ability, especially at today’s low interest rates, to finance a lot of acquisition activity. A twist in the leadership story On August 6, 2010, the server industry was startled by news that the HP board had ousted chairman and CEO Mark Hurd for conduct contrary to company policy in his handling of expense accounts. This left a major Silicon Valley company suddenly leaderless. In a subsequent twist to the story, Oracle hired Mark Hurd as a co-president and a director, which to our mind fills a gap in leadership for hardware operations at the software giant. We feel that, at that point, because of the switch in leadership, HP looked weaker and Oracle stronger. On September 30, HP’s search for a successor yielded Leo Apoteker, a long-time leader at German software giant SAP AG, as the choice for CEO. It also came up with Ray Lane, a venture capitalist with leadership experience at Oracle, as a board member. We think the selections indicate that HP’s next strategic offensive will be to build out their software offerings, a segment that appears to us to have been relatively overlooked in the recent mix of acquisitions. With software segment revenue only 3% of HP’s revenue in FY 2009, we think there is a need for HP to rebalance its strengths by expanding in software. In the time between Mark Hurd’s departure and the announcement of Leo Apoteker’s election as CEO (which is effective November 1), HP made both the 3PAR and ArcSight acquisitions, authorized another $10 billion for buybacks of HP shares, and issued three notes to raise a total of $3 billion at various interest rates (the rate on one tranche due in 2013 was 1.25%, which looks low by historical norms). While we see these actions as generally in line with HP’s strategic trajectory and not far out of line with industry practices, the 3PAR deal’s high price tag and Mark Hurd’s ejection generated some criticism. In an unusually outspoken statement, IBM CEO Sam Palmisano took HP to task for paying too much severance to Mr. Hurd and too much to acquire 3PAR, as well as for investing too little in R&D (which tends to prompt M&A to make up for innovative deficiencies). Noting that IBM sold off its PC operations to Lenovo back in 2005 for about $1.75 billion, he said, “I couldn’t give it away today”—a pointed comment on the strategies of PC-heavy HP and Dell. Indeed, Mr. Palmisano’s competitive concerns seemed to focus more on Oracle, in part because “Oracle invests.” Meanwhile, we think that Oracle, lacking PCs and printers, tends to view IBM as its most direct competitor. What does it take to succeed? Since 2002, IBM had been showing the way to the new IT conglomerate model: shedding low-margin hardware, and adding higher-margin software and services to complement the remaining high-margin hardware. Over the last few years, the other top players have started to adopt this model as well, and this trend was as strong as ever in 2010. We expect to see more M&A, probably a few bidding wars, and a tumult of rearranged partnerships as the big server companies begin to favor their own brands as they attempt bigger- package sales in the data center market. Despite all the merger activity in the computer hardware industry, we note that there is more than one way to achieve growth. Apple has managed to attain the largest market capitalization in the industry while making very few acquisitions. Key contributors to its growth are internal innovation, the combination of hardware with self-owned operating systems and, where possible, control of the content that goes through the hardware. The data center conglomerates are trying, at the least, to emulate combining hardware with self-owned systems. 
  • 14. 12 COMPUTERS: HARDWARE / OCTOBER 28, 2010 INDUSTRY SURVEYS INDUSTRY PROFILE Volume expansion paused for recession, while pricing pressure persists During each evolutionary phase of the computer hardware industry, the price for computing power has decreased, usability has improved, and the market has broadened. Business spending largely drove growth in computer hardware sales throughout the 1990s. The consumer market became increasingly important during the latter half of that decade, as the Internet boom contributed to rising consumer demand for personal computers (PCs), and that trend has continued. Since 2000, increasing use of computers for audio- visual media is contributing to hardware demand. Looking back to the 1970s, during the early stages of the industry’s evolution, businesses used computers to automate back-office operations such as accounting. Continued advances in technology led to increased computing power, while the size of computers decreased. By the 1980s, computers were small enough to sit on a desktop, and the PC was introduced. Although largely a productivity tool for front-office tasks such as word processing, the new devices also spurred consumer demand for computers. Network computing, the most recent stage in the computer hardware industry’s evolution, has presented a strategic inflection point in the proliferation of PCs and servers. Initially, networked computers attracted a growing base of corporate users. The emergence of the Internet gave this market another shot in the arm and added an unprecedented number of consumers to the mix. Cloud computing—in which users buy processing power as a service via the Internet, rather than having to buy and maintain hardware—is an emerging part of the business. The cloud approach to delivering computing has the potential to offer users a lower-cost alternative and to create a breed of data centers that would cater to cloud users. Rapid proliferation of the Internet culminated in strong growth for the computer hardware industry in 1999 and most of 2000. However, the industry’s fortunes reversed in 2001, and demand remained soft in 2002, reflecting the global economic downturn. From 2003 through about mid-September 2008, the market staged an expansion. Then a global economic downturn knocked information technology (IT) spending down about 4.5% for 2009, with hardware suffering more than software or services. From the vantage point of early autumn 2010, we think this should prove to be a year when the computer hardware industry rebound begins, followed by several years of relatively healthy growth. Standard & Poor’s believes this forecast is achievable, though we expect the pace of growth to vary by segment and region, with Asia leading the way. The computer hardware industry can be divided into two main segments: PCs (including notebooks) and servers (ranging up to large-scale systems such as mainframes and supercomputers), with workstations as a minor third category. Based on estimates from IDC, the value of worldwide PC shipments in 2009 was about $219 billion, and servers were worth about $43 billion, for a total of roughly $262 billion in computer hardware sales in 2009. This indicates that computer hardware is a substantial portion (approximately a fifth) of about $1.43 trillion spent worldwide on IT in 2009, which includes spending on software and services, and some near-cousins of the traditional computing industry (data storage machines, printers, ATMs and retail kiosks, and other increasingly sophisticated office electronics). PC SEGMENT IS LARGEST, MOST COMPETITIVE The highly competitive PC market is the largest sector of the computer hardware industry in terms of both units and dollars. It represented over 80% of the total amount spent on PCs, servers, and workstations in 2009. As estimated by IDC, the number of PC units shipped worldwide in 2009 totaled about 296 million and were worth approximately $219 billion. Unit shipments rose about 3.0%, indicating a growth year for the PC industry despite a sharp downturn that began in late 2008 and started to turn around in the second
  • 15. INDUSTRY SURVEYS COMPUTERS: HARDWARE / OCTOBER 28, 2010 13 half of 2009. Although dodging an actual loss in unit shipment terms, 2009 is apt to be remembered as a landmark bearish year for the industry, stemming from the severe economic downturn. The year 2010 should be widely welcomed as a return to more solid growth. The PC’s heyday was in the early 1990s. Between 1991 and 1995, growth in worldwide PC shipments averaged more than 20% annually, driven largely by the machines’ increasing affordability and capabilities. After a 26% surge in 1995, however, growth trended downward to about 13% by 1998, and the industry was widely deemed to be maturing. In 1999, when shipments surged 23% worldwide, PC makers enjoyed a flashback to the heady growth days of the mid-1990s. However, the unit growth rate slowed to 15% in 2000. While consumers continued to buy PCs, corporate demand started to ebb. The trends that fueled growth in 1999 were also catalysts for much of the healthy growth seen in the first nine months of 2000. Most important were continued price and performance improvements of PCs, which enabled a larger addressable market and sustained demand for upgrades, Internet-driven demand, and greater PC penetration in consumer and emerging international markets. Limiting factors included a weaker European market and a slowing US economy, which depressed growth considerably toward the end of 2000. In 2001, PC unit sales fell on an annual basis for the first time since 1985, declining 4.1%, according to IDC. After a year of modest 1.5% unit growth in 2002, the market gained momentum in 2003 and rose 12%, led by strength in consumer demand and the replacement of desktop computers with notebooks. These factors remained key drivers in PC unit growth in subsequent years—near 15% in 2004, 17% in 2005, 11% in 2006, 15% in 2007, 10% in 2008—though growth slowed to just 3% in 2009. As of October 2010, Standard & Poor’s was projecting PC unit shipments to increase about 18% for the year, in light of continued user demand for laptops and mobile Internet access, and interest in new operating systems from Microsoft Corp. (Windows 7) and Apple (Snow Leopard). For 2011, we project an increase of 15%, reflecting further economic recovery. PC prices in long-term downtrend Cheaper PC prices have been a key contributor to expanding the addressable market for the devices. According to estimates from IDC, the average system price (ASP) for PCs fell 9.5% to $1,699 in 1999, and another 6.1% in 2000 to $1,596. The average system price declined 11.0% in both 2001 and 2002, and another 9.0% to $1,165 in 2003. Price declines were less pronounced in 2004, with the ASP down 4.2%. In 2005, however, price declines accelerated again to 5.9%, and continued at a 5.4% pace in 2006, before easing somewhat to a 1.3% decline for 2007, when the average system price for PCs was $887, according to IDC estimates. Estimates for 2008 showed an ASP decline of 4.3% to $849. In this context, the downshift in 2009 was notable. Driven by the competitive dynamics in the marketplace, the greater presence of netbooks, and the lackluster global economy, the average system price declined almost 14% to $731. Standard & Poor’s expects the pace of ASP drops to return to a more typical pace near 6% for 2010, as the economy picks up and slowing growth in netbook sales curtails the unusual ASP pressure seen in 2009. To some extent, price declines may reflect the pass-through of savings from cost-cutting efforts. Given the long-term downtrend in PC pricing, major players likely will remain under pressure to squeeze costs out of their businesses, in our opinion. PC market share trends With consistent pricing pressure in the industry, the PC market has witnessed rising market share concentration among the top vendors. Only the fittest PC producers have survived. In 1992, the top 10 worldwide vendors accounted for roughly half of the market. From 1999 through 2002, however, just the top five vendors commanded nearly half (45%) of the market. That level climbed further in 2006, 2007, 2008, and 2009, when the top five held 50%, 53%, 57%, and 60%, respectively, based on IDC data. Many industry forecasters have long predicted that the top five vendors may hold 70% of the global PC market in the future. This theory got a boost in September 2001, when HP announced plans to acquire
  • 16. 14 COMPUTERS: HARDWARE / OCTOBER 28, 2010 INDUSTRY SURVEYS Compaq. The deal closed in May 2002, marrying the No. 2 (Compaq) and No. 3 (HP) PC vendors. This combination enabled the two companies to leverage the scale of the merged entity, in an effort to create an improved cost structure and greater distribution opportunities. In terms of unit volume, Compaq was the leading worldwide PC vendor from 1994 through 2000. Dell Inc. claimed the top spot in 2001, according to IDC. In the fourth quarter of 2002, the combined HP and Compaq just barely edged out Dell, and temporarily held the No. 1 position again. In 2003, Dell emerged as the market leader again with a 16.7% share of the market, versus 16.2% for HP. This gap widened further in 2004. Dell’s market share grew to 17.9%, while HP’s share slipped to 15.8%. Driving this trend, in our view, were HP’s publicly stated intentions to focus on profits over PC market share. In 2005, HP’s share position seemed to have stabilized at 15.7%, but the gap between it and Dell widened again, by a further 50 basis points. (Dell’s global PC share for the year was 18.2%, according to IDC.) However, this trend reversed in 2006, reflecting what we believe to be continued momentum at HP and missteps at Dell. As a result, the companies ended 2006 in a virtual tie, with each possessing about 16.5% of the market. In 2007, HP’s share rose sharply to 18.8%, while Dell’s share dipped to 14.9%. Thus, HP was the clear market share leader by units for 2007, with Dell a strong second; no other vendor had more than a 10% share. In 2008, HP remained the clear leader, with a 19.2% market share of the global PC market by units, with Dell a strong second at 15.0%, and Acer closer in third place at 11.0%. In 2009, HP widened its PC market share lead to 20.3% of worldwide unit shipments, versus Dell’s 13.1%. Acer was close on Dell’s heels, with a 13.0% share, and actually surpassed Dell in Q4-2009 unit sales. Lenovo Group Ltd. of China was No. 4 in 2009 with a 9.2% share, followed by Toshiba at 5.6%. (IBM sold its PC unit to Lenovo in May 2005.) Apple Inc. (formerly Apple Computer Inc.) was absent from the list of top five global PC vendors from 1999 through 2009. This fact stands in sharp contrast with Apple’s position as of mid-1994, when the question was whether Apple was No. 1 or No. 2 in worldwide PC shipments. Reasons for the company’s diminishing share in that period included its well-publicized internal problems, aggravated by a fiercely competitive market. More recently, however, things have been looking up for Apple. Its successful digital music player, the iPod, and the new iPhone have created what some consider a “halo” effect: this thesis suggests that iPod and iPhone customers may also buy Mac computers. This may also hold true for the iPad tablet computer, which was launched in April 2010. We think this has been a key factor in Apple’s improvement in US market share from 3.3% in 2004, to 4.0% in 2005, 4.7% in 2006, 6.2% in 2007, 7.9% in 2008, and 8.0% in 2009. Other factors include the Mac’s innovative design, reputation for being reliable and user-friendly, and popularity with the youth market. We expect continued market share gains for Apple in 2010. SERVER MARKET FADES WITH ECONOMY After two years of declines, the server market had a short-lived respite in 2000, when it advanced 6.5% to $60 billion, boosted by the Internet build-out. However, it faced a dramatically different environment in 2001, when the market slid roughly 17.0% to $50.1 billion, according to IDC. In 2002, worldwide server factory revenues declined another 12% to $44.1 billion, reflecting a slump in IT spending amid the US economic downturn. From 2003 to 2005, the server market improved, led by demand for volume servers. Worldwide server revenues grew to $46 billion in 2003 and $49 billion in 2004, as the market witnessed strong growth in volume servers. In 2005, the server market posted an increase to approximately $51 billion in revenues, followed by a modest rise of about 1% to $52.5 billion in 2006, according to IDC data. Figures from IDC show worldwide server revenues increasing about 5% to $55.1 billion in 2007, but then falling by 3.3% to $53.2 billion in 2008, and by 19.0% to $43.1 billion in 2009. Standard & Poor’s projects that server sales will rebound with IT spending in 2010, and recover further in 2011. Nevertheless, we expect pricing pressure to limit revenue potential in servers in the long run, and submit that this is one factor driving the
  • 17. INDUSTRY SURVEYS COMPUTERS: HARDWARE / OCTOBER 28, 2010 15 server makers to try “server-plus” growth strategies, to coin a phrase, wherein the server is a means to sell software and services as a total data center package with higher growth and margin potential. IBM maintained its leadership position in the server market during 2009, according to IDC, with a 32.9% share of revenues, a market share gain of about 1.1%. HP kept its hold on the No. 2 spot, with a 29.9% share, a gain of 0.3% from 2008 levels. Dell was in third place with a 12.1% share, a gain of about 0.5%. Sun Microsystems Inc. was fourth, with market share of 8.8%, down 1.3% from 2008. Somewhat distant in fifth place was Fujitsu/Fujitsu Siemens with market share of 5.1%, about 0.3% higher than in 2008. Volume servers experience slowdown As desktop computers have become increasingly powerful, the distinctions between hardware categories have blurred. In the mid-1990s, PC vendors began broadening their product lines with high-performance Wintel desktop machines capable of operating as servers. This caused explosive growth for the so-called volume server segment (the low end of the server market), with double-digit revenue gains in 1996 and 1997. In 1998, revenue gains subsided as the overall sales mix reflected the increased proportion of these servers based on processors from Intel Corp., among other factors. In 1999, however, sales of volume servers rose 10% to more than $29 billion. Because these servers can be used as front-end servers supporting both online offerings and commerce (or e-commerce), demand was buoyed by the build-out of the Internet. Computer hardware additions were required to support the growing number of users accessing the Internet. Following a slump during the economic recession, the market began to recover in 2002. Revenues advanced 4.9% in 2002, according to IDC, and gained further momentum in 2003 to rise 9.7%. In 2004, the market accelerated and volume server revenues rose 17.6% to $23 billion. In 2005, strong unit growth pushed the volume server category to represent 90% of all server units, and over half of total server revenues, according to IDC. In 2009, the volume server segment represented 98% of total server unit shipments and more than half (56.1%) of total server revenues. Still, the revenue growth rate for volume servers ebbed from the strong levels of 2004: 12.1% in 2005, a modest rise of 4.4% in 2006, an increase of 8.5% in 2007, and a decline of 5.4% for 2008. Revenues totaled about $30.5 billion in 2007, then fell to $29.1 billion in 2008 and $24.2 billion in 2009, according to IDC data. For 2009, the leading market share winner in the volume server category by revenue was HP, which experienced market share expansion to 38.2% (from 36.5% in 2008), as its revenue decreased about 13.0%, which was less than the pace of decline for the volume server industry (17.0%). Dell continued in TABLE B10: WORLDWIDE LEADING SERVER FACTORY REVENUE, BY VENDOR WORLDWIDE LEADING SERVER FACTORY REVENUE, BY VENDOR (Ranked by 2009 factory revenues) REVENUES MARKET ------------- (MIL. $) ------------- SHARE (%) R2008 R2009 % CHG. R2008 R2009 IBM 16,911 14,161 (16.3) 31.8 32.9 Hewlett-Packard 15,759 12,887 (18.2) 29.6 29.9 Dell 6,196 5,226 (15.7) 11.6 12.1 Sun Microsystems 5,362 3,810 (28.9) 10.1 8.8 Fujitsu/Fujitsu Siemens 2,531 2,194 (13.3) 4.8 5.1 Others 6,447 4,818 (25.3) 12.1 11.2 Total 53,206 43,096 (19.0) 100.0 100.0 R-Revised. Source: IDC. Table B02: WORLDWIDE VOLUME SERVER REVENUES WORLDWIDE VOLUME SERVER REVENUES (Ranked by 2009 factory revenues) REVENUES MARKET ------------- (MIL. $) ------------- SHARE (%) 2008 2009 % CHG. 2008 2009 Hewlett-Packard 10,608 9,232 (13.0) 36.5 38.2 Dell 6,195 5,226 (15.6) 21.3 21.6 IBM 4,605 4,233 (8.1) 15.8 17.5 Sun Microsystems 2,253 1,570 (30.3) 7.7 6.5 Fujitsu 1,150 978 (15.0) 4.0 4.0 NEC 722 642 (11.1) 2.5 2.7 Hitachi Ltd. 184 147 (20.2) 0.6 0.6 Lenovo 107 122 14.0 0.4 0.5 Langchao 109 98 (10.7) 0.4 0.4 Apple 102 79 (23.0) 0.4 0.3 Rackable Systems 199 48 (75.7) 0.7 0.2 Powerleader 65 45 (30.0) 0.2 0.2 Founder 12 13 11.6 0.0 0.1 Maxdata 37 11 (70.4) 0.1 0.0 Other 2,745 1,715 (37.5) 9.4 7.1 Total 29,092 24,160 (17.0) 100.0 100.0 Totals may not add due to rounding. Percentages are based on unrounded data. Source: IDC.
  • 18. 16 COMPUTERS: HARDWARE / OCTOBER 28, 2010 INDUSTRY SURVEYS the No. 2 spot, with 21.6% share in 2009, a minor improvement from its 21.3% share in 2008, and its revenue decline in the segment was 15.6%, which was slightly better than the pace for the industry. IBM stood in third place with 17.5% share in 2009 (up from 15.8%), and its revenue fell only 8.1%. Sun was fourth with a 6.5% share in 2009 (down from 7.7% share in 2008), on a revenue decline of 30.3%. Of the five largest competitors, HP and IBM seemed to make the most progress in terms of market share in the volume server segment in 2009, while Sun lost the most. In our view, this partly reflects Sun’s marketplace vulnerability as a lame duck during the lengthy nine- month period before Oracle finally acquired Sun in January 2010. Midrange servers: battle among the top three The midrange server market (enterprise servers with average selling prices range of $25,000 to $249,999 per unit) suffered a hard blow from the IT slowdown in 2001, and worldwide revenues remained under pressure through much of the decade, as the performance capabilities of volume servers kept improving. Revenues for midrange servers were $8.2 billion in 2008, but fell 22.6% to $6.3 billion in 2009. IBM, Sun, and HP continue to dominate this market, according to IDC. In 2009, these three vendors accounted for over 89% of revenues in the midrange server market. IBM reported a revenue decrease of 13.8% in 2009, to about $2.7 billion, while its share rose to 42.5% from 38.2% a year earlier, based on IDC data. Sun’s revenues declined 21.9% in 2009, near the pace of the midrange server industry’s decline of 22.6%, and Sun’s share of this segment grew fractionally to 25.4% from 25.2%. HP’s revenues decreased more sharply, about 36.1%, and its share of this market dipped to 21.6%, from 26.1%. The No. 4 player, Fujitsu/Fujitsu Siemens saw its market share improve fractionally to 4.4% from 4.2%, as its revenue decreased 19.5%. High-end servers: IBM leads segment The high-end server category includes a variety of platforms—supercomputers, mainframes, and minicomputers—in varying stages of maturity. While total server market sales increased sharply in the late 1990s, the high end suffered as customers increasingly off-loaded applications that were traditionally found on mainframes and minicomputers to midrange servers and even high-powered PC servers. Weak US corporate profits in late 2000 through 2001 further hurt demand, and the global economic downturn muted results in 2002. IT budgets remained under pressure in 2003. The market staged a modest recovery in 2004, aided by strength in IBM’s mainframe sales as the company transitioned its mainframe line. The segment’s downward trend resumed in the 2005–07 period. High-end server revenue reached $15.9 billion in 2008, but fell to $12.6 billion in 2009, for a drop of 20.9%. Table B05: WORLDWIDE MIDRANGE SERVER REVENUES WORLDWIDE MIDRANGE SERVER REVENUES (Ranked by 2009 factory revenues) REVENUES MARKET ------------- (MIL. $) ------------- SHARE (%) 2008 2009 % CHG. 2008 2009 IBM 3,128 2,696 (13.8) 38.2 42.5 Sun Microsystems 2,064 1,612 (21.9) 25.2 25.4 Hewlett-Packard 2,139 1,366 (36.1) 26.1 21.6 Fujitsu 347 279 (19.5) 4.2 4.4 NEC 142 114 (19.3) 1.7 1.8 Hitachi Ltd. 40 54 34.6 0.5 0.8 Unisys 69 45 (35.1) 0.8 0.7 Groupe Bull 70 34 (52.0) 0.9 0.5 Teradata 64 28 (55.4) 0.8 0.4 Mitsubishi 19 27 42.5 0.2 0.4 Stratus Computer 40 27 (32.7) 0.5 0.4 SGI 59 24 (59.0) 0.7 0.4 Toshiba 6 5 (23.1) 0.1 0.1 Cray … 3 … … 0.0 Other 6 24 277.9 0.1 0.4 Total 8,192 6,338 (22.6) 100.0 100.0 Totals may not add due to rounding. Percentages are based on unrounded data. Source: IDC. Table B09: HIGH-END SERVER REVENUES HIGH-END SERVER REVENUES (Ranked by 2009 factory revenues) REVENUES MARKET ------------- (MIL. $) ------------- SHARE (%) 2008 2009 % CHG. 2008 2009 IBM 9,178 7,232 (21.2) 57.6 57.4 Hewlett-Packard 3,013 2,289 (24.0) 18.9 18.2 Fujitsu 1,034 937 (9.4) 6.5 7.4 Sun Microsystems 1,045 628 (39.9) 6.6 5.0 NEC 422 393 (6.8) 2.7 3.1 Hitachi Ltd. 287 362 26.0 1.8 2.9 Unisys 290 271 (6.5) 1.8 2.2 Cray Inc. 219 199 (9.1) 1.4 1.6 Groupe Bull 196 186 (5.0) 1.2 1.5 Teradata 129 53 (59.0) 0.8 0.4 SGI 84 26 (68.7) 0.5 0.2 Stratus Computer 9 10 9.9 0.1 0.1 Mitsubishi 14 2 (87) 0.1 0.0 Others … 10 … … 0.1 Total 15,921 12,599 (20.9) 100.0 100.0 Totals may not add due to rounding. Percentages are based on unrounded data. Source: IDC.
  • 19. INDUSTRY SURVEYS COMPUTERS: HARDWARE / OCTOBER 28, 2010 17 For high-end servers, IBM remained the clear leader in 2009. Its market share dipped fractionally to 57.4% in 2009 from 57.6% in 2008, as revenues decreased 21.2%. HP followed with 18.2% of the market, down from 18.9% in 2008, as its revenues fell 24.0%. Fujitsu/Fujitsu Siemens was in the third spot, with a market share of 7.4%, compared with 6.5% in 2008, as its revenue fell just 9.4%, compared to a 20.9% drop for the overall high-end server category. Sun Microsystems saw its revenue drop 39.9%, contributing to a narrowing of market share to 5.0% from 6.6%. Together, these top four vendors controlled 88% of the high-end server market segment. WORKSTATION MARKET SHIFTS TO LOWER-END PRODUCTS In 2009, worldwide workstation shipments plummeted 23.7% to about 2.3 million units, according to IDC figures. Revenues for the workstation market fell about 28.5% to $4.4 billion, as average selling prices declined. Workstations should see unit growth of about 13% in the rebound year of 2010, and grow over 10% each year through 2013, reaching a value of near $6.5 billion, despite steady to slightly lower ASPs. Workstations, the industry’s fastest-growing sector in the late 1980s, were unique in that they combined powerful processors, networking, and graphical user interfaces in a single compelling package for the first time. They were aimed at engineering, three-dimensional animation, and scientific applications; production of 3D movies is a present-day task where workstations have some advantages. In the past, Unix vendors dominated this area, accounting for 85%–90% of the market. However, as the segment has shifted to lower-end personal workstations from higher-priced Unix workstations, Windows-based workstations came to hold about 93% of the market in 2009, according to IDC data. Market leaders in workstation lines are Dell and HP, with Lenovo and Sun also in the mix. INDUSTRY TRENDS Spending on computer hardware, defined as server and client (PCs and workstations) systems, represents about a fifth of the worldwide spending on information technology (IT). More broadly defined to include storage disk systems and tape, peripheral equipment such as printers, and networking equipment, as well as the server and client computer systems, computer hardware is about 40% of total IT spending. According to market researcher IDC, IT spending reached roughly $1.5 trillion in 2008, and then fell about 4.5% (in constant currency terms) to about $1.43 trillion in 2009. In 2010, IDC projects that such spending might rise about 3% to $1.48 trillion, thus not quite regaining the 2008 level. To put this current level of nearly $1.5 trillion in perspective, the worldwide IT market was valued at nearly $1.0 trillion in 2001 and just $360 billion in 1993. What propelled this stellar growth? The Internet. Widespread use of the Internet stimulated demand for a host of IT-related products and services. In 1998, an estimated $211 billion could be linked to technology investments related to the build-out of the Internet, according to IDC. Spending for online infrastructure was estimated at $600 billion in 2003. While the investment boom may take a pause during years of slow economic growth, as occurred in 2001 and 2002 (with declines of 0.5% and 4.1%, respectively, according to IDC), and in 2009, we think the longer-term outlook remains positive. We believe IT spending increased at a 6%–7% annual pace in 2005, 2006, and 2007, but dipped to a slower growth level near 3.6% in 2008, and decreased about 4.5% in 2009, as a result of the global economic slowdown. Because infrastructure development is needed to meet growing demand from new users and for new applications, Internet-related spending should continue to rise. US PC MARKET GROWS IN SPURTS Just when the computer hardware industry was considered mature in the latter half of the 1990s, the industry witnessed a resurgence ushered in by the Internet age. Demand to get online—coupled with the proliferation of low-priced (in some cases, even free) PCs—bolstered demand in the US through 1999. According to IDC, US PC unit shipments increased by 27% and 24% in 1994 and 1995, respectively. When
  • 20. 18 COMPUTERS: HARDWARE / OCTOBER 28, 2010 INDUSTRY SURVEYS annual growth slipped to 15% in 1998, many observers concluded that growth in the US was decelerating because of a saturated market. Then, in 1999, US PC shipments surged 25%. From 2000 through 2002, however, PC sales growth slumped in the US. According to Gartner Inc., an IT market research firm, US PC shipments rose less than 8.0% in 2000, declined approximately 11.0% in 2001, and grew by 4.4% in 2002. Picking up the trail from there, figures from IDC show that US PC shipments grew about 10.8% in 2003, 10.5% in 2004, and 8.5% in 2005. Growth decelerated in 2006, with US unit shipments up only 3.6%. Growth improved in 2007, but only to about 7.6%. Results for 2008 were an increase of only 2.1%, followed by a similar lackluster increase near 3.0% in 2009. We expect a substantially higher increase for 2010, perhaps as high as 18%. Market concentration became noticeable by the late 1990s. It then became pronounced with the combination of Hewlett-Packard Co. (HP) and Compaq Computer Corp. in 2002, Gateway Inc.’s acquisition of eMachines Inc. in 2004, and International Business Machines Corp.’s (IBM’s) sale of its PC unit to China-based Lenovo Group Ltd. in May 2005. The consolidation trend continued when Taiwan- based Acer Inc. acquired Gateway Inc. in October 2007. In addition, computer hardware vendors have broadened their product offerings to offset declining margins. These companies are now becoming more focused on cash management and on higher inventory turns and returns on assets. While the PC industry is certainly maturing, in Standard & Poor’s opinion, there are still geographic areas where PC penetration is well below saturation levels. In addition, the introduction of higher performance products and Internet services (including broadband access) will likely continue to boost demand over the next several years, sustaining unit growth in the high single-digit range over that period. CONSOLIDATION EXTENDS TO SERVICES The computer industry has long experienced consolidation in hardware operations, and Standard & Poor’s expects the consolidation trend to expand to emphasize software and services, as companies strive to produce one-stop shopping convenience for information technology customers, add recurring revenue streams to aid earnings stability, and increase economies of scale to help profitability. The largest merger in the industry to date was the May 2002 acquisition of Compaq by HP, valued at some $19 billion. Before that, the largest merger was Compaq’s June 1998 acquisition of Digital Equipment Corp. (DEC), valued at $8.4 billion. Among other mergers, Packard Bell and NEC Corp. combined forces in 1997. (After a series of investments of more than $1.3 billion, NEC shuttered the Packard Bell brand in the US in 1999.) Gateway acquired eMachines in March 2004 for an estimated $250 million, and China-based Lenovo Group acquired IBM’s PC division in May 2005 for about $1.75 billion. Acer purchased Gateway in October 2007 for about $710 million. Acquisition strategies have let companies broaden their customer base and offer a wider array of computing products and services. Over the past several years, Sun added personnel to beef up its services offerings and has forged alliances with computer services companies. Compaq’s acquisition of DEC provided it with high- end Unix systems and a worldwide service organization. HP now holds not only the former Compaq service assets, but also the large technology services capacity of Electronic Data Systems Corp., which HP acquired in August 2008 for about $13.9 billion. This allows HP to present customers with broad offerings in hardware, software, and services, along the lines of a model pursued by rival IBM. IBM, the global leader in services, acquired the consulting unit of PricewaterhouseCoopers International Ltd. in July 2002. (Some two years earlier, HP had been in discussions to acquire the unit.) Since then, IBM has engaged in a string of software and service acquisitions. The company made 12 acquisitions in 2007 for a total cost of $1.1 billion, of which six were in software and five were in services. A headline deal for IBM was the February 2008 purchase of Ottawa-based Cognos for approximately $5 billion, which added expertise in business intelligence software and services to help facilitate customers’ real-time decision- making based on their data. IBM had announced at least 10 acquisitions in 2010 through September, including two with price tags of over $1 billion each. IBM’s revenue in 2009 came 58% from services, 23% from software, 17% from hardware, and 2% from financing, illustrating a diversification among segments,
  • 21. INDUSTRY SURVEYS COMPUTERS: HARDWARE / OCTOBER 28, 2010 19 albeit with a tilt favoring services and software lately. Hardware appears to be something of a loss leader by which IBM attracts business for its other segments. As networks of computers have become larger and more complex, customers increasingly prefer to use a single vendor for all of their computing platforms. This provides one source of accountability and enables easier technology upgrades. Standard & Poor’s believes this trend will promote further consolidation ahead. COMPETITIVE PRICING EVERYWHERE Several factors have affected computer hardware pricing and sales trends. While chip prices continue to fall and component prices decline steadily, the industry’s consolidation has also enabled computer companies to trim operating expenses. Consolidation, however, has also contributed to a more intensely competitive pricing environment that continues to weigh on all computer hardware categories. Vendors try to offset price declines by achieving better volumes via market share gains, and the competitive cycle continues. In the following discussion, we present some context for the pricing pressures at work in the various segments of the computer hardware industry.  PCs. Price competition has been the hallmark of the PC market. One reason is that PCs have become more commodity-like with the standardization of their primary components. Microsoft Corp.’s Windows operating system software is used in an estimated 85%–90% of PCs worldwide, and Intel Corp.’s processors are used in approximately 80%. Price competition in the PC market became fierce in 1992, when Compaq’s price actions precipitated a shakeout among second- and third-tier suppliers. Compaq led the charge again in 1997, dominating the sub-$1,000 PC market at the low end of the market and challenging the price points of direct sellers such as Dell at the high end. Over the past few years, prices have continued to erode, particularly in the desktop market, as demand for notebooks has accelerated. Traditionally, direct sellers have been able to underprice indirect sellers like Compaq and HP, which sell through retail channels. This is because direct sellers yield savings by maintaining low inventory levels. In addition, they do not have to pay the incentives or price guarantees that indirect sellers typically pay resellers. However, many PC makers who sell indirectly are now also using the direct sellers’ techniques— such as online order capabilities and build-to-order strategies—to gain efficiencies and narrow price gaps, as well as reduce their cost structures to compete better on price.  Servers. In contrast to the PC market, the explosive growth in servers in the late 1990s attracted new entrants. PC server participants, lured by growth rates of 25%+ projected for this segment, further stimulated the market with dramatic price cuts. Demand also benefited from a technology migration to systems with Intel’s server-based chips (originally Pentium Pro, followed by Pentium II/III processors and the newer Pentium IV, launched in 2000, and Itanium in 2001) and Microsoft’s Windows NT Server and Windows Server 2000 operating systems. Windows Server 2003, released in April 2003, witnessed traction with users in 2004, as shipments of paid new licenses for this operating system more than doubled. Additional gains of 23.7% and 13.8% were attained in 2005 and 2006, respectively.  Workstations. Growth in this area has been challenged as manufacturers have faced PC-like pricing pressures given the influx of PC-based units. Revenues have also been under pressure as the lower-priced Windows NT workstations have grown at a faster pace than traditional workstations. [Traditional workstations use the Unix operating system and reduced instruction set computer (RISC) microprocessors.]  Large-scale systems. Pricing pressures on large-scale systems like mainframes have been well documented. US businesses are actively moving mainframe applications to other computer platforms, mostly to client/server systems and local area networks (LANs). The competition from the popular client/server and LAN environments has forced mainframe vendors to become more price-competitive. In recent years, however, mainframe makers, led by IBM, have introduced easier, cheaper systems that use complementary metal oxide semiconductors (CMOS). Migration to these new machines should sustain unit growth, partly offsetting the pressure on revenue growth.
  • 22. 20 COMPUTERS: HARDWARE / OCTOBER 28, 2010 INDUSTRY SURVEYS PCs keep getting cheaper... As the PC market matures, manufacturers have addressed affordability and innovated to expand market opportunity. In the consumer market, industry studies through early 1997 showed that the majority of US households with incomes higher than $50,000 had already purchased a PC. The typical price point for a PC at that time—$2,000—was out of reach for many less affluent consumers, so analysts argued that the home PC market was saturated. Since then, however, PC vendors have responded with lower prices, and sales have proliferated. By the late 1990s, all major vendors offered a PC priced at less than $1,000. By 2006, desktop models could be bought for less than $500, and laptops for less than $700. The sub-$1,000 PC has succeeded in raising the penetration of PCs in the home market. According to technology market researcher Forrester Research, US household PC penetration was more than 80% in 2010, and almost half of US households had more than one PC. With the popularity of sub-$1,000 PCs, the outlook for PC vendors’ profitability became a critical issue in 1999. All major PC vendors have had to adjust their cost structures. The major indirect PC vendors have enacted some form of build-to-order manufacturing strategy (as opposed to the prior build-to-forecast method), in order to achieve savings by maintaining lower inventory levels. The drive to lower costs was among the forces behind the 2002 merger of HP and Compaq. Indeed, in recent years, all the major PC vendors have struggled to try to emulate some aspect of the low-cost business model perfected by Dell. In addition, while lowering their base prices, PC vendors have tried to augment the potential add-ons for each PC sold by increasingly offering system upgrades, software, peripherals, financing, warranties, and other services to customers. Particularly in the business market, where PCs often are tied into network systems, studies have revealed that the total cost of a PC is reflected less in the up-front price paid for the device and more in the maintenance and support of the computer following the purchase. ...as do Intel processors As Intel introduces each new processor, it aggressively drives down prices of older processors. This makes PCs based on older chips more affordable to a broader market. For example, when the 233 megahertz (MHz) version of Intel’s Pentium II was introduced in mid-1997, chips were priced at $636 each; by January 1998, they were $268—a 58% drop in about six months. Similarly, the list price of a 600 MHz Pentium III desktop processor was $615 in September 1999, but dropped 61% to $241 by February 2000. Price cutting accelerated with the Pentium IV. In July 2001, Intel’s 1.8-gigahertz (GHz) Pentium IV processor carried a list price of $562 each; by the end of August, it was $256, and, in March 2002, it was $193. By February 2003, less than a year later, you could get a 2.5 GHz Pentium IV (a 40% hike in computing power) for the same $193. By February 2004, a 2.8 GHz Pentium IV was $178; and by January 2006, that same $178 was the price point for a 3.0 GHz Pentium IV. As of September 2010, Intel could offer its Pentium processor line for less than $80 per unit. An Intel Core i5 3.33 GHz was offered at $170, and a low-power version (for laptops) was available at $190. Meanwhile the Intel Atom Dual-Core 1.5 GHz processor for netbooks, was offered in September 2010 for $86. (For further discussion of semiconductors, see the Semiconductors Industry Survey.) WINTEL’S ROLE IN THE UPGRADE CYCLE Demand for new computers typically accelerates as users migrate to faster processors and/or new operating systems. This is known as the “upgrade cycle,” a trend that has proven powerful in the PC business. The upgrade cycle assumes that users will trade up to PCs that are more powerful when a new operating system is released, thus stimulating hardware sales. This happened in 1995, when the introduction of Microsoft’s Windows 95 caused a surge in PC shipments: in order to handle the new operating system, consumers needed to upgrade to more robust PCs. The upgrade cycle was again apparent in the first quarter of 1997, when US PC shipments grew 20%, the highest year-to-year increase since 1995. This growth was buoyed by migration to MMX (Intel’s multimedia software instruction set), as well as by a continuing wave of corporate upgrades to Pentium Pro machines with Windows NT.
  • 23. INDUSTRY SURVEYS COMPUTERS: HARDWARE / OCTOBER 28, 2010 21 The combination of Windows operating systems and Intel processors has been nicknamed “Wintel.” The Wintel dynamic is permeating almost all computer platforms, because of its compelling price/performance compared with the alternative: the reduced instruction set computer (RISC) processor/Unix operating system combination, which had long dominated multiuser systems and workstations. Another upgrade cycle was launched with Microsoft’s Windows 2000. However, there was a much more gradual uptake than in prior cycles. The operating system was officially launched in early 2000, but the momentum in user upgrades to the platform was less robust than early predictions. The industry was also expected to witness an upgrade cycle in 2002 with the introduction of Windows XP, which was launched on October 25, 2001. Both of these upgrade cycles—the former aimed at the business market and the latter at consumers—were limited by the US economic downturn in 2001 and 2002. The next major upgrade from Microsoft began with the launch of Vista. The enterprise version was released in November 2006 and the consumer-based offering debuted in January 2007. Adoption rates have been slower than in previous Microsoft versions; reasons include mixed reviews of the product, and what we view as a lack of compelling new technological features, despite some product enhancements. The latest PC operating system from Microsoft is Windows 7, available since autumn 2009. This version has been generally well received and may release some pent-up demand from PC users who sought to skip the Vista era and thus have aging PCs. INTERNATIONAL MARKETS OFFER LONG-TERM GROWTH International markets present a promising opportunity for computer hardware vendors in the years ahead. We think the growth trajectory for the Asia/Pacific region still looks positive, following the 2009 slowdown. Indeed, over the next several years, the Asia/Pacific market should continue to expand faster than the US market. Market research firm IDC projects that PC unit shipments to Asia/Pacific (excluding Japan) will increase at a compound annual growth rate (CAGR) of 20% from 2010 to 2014. Meanwhile, the more mature markets in the US and Western Europe, as well as the rest of world (ROW) category, are projected to grow at a less lively pace in the 11%–12% range. The outlook for Japan is for a significantly slower growth rate (near 2%) for the 2010–14 period. The Asia/Pacific region has generally been exhibiting superior growth since 2000. In 2007, Asia/Pacific captured the largest share of the global PC market by unit shipments, according to IDC figures. By 2012, IDC estimates Asia/Pacific will account for one-third of PC shipments, and continue to grow share for at least a few years after that. International markets can show favorable growth patterns because emerging economies may have faster growth rates, and because such markets are less saturated with PCs. HOW THE INDUSTRY OPERATES The modern computer hardware industry began in the early 1980s with the introduction of the personal computer (PC). Before then, computing was dominated by International Business Machines Corp.’s (IBM’s) mainframes and confined mostly to computer professionals and scientists. The Altair 8800—the first commercially successful PC in the early 1970s—spawned much of what is thought of as modern computing. In a general sense, the Altair 8800 provided the seeds for the eventual introduction in 1981 of IBM’s PC. In a more narrow sense, the Altair introduced two key concepts that remain critical to computer hardware manufacturers to this day. First, because the Altair was mass- produced, the manufacturer was able (eventually) to obtain Intel Corp.’s 8080 chips at an attractive price. Second, the Altair was based on an open-systems architecture. Furthermore, it was the Altair, gracing the cover of Popular Electronics, a magazine aimed at the electronics hobbyist, on January 1, 1975, that inspired Bill Gates and Paul Allen to develop a version of BASIC, the first language program for a PC. Following the Altair, there was a rash of introductions of other personal computing devices, including the Commodore PET, RadioShack Corp.’s TRS-80, and the Apple II from Steve Wozniak and Steve Jobs. At that time, however, these PC devices were mainly the province of hobbyists.
  • 24. 22 COMPUTERS: HARDWARE / OCTOBER 28, 2010 INDUSTRY SURVEYS In 1981, IBM introduced the IBM PC, launching the PC market and transforming the industry forever. The PC not only brought computers to a broader customer base, it also was one of the first IBM products to adopt an “open architecture,” in which IBM revealed the instructions and specifications. This enabled other companies to develop their own PC “clones” that would be compatible with IBM’s machine, as well as peripheral devices, such as external storage, printers, and video and sound devices, among others. This open architecture quickly evolved into a de facto industry standard. It included a microprocessor from Intel and the Windows operating system from Microsoft Corp. with its graphical user interface, which eliminated the need for users to remember the arcane commands required by its predecessor operating system, MS-DOS. Once computer makers were able to clone IBM’s PC based on its open-standard architecture, PC sales took off and prices came down. This effectively began the “commoditization” of the PC, which is still a major force in the economics of the industry. The development of the PC coincided roughly with the birth of today’s other major computing platforms: servers and workstations. Servers, which at their most basic function closely resemble PCs, are used in corporations and governmental or educational enterprises to handle large computing needs. They have become so widespread that mainframes, while technologically distinct, are now categorized as another class of server. Together with the PC, servers created a new model of computing known as the client/server model, in which a “client,” normally a PC, requests a file or other information from a server via a network connecting the two. This allows the more powerful server to share its resources with many other, less powerful client computers. Workstations are the other major computing platform. Introduced in 1982 by Sun Microsystems Inc. (which was acquired by Oracle in January 2010), they too are closely related to PCs. Essentially, they are high-end PCs with advanced graphics capabilities that are designed to handle data-intensive scientific and engineering applications. Of the three categories that now make up the computer hardware industry, PCs represent over 80% of global revenues. COMPUTER FORM FACTORS Just about every kind of computer comes in a variety of “form factors”—physical designs that play a large role in determining the computer’s potential uses and markets. The most common form factor distinction in the PC market is that between desktop and laptop (or portable) computers. Laptops contain similar electronics to desktops, but they must also meet a unique set of requirements, such as reduced power usage and heat generation. Historically, a laptop or portable PC typically meant a notebook-sized computer, but in recent years, a smaller “ultraportable” form factor—often called a mini-notebook or netbook—began to emerge as another type of laptop that allows users to connect to the Internet while on the go. Tablet computers are a form factor somewhere between netbooks and laptops. In 2010, Apple scored a hit in the tablet category with the introduction of its iPad product. With many other vendors also introducing tablets, the netbook boom of 2009 and early 2010 has cooled. Servers and workstations also come in a variety of form factors. In recent years, “blade” or rack-optimized servers, which are simply circuit boards designed to standard specifications, have grown popular with corporations and other enterprises. They allow customers to create standardized, expandable computer racks and easily add or remove individual servers. ASSEMBLERS, MARKETERS, AND MANUFACTURERS The companies that produce PCs, servers, and workstations are often thought of as manufacturing companies, yet in reality, they do little more than assemble a standard set of components bought from various third parties. Since these components are often sourced from the same manufacturers, there is little real difference in the functional performance of most similarly equipped computers. Computers are made from a relatively small list of components. At the heart of a computer is the motherboard—a circuit board that holds the essential electronics of the computer. These include the microprocessor or central processing unit (CPU), memory chips, the program needed to start the computer,