1. Purchasing Managers’ Index – Services June 5, 2012
Services PMI falls to 47.7 in May: service sector economy
continues to lose steam
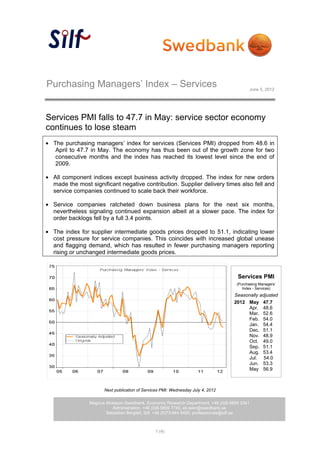
The purchasing managers’ index for services (Services PMI) dropped from 48.6 in
April to 47.7 in May. The economy has thus been out of the growth zone for two
consecutive months and the index has reached its lowest level since the end of
2009.
All component indices except business activity dropped. The index for new orders
made the most significant negative contribution. Supplier delivery times also fell and
service companies continued to scale back their workforce.
Service companies ratcheted down business plans for the next six months,
nevertheless signaling continued expansion albeit at a slower pace. The index for
order backlogs fell by a full 3.4 points.
The index for supplier intermediate goods prices dropped to 51.1, indicating lower
cost pressure for service companies. This coincides with increased global unease
and flagging demand, which has resulted in fewer purchasing managers reporting
rising or unchanged intermediate goods prices.
Services PMI
(Purchasing Managers’
Index - Services)
Seasonally adjusted
2012 May 47.7
Apr. 48.6
Mar. 52.6
Feb. 54.0
Jan. 54.4
Dec. 51.1
Nov. 48.9
Oct. 49.0
Sep. 51.1
Aug. 53.4
Jul. 54.0
Jun. 53.3
May 56.9
Next publication of Services PMI: Wednesday July 4, 2012
Magnus Alvesson Swedbank, Economic Research Department, +46 (0)8-5859 3341
Administration, +46 (0)8-5859 7740, ek.sekr@swedbank.se
Sebastian Bergfelt, Silf, +46 (0)73-944 6450, professionals@silf.se
1 (4)
4. Silf/Swedbank’s
Purchasing Managers’ Index – Services
- objectives and methodology
History Silf and Swedbank AB publ. made the first joint – internal – calculation of
the “Purchasing Managers’ Index” for the service sector of the four
indexes (PMI) during 2005. The model for PMI – Services is the U.S.
based Non-Manufacturing Index and the Swedish PMI, which has been
published since November 1994
Participants About 200 purchasing managers in the service sector.
Publication Third weekday of each month, 8:30 am.
Analysis Period Comparison with previous month.
Composition
of PMI – Services (%) New orders (within the company) 35
Business activity (within the company) 25
Employment (within the company) 20
Suppliers’ Delivery Times 20
Other leading indicators
(not included in PMI – Services) Backlog of Orders
Suppliers’ intermediate goods prices
Planned business activity next six months
Objective Quick economic indicator
Simple statistics
Statistics with relatively short publication intervals
Constant contact with a well-informed professional group
Calculation According to “diffusion index”. Positive changes are noted in percent for
the four sub indexes. The percentage of unchanged replies, multiplied by
0.5, is added to this figure. Then the different sub indexes are weighted as
described above to reach the total index. The Purchasing Managers’
Index – Services does not indicate activity levels but rather monthly
changes in activity in the service sector.
“Break-even” The dividing line between growth and decline – in line with US praxis –
has been drawn at a total index of 50. However, this boundary or “neutral
growth zone” should not be applied excessively. Rather, “Break-even” at
50 indicates a target value.
We believe we have used reliable sources and procedures to generate and analyze the Purchasing Managers’ Index (PMI –
Services). However, Swedbank AB (publ) and SILF (earlier Organisationen för Inköp och Logistik, /I&L/ – The Organization
for Purchasing and Logistics) cannot guarantee the accuracy or completeness of the analyses and cannot be responsible for
any errors or omissions in the basic data or processing thereof. The reader should base any decisions on other background
material as well.
Swedbank AB (publ), SILF. their employees, and other coworkers accept no liability whatsoever for any direct or
consequential loss or injury of any kind arising from any errors or omissions in the analyses presented in the Purchasing
Managers’ Index – Services.
4 (4)