SlideShare une entreprise Scribd logo
1  sur  4
Télécharger pour lire hors ligne
Purchasing Managers’ Index – Services                                                          6 April 2011


Services PMI drops to 61.2 in March: a slight decline from a
high level

• The purchasing managers’ index for service companies (Services PMI) dropped
  from 62.4 in February to 61.2 in March, thereby reaching its lowest level since
  September 2010. This drop was from a high level, however, and the majority of
  service companies are still reporting improving business conditions, albeit at a more
  moderate pace.

• Of the four component indices, new orders accounted for the most significant
  decrease, followed by employment and supplier delivery times. The index for service
  companies’ business activity, on the other hand, climbed in March relative to the
  previous month.

• The index for planned business activity remained unchanged compared to the
  previous month at 70.3. Service companies’ business activity plans thus indicate
  that business will grow for the next six months, although the plans have been
  revised downward somewhat from the last quarter of 2010.

• Though the price index for supplier intermediate goods prices fell from 69.9 in
  February to 65.1 in March, most companies report rising prices. The strong Swedish
  economy and higher global commodity prices have likely contributed to the higher
  price pressure in the private service sector.


                                                                                                      PMI – Services
                                                                                                       (Purchasing Managers’
                                                                                                          Index - Services)
                                                                                                          Seasonally
                                                                                                           adjusted
                                                                                                      2011 mar 61,2
                                                                                                            feb 62,4
                                                                                                            jan 65,9
                                                                                                      2010 dec 66,0
                                                                                                            nov 64,2
                                                                                                            okt 63,7
                                                                                                            sep 61,0
                                                                                                            aug 63,9
                                                                                                            jul   62,7
                                                                                                            jun 59,1
                                                                                                            maj 58,8
                                                                                                            apr 62,5
                        Next publication of Services PMI: Wednesday May 4, 2011


          Jörgen Kennemar. Swedbank, Economic Research Department. Phone + 46-8-58597730
         Administration. Phone +46-8-5859 7740. Fax +46-5859 3540. e-mail ek.sekr@swedbank.se
                   Sebastian Bergfelt. Silf. Phone +46-73-944 6450, professionals@silf.se
Purchasing Managers’ Index – Services
                                                6 April 2011, continued


Silf / Swedbanks' Purchasing Mangers' Index Service Sector, seasonally adjusted
                            Components of PMI - Service                         Other indicies               Forecast

              Total index    Business      Delivery   New orders   Employment   Backlog of orders   Prices   Planned
                              activity      times                                                            business
                                                                                                              activity

  2005 nov       55,6          61,5         47,3        60,6          47,6            54,3          49,5       68,4
       dec       58,7          61,5         53,1        64,0          51,2            60,3          54,5       70,1
  2006 jan       59,3          64,8         53,5        59,9          57,2            60,6          45,9       68,6
       feb       59,0          66,0         52,7        58,8          56,9            54,9          48,5       62,8
       mar       62,7          70,1         54,0        64,2          59,3            64,1          49,1       65,4
       apr       57,3          60,8         53,4        59,7          52,5            52,7          52,6       67,0
       maj       60,1          64,1         51,9        63,6          57,3            57,9          53,8       71,7
       jun       66,2          72,3         57,2        70,3          60,5            63,2          58,9       70,0
       jul       62,9          65,3         59,9        63,4          61,8            61,8          50,6       66,7
       aug       64,6          69,3         54,7        66,7          64,9            60,9          54,9       70,0
       sep       61,8          68,7         52,5        65,5          55,8            63,1          56,0       66,9
       okt       61,2          67,3         55,0        61,9          58,5            56,0          54,6       67,3
       nov       63,9          65,4         61,6        63,1          65,7            60,1          55,8       72,9
       dec       67,5          71,7         59,8        68,6          68,0            58,8          53,4       75,5
  2007 jan       66,5          71,0         61,1        68,2          63,1            63,7          58,2       74,4
       feb       63,1          71,1         60,2        63,2          55,9            62,0          60,5       70,8
       mar       59,7          60,9         55,2        62,2          58,4            57,2          56,4       69,4
       apr       66,3          73,3         60,2        69,9          57,4            65,0          58,5       66,3
       maj       60,4          61,2         59,5        61,4          58,4            65,1          59,9       66,7
       jun       62,0          62,6         56,9        63,7          63,2            61,5          55,0       63,3
       jul       60,0          63,4         61,2        60,7          53,3            60,3          57,6       64,8
       aug       56,9          57,7         59,1        55,1          56,9            52,9          58,1       60,9
       sep       58,2          59,2         57,2        55,0          63,4            57,2          52,5       62,3
       okt       57,1          55,8         56,7        56,2          60,5            53,2          57,2       69,1
       nov       60,8          67,0         54,9        61,2          58,1            58,8          61,4       54,7
       dec       62,3          66,8         57,0        61,5          63,0            64,9          62,3       60,4
  2008 jan       58,1          60,2         52,8        57,2           §              56,6          63,6       68,0
       feb       56,7          57,6         54,3        59,1          53,9            59,2          61,5       64,9
       mar       54,8          54,3         52,8        54,3          58,4            53,0          59,7       72,1
       apr       52,9          53,5         49,4        49,9          60,7            53,5          56,7       61,5
       maj       60,2          67,6         50,5        56,9          66,4            54,7          56,2       63,9
       jun       51,9          56,1         49,3        46,6          58,6            44,9          63,5       63,4
       jul       53,0          57,2         45,4        49,0          62,3            45,1          65,5       59,6
       aug       50,5          52,7         49,6        45,7          56,7            49,0          57,0       60,7
       sep       52,1          56,4         47,6        46,9          60,3            38,8          57,8       56,5
       okt       42,4          44,0         45,7        35,1          49,8            44,3          57,9       48,2
       nov       43,9          43,9         49,7        37,1          50,1            35,9          53,6       42,8
       dec       38,3          37,7         39,9        37,1          39,6            37,2          45,4       40,5
  2009 jan       35,6          33,5         42,5        36,0          30,7            28,6          49,0       34,4
       feb       38,5          37,7         38,9        36,5          42,9            35,1          47,8       41,6
       mar       41,0          44,3         41,8        42,9          32,6            39,7          48,7       37,4
       apr       40,3          41,4         39,1        40,3          40,2            39,4          43,2       46,1
       maj       40,2          43,3         42,6        43,1          29,0            37,3          40,6       44,1
       juni      41,3          43,6         39,8        45,1          33,3            43,3          35,0       51,0
       juli      42,4          44,7         38,2        46,9          35,9            42,9          39,3       54,8
       aug       45,6          51,1         41,0        50,7          34,7            47,3          45,3       55,7
       sep       48,6          52,7         45,6        55,2          35,0            54,3          49,0       59,0
       okt       55,0          62,0         47,2        62,4          41,4            62,6          44,9       61,3
       nov       51,4          56,6         47,9        56,9          38,6            57,1          44,6       67,6
       dec       47,6          52,5         46,8        49,9          38,5            48,7          52,6       61,6
  2010 jan       55,5          59,6         50,9        59,7          47,5            56,6          49,0       62,2
       feb       61,3          64,4         54,1        68,1          52,6            61,2          46,7       76,0
       mar       61,7          65,4         58,7        64,2          55,8            60,9          56,4       72,5
       apr       62,6          66,5         61,1        64,7          55,3            61,5          61,0       73,7
       maj       58,9          59,4         59,5        60,0          55,7            57,9          62,4       69,1
       juni      59,1          61,4         61,7        59,8          52,4            60,4          61,7       68,6
       juli      62,8          66,2         61,1        65,6          55,2            63,3          62,3       71,2
       aug       63,9          66,1         62,1        67,9          55,9            63,7          61,8       70,4
       sep       61,0          59,6         64,4        63,5          54,8            60,2          63,3       73,6
       okt       63,7          65,1         61,7        67,2          58,0            61,4          60,2       76,5
       nov       64,2          65,0         58,8        67,7          62,3            64,0          65,8       78,0
       dec       66,0          69,6         64,6        65,9          62,9            60,9          63,8       77,2
  2011 jan       65,9          70,9         61,4        66,5          63,0            65,1          67,5       78,4
       feb       62,4          63,0         62,7        61,8          62,2            58,9          69,4       70,3
       mar       61,2          64,8         60,9        59,5          60,1            56,3          65,1       70,3


                                                            2 (4)
Purchasing Managers’ Index – Services
                                                    6 April 2011, continued


Silf / Swedbanks' Purchasing Mangers' Index Service Sector, original
                           Components of PMI - Service                            Other indicies                      Forecast

            Total index     Business     Delivery      New orders   Employment    Backlog of orders   Prices            Planned
                             activity     times                                                                        business
                                                                                                                          activity

 2005 nov           53,8          60,3          47,6        57,3           46,0               50,8             46,0        65,1
      dec           54,8          57,1          50,8        60,3           46,0               57,9             50,0        65,9
 2006 jan           53,7          57,0          50,8        53,9           52,3               54,0             46,9        65,6
      feb           57,5          63,8          52,6        57,8           54,3               56,9             49,1        63,2
      mar           63,6          72,6          51,2        66,7           59,5               66,7             48,8        65,5
      apr           59,6          63,6          52,7        63,6           54,6               55,6             53,6        70,9
      may           63,6          69,2          52,9        67,3           60,6               62,5             56,7        76,0
      jun           72,3          78,8          61,0        76,8           67,5               68,3             61,0        73,8
      jul           58,9          58,1          62,8        55,8           61,6               54,7             52,3        67,4
      aug           66,5          71,6          53,4        69,3           68,2               63,6             54,5        69,3
      sep           64,0          72,6          53,5        68,6           55,8               64,0             57,0        66,3
      okt           60,8          67,0          56,1        61,2           57,1               55,0             53,0        66,0
      nov           62,2          64,1          62,0        59,8           64,1               56,5             52,2        69,6
      dec           63,6          67,4          57,4        64,9           62,8               56,4             48,9        71,3
 2007 jan           60,9          63,3          58,3        62,2           58,2               57,1             59,2        71,4
      feb           61,7          68,9          60,0        62,2           53,3               64,0             61,1        71,1
      mar           60,7          63,4          52,4        64,6           58,5               59,8             56,1        69,5
      apr           68,7          76,2          59,5        73,8           59,5               67,9             59,5        70,2
      may           63,8          66,3          60,5        65,1           61,6               69,8             62,8        70,9
      jun           68,0          69,0          60,7        70,2           70,2               66,7             57,1        67,1
      jul           56,1          56,3          64,1        53,1           53,1               53,1             59,4        65,6
      aug           58,8          60,0          57,8        57,8           60,2               55,6             57,8        60,2
      sep           60,4          63,1          58,1        58,1           63,4               58,1             53,5        61,6
      oct           56,7          55,6          57,8        55,6           59,1               52,2             55,6        67,8
      nov           59,1          65,8          55,3        57,9           56,6               55,3             57,9        51,3
      dec           58,4          62,5          54,7        57,8           57,8               62,5             57,8        56,3
 2008 jan           52,5          52,4          50,0        51,2           57,3               50,0             64,6        65,0
      feb           55,3          55,4          54,2        58,1           51,4               61,1             62,2        65,3
      mar           55,8          56,8          50,0        56,8           58,6               55,6             59,5        72,2
      apr           55,3          56,4          48,7        53,8           62,8               56,4             57,7        65,4
      may           63,6          72,7          51,5        60,6           69,7               59,4             59,1        68,2
      jun           58,0          62,5          53,1        53,1           65,6               50,0             65,6        67,2
      jul           49,0          50,0          48,3        41,4           62,1               37,9             67,2        60,3
      aug           52,3          55,0          48,3        48,3           60,0               51,7             56,7        60,0
      sep           54,3          60,3          48,5        50,0           60,3               39,7             58,8        55,9
      oct           42,0          43,8          46,8        34,4           48,4               43,3             56,3        46,9
      nov           42,2          42,6          50,0        33,8           48,5               32,4             50,0        39,4
      dec           34,4          33,3          37,5        33,3           34,4               34,8             40,9        36,4
 2009 jan           30,0          25,7          39,7        30,0           25,7               22,1             50,0        31,4
      feb           37,1          35,5          38,7        35,5           40,3               37,1             48,4        41,9
      mar           41,9          46,8          39,1        45,3           32,8               42,2             48,4        37,5
      apr           42,7          44,2          38,5        44,2           42,3               42,3             44,2        50,0
      may           43,6          48,4          43,5        46,8           32,3               41,9             43,5        48,4
      jun           47,3          50,0          43,5        51,6           40,3               48,4             37,1        54,8
      jul           38,5          37,5          41,1        39,3           35,7               35,7             41,1        55,6
      aug           47,5          53,3          39,7        53,3           37,9               50,0             45,0        55,0
      sep           50,9          56,7          46,6        58,3           35,0               55,2             50,0        58,3
      oct           54,7          61,7          48,3        61,7           40,0               61,7             43,3        60,0
      nov           49,6          55,4          48,2        53,6           37,0               53,6             41,1        64,3
      dec           43,7          48,1          44,4        46,2           33,3               46,3             48,1        57,4
 2010 jan           49,9          51,9          48,1        53,7           42,6               50,0             50,0        59,3
      feb           59,8          62,2          53,9        67,1           50,0               63,2             47,4        76,3
      mar           62,7          67,9          56,0        66,7           56,0               63,4             56,1        72,6
      apr           65,0          69,4          60,4        68,7           57,5               64,4             61,9        77,6
      may           62,3          64,5          60,5        63,7           59,0               62,5             65,3        73,4
      jun           65,2          67,9          65,5        66,4           59,5               65,5             63,8        72,4
      jul           58,9          59,0          64,0        58,0           55,0               56,1             64,0        72,0
      aug           65,8          68,3          60,8        70,5           59,2               66,4             61,5        69,7
      sep           63,2          63,5          65,3        66,7           54,8               61,1             64,3        73,0
      oct           63,4          64,8          62,8        66,5           56,6               60,4             58,6        75,2
      nov           62,5          63,8          59,1        64,4           60,7               60,5             62,2        74,6
      dec           62,1          65,3          62,2        62,2           57,7               58,5             59,3        73,0
 2011 jan           60,3          63,1          58,6        60,5           58,1               58,5             68,5        75,4
      feb           60,9          60,8          62,5        60,8           59,6               60,8             70,0        70,6
      mar           62,2          67,3          58,1        61,9           60,3               58,8             64,8        70,4


                                                                      3 (4)
Purchasing Managers’ Index – Services
                                               6 April 2011, continued


Silf/Swedbank’s
Purchasing Managers’ Index – Services
- objectives and methodology
History                             Silf and Swedbank AB publ. made the first joint – internal – calculation of
                                    the “Purchasing Managers’ Index” for the service sector of the four
                                    indexes (PMI) during 2005. The model for PMI – Services is the U.S.
                                    based Non-Manufacturing Index and the Swedish PMI, which has been
                                    published since November 1994

Participants                        About 200 purchasing managers in the service sector.

Publication                         Third weekday of each month, 8:30 am.

Analysis Period                     Comparison with previous month.

Composition
of PMI – Services (%)               New orders (within the company)                              35
                                    Business activity (within the company)                       25
                                    Employment (within the company)                              20
                                    Suppliers’ Delivery Times                                    20


Other leading indicators
(not included in PMI – Services) Backlog of Orders
                                 Suppliers’ intermediate goods prices
                                 Planned business activity next six months

Objective                           Quick economic indicator
                                    Simple statistics
                                    Statistics with relatively short publication intervals
                                    Constant contact with a well-informed professional group

Calculation                         According to “diffusion index”. Positive changes are noted in percent for
                                    the four sub indexes. The percentage of unchanged replies, multiplied by
                                    0.5, is added to this figure. Then the different sub indexes are weighted as
                                    described above to reach the total index. The Purchasing Managers’
                                    Index – Services does not indicate activity levels but rather monthly
                                    changes in activity in the service sector.

“Break-even”                        The dividing line between growth and decline – in line with US praxis –
                                    has been drawn at a total index of 50. However, this boundary or “neutral
                                    growth zone” should not be applied excessively. Rather, “Break-even” at
                                    50 indicates a target value.


  We believe we have used reliable sources and procedures to generate and analyze the Purchasing Managers’ Index (PMI –
  Services). However, Swedbank AB (publ) and SILF (earlier Organisationen för Inköp och Logistik, /I&L/ – The Organization
  for Purchasing and Logistics) cannot guarantee the accuracy or completeness of the analyses and cannot be responsible for
  any errors or omissions in the basic data or processing thereof. The reader should base any decisions on other background
  material as well.
  Swedbank AB (publ), SILF. their employees, and other coworkers accept no liability whatsoever for any direct or
  consequential loss or injury of any kind arising from any errors or omissions in the analyses presented in the Purchasing
  Managers’ Index – Services.


                                                          4 (4)

Contenu connexe

Plus de Swedbank

Swedbank corporate presentation April 25 2017
Swedbank corporate presentation April 25 2017Swedbank corporate presentation April 25 2017
Swedbank corporate presentation April 25 2017Swedbank
 
Swedbank foretagspresentation 25 april 2017
Swedbank foretagspresentation 25 april 2017Swedbank foretagspresentation 25 april 2017
Swedbank foretagspresentation 25 april 2017Swedbank
 
Delårsrapport kv1 2017
Delårsrapport kv1 2017Delårsrapport kv1 2017
Delårsrapport kv1 2017Swedbank
 
Interim report q1 2017
Interim report q1 2017Interim report q1 2017
Interim report q1 2017Swedbank
 
Year end report 2016
Year end report 2016Year end report 2016
Year end report 2016Swedbank
 
Bokslutskommuniké 2016
Bokslutskommuniké 2016Bokslutskommuniké 2016
Bokslutskommuniké 2016Swedbank
 
Swedbank företagspresentation, 2 februari 2017
Swedbank företagspresentation, 2 februari 2017Swedbank företagspresentation, 2 februari 2017
Swedbank företagspresentation, 2 februari 2017Swedbank
 
Swedbank corporate presentation, February 2 2017
Swedbank corporate presentation, February 2 2017Swedbank corporate presentation, February 2 2017
Swedbank corporate presentation, February 2 2017Swedbank
 
Swedbank Corporate Presentation, October 25 2016
Swedbank Corporate Presentation, October 25 2016Swedbank Corporate Presentation, October 25 2016
Swedbank Corporate Presentation, October 25 2016Swedbank
 
Swedbank företagspresentation, 25 oktober 2016
Swedbank företagspresentation, 25 oktober 2016Swedbank företagspresentation, 25 oktober 2016
Swedbank företagspresentation, 25 oktober 2016Swedbank
 
Swedbank Corporate Presentation, June 30 2016
Swedbank Corporate Presentation, June 30 2016Swedbank Corporate Presentation, June 30 2016
Swedbank Corporate Presentation, June 30 2016Swedbank
 
Swedbank företagspresentation, 30 juni 2016
Swedbank företagspresentation, 30 juni 2016Swedbank företagspresentation, 30 juni 2016
Swedbank företagspresentation, 30 juni 2016Swedbank
 
Swedbank corporate presentation Q1, 2016
Swedbank corporate presentation Q1, 2016Swedbank corporate presentation Q1, 2016
Swedbank corporate presentation Q1, 2016Swedbank
 
Swedbank företagspresentation kvartal 1, 2016.
Swedbank företagspresentation kvartal 1, 2016.Swedbank företagspresentation kvartal 1, 2016.
Swedbank företagspresentation kvartal 1, 2016.Swedbank
 
Swedbank corporate presentation Q4, 2015
Swedbank corporate presentation Q4, 2015Swedbank corporate presentation Q4, 2015
Swedbank corporate presentation Q4, 2015Swedbank
 
Swedbank företagspresentation kvartal 4,2015
Swedbank företagspresentation kvartal 4,2015Swedbank företagspresentation kvartal 4,2015
Swedbank företagspresentation kvartal 4,2015Swedbank
 
Year end report 2015
Year end report 2015Year end report 2015
Year end report 2015Swedbank
 
Bokslutskommuniké 2015
Bokslutskommuniké 2015Bokslutskommuniké 2015
Bokslutskommuniké 2015Swedbank
 
Swedbank Företagspresentation, September 2015
Swedbank Företagspresentation, September 2015Swedbank Företagspresentation, September 2015
Swedbank Företagspresentation, September 2015Swedbank
 
Swedbank Corporate Presentation, September 2015
Swedbank Corporate Presentation, September 2015Swedbank Corporate Presentation, September 2015
Swedbank Corporate Presentation, September 2015Swedbank
 

Plus de Swedbank (20)

Swedbank corporate presentation April 25 2017
Swedbank corporate presentation April 25 2017Swedbank corporate presentation April 25 2017
Swedbank corporate presentation April 25 2017
 
Swedbank foretagspresentation 25 april 2017
Swedbank foretagspresentation 25 april 2017Swedbank foretagspresentation 25 april 2017
Swedbank foretagspresentation 25 april 2017
 
Delårsrapport kv1 2017
Delårsrapport kv1 2017Delårsrapport kv1 2017
Delårsrapport kv1 2017
 
Interim report q1 2017
Interim report q1 2017Interim report q1 2017
Interim report q1 2017
 
Year end report 2016
Year end report 2016Year end report 2016
Year end report 2016
 
Bokslutskommuniké 2016
Bokslutskommuniké 2016Bokslutskommuniké 2016
Bokslutskommuniké 2016
 
Swedbank företagspresentation, 2 februari 2017
Swedbank företagspresentation, 2 februari 2017Swedbank företagspresentation, 2 februari 2017
Swedbank företagspresentation, 2 februari 2017
 
Swedbank corporate presentation, February 2 2017
Swedbank corporate presentation, February 2 2017Swedbank corporate presentation, February 2 2017
Swedbank corporate presentation, February 2 2017
 
Swedbank Corporate Presentation, October 25 2016
Swedbank Corporate Presentation, October 25 2016Swedbank Corporate Presentation, October 25 2016
Swedbank Corporate Presentation, October 25 2016
 
Swedbank företagspresentation, 25 oktober 2016
Swedbank företagspresentation, 25 oktober 2016Swedbank företagspresentation, 25 oktober 2016
Swedbank företagspresentation, 25 oktober 2016
 
Swedbank Corporate Presentation, June 30 2016
Swedbank Corporate Presentation, June 30 2016Swedbank Corporate Presentation, June 30 2016
Swedbank Corporate Presentation, June 30 2016
 
Swedbank företagspresentation, 30 juni 2016
Swedbank företagspresentation, 30 juni 2016Swedbank företagspresentation, 30 juni 2016
Swedbank företagspresentation, 30 juni 2016
 
Swedbank corporate presentation Q1, 2016
Swedbank corporate presentation Q1, 2016Swedbank corporate presentation Q1, 2016
Swedbank corporate presentation Q1, 2016
 
Swedbank företagspresentation kvartal 1, 2016.
Swedbank företagspresentation kvartal 1, 2016.Swedbank företagspresentation kvartal 1, 2016.
Swedbank företagspresentation kvartal 1, 2016.
 
Swedbank corporate presentation Q4, 2015
Swedbank corporate presentation Q4, 2015Swedbank corporate presentation Q4, 2015
Swedbank corporate presentation Q4, 2015
 
Swedbank företagspresentation kvartal 4,2015
Swedbank företagspresentation kvartal 4,2015Swedbank företagspresentation kvartal 4,2015
Swedbank företagspresentation kvartal 4,2015
 
Year end report 2015
Year end report 2015Year end report 2015
Year end report 2015
 
Bokslutskommuniké 2015
Bokslutskommuniké 2015Bokslutskommuniké 2015
Bokslutskommuniké 2015
 
Swedbank Företagspresentation, September 2015
Swedbank Företagspresentation, September 2015Swedbank Företagspresentation, September 2015
Swedbank Företagspresentation, September 2015
 
Swedbank Corporate Presentation, September 2015
Swedbank Corporate Presentation, September 2015Swedbank Corporate Presentation, September 2015
Swedbank Corporate Presentation, September 2015
 

Purchasing Managers´ Index Services, March 2011

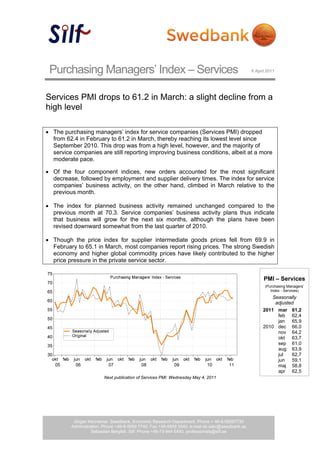
  • 1. Purchasing Managers’ Index – Services 6 April 2011 Services PMI drops to 61.2 in March: a slight decline from a high level • The purchasing managers’ index for service companies (Services PMI) dropped from 62.4 in February to 61.2 in March, thereby reaching its lowest level since September 2010. This drop was from a high level, however, and the majority of service companies are still reporting improving business conditions, albeit at a more moderate pace. • Of the four component indices, new orders accounted for the most significant decrease, followed by employment and supplier delivery times. The index for service companies’ business activity, on the other hand, climbed in March relative to the previous month. • The index for planned business activity remained unchanged compared to the previous month at 70.3. Service companies’ business activity plans thus indicate that business will grow for the next six months, although the plans have been revised downward somewhat from the last quarter of 2010. • Though the price index for supplier intermediate goods prices fell from 69.9 in February to 65.1 in March, most companies report rising prices. The strong Swedish economy and higher global commodity prices have likely contributed to the higher price pressure in the private service sector. PMI – Services (Purchasing Managers’ Index - Services) Seasonally adjusted 2011 mar 61,2 feb 62,4 jan 65,9 2010 dec 66,0 nov 64,2 okt 63,7 sep 61,0 aug 63,9 jul 62,7 jun 59,1 maj 58,8 apr 62,5 Next publication of Services PMI: Wednesday May 4, 2011 Jörgen Kennemar. Swedbank, Economic Research Department. Phone + 46-8-58597730 Administration. Phone +46-8-5859 7740. Fax +46-5859 3540. e-mail ek.sekr@swedbank.se Sebastian Bergfelt. Silf. Phone +46-73-944 6450, professionals@silf.se
  • 2. Purchasing Managers’ Index – Services 6 April 2011, continued Silf / Swedbanks' Purchasing Mangers' Index Service Sector, seasonally adjusted Components of PMI - Service Other indicies Forecast Total index Business Delivery New orders Employment Backlog of orders Prices Planned activity times business activity 2005 nov 55,6 61,5 47,3 60,6 47,6 54,3 49,5 68,4 dec 58,7 61,5 53,1 64,0 51,2 60,3 54,5 70,1 2006 jan 59,3 64,8 53,5 59,9 57,2 60,6 45,9 68,6 feb 59,0 66,0 52,7 58,8 56,9 54,9 48,5 62,8 mar 62,7 70,1 54,0 64,2 59,3 64,1 49,1 65,4 apr 57,3 60,8 53,4 59,7 52,5 52,7 52,6 67,0 maj 60,1 64,1 51,9 63,6 57,3 57,9 53,8 71,7 jun 66,2 72,3 57,2 70,3 60,5 63,2 58,9 70,0 jul 62,9 65,3 59,9 63,4 61,8 61,8 50,6 66,7 aug 64,6 69,3 54,7 66,7 64,9 60,9 54,9 70,0 sep 61,8 68,7 52,5 65,5 55,8 63,1 56,0 66,9 okt 61,2 67,3 55,0 61,9 58,5 56,0 54,6 67,3 nov 63,9 65,4 61,6 63,1 65,7 60,1 55,8 72,9 dec 67,5 71,7 59,8 68,6 68,0 58,8 53,4 75,5 2007 jan 66,5 71,0 61,1 68,2 63,1 63,7 58,2 74,4 feb 63,1 71,1 60,2 63,2 55,9 62,0 60,5 70,8 mar 59,7 60,9 55,2 62,2 58,4 57,2 56,4 69,4 apr 66,3 73,3 60,2 69,9 57,4 65,0 58,5 66,3 maj 60,4 61,2 59,5 61,4 58,4 65,1 59,9 66,7 jun 62,0 62,6 56,9 63,7 63,2 61,5 55,0 63,3 jul 60,0 63,4 61,2 60,7 53,3 60,3 57,6 64,8 aug 56,9 57,7 59,1 55,1 56,9 52,9 58,1 60,9 sep 58,2 59,2 57,2 55,0 63,4 57,2 52,5 62,3 okt 57,1 55,8 56,7 56,2 60,5 53,2 57,2 69,1 nov 60,8 67,0 54,9 61,2 58,1 58,8 61,4 54,7 dec 62,3 66,8 57,0 61,5 63,0 64,9 62,3 60,4 2008 jan 58,1 60,2 52,8 57,2 § 56,6 63,6 68,0 feb 56,7 57,6 54,3 59,1 53,9 59,2 61,5 64,9 mar 54,8 54,3 52,8 54,3 58,4 53,0 59,7 72,1 apr 52,9 53,5 49,4 49,9 60,7 53,5 56,7 61,5 maj 60,2 67,6 50,5 56,9 66,4 54,7 56,2 63,9 jun 51,9 56,1 49,3 46,6 58,6 44,9 63,5 63,4 jul 53,0 57,2 45,4 49,0 62,3 45,1 65,5 59,6 aug 50,5 52,7 49,6 45,7 56,7 49,0 57,0 60,7 sep 52,1 56,4 47,6 46,9 60,3 38,8 57,8 56,5 okt 42,4 44,0 45,7 35,1 49,8 44,3 57,9 48,2 nov 43,9 43,9 49,7 37,1 50,1 35,9 53,6 42,8 dec 38,3 37,7 39,9 37,1 39,6 37,2 45,4 40,5 2009 jan 35,6 33,5 42,5 36,0 30,7 28,6 49,0 34,4 feb 38,5 37,7 38,9 36,5 42,9 35,1 47,8 41,6 mar 41,0 44,3 41,8 42,9 32,6 39,7 48,7 37,4 apr 40,3 41,4 39,1 40,3 40,2 39,4 43,2 46,1 maj 40,2 43,3 42,6 43,1 29,0 37,3 40,6 44,1 juni 41,3 43,6 39,8 45,1 33,3 43,3 35,0 51,0 juli 42,4 44,7 38,2 46,9 35,9 42,9 39,3 54,8 aug 45,6 51,1 41,0 50,7 34,7 47,3 45,3 55,7 sep 48,6 52,7 45,6 55,2 35,0 54,3 49,0 59,0 okt 55,0 62,0 47,2 62,4 41,4 62,6 44,9 61,3 nov 51,4 56,6 47,9 56,9 38,6 57,1 44,6 67,6 dec 47,6 52,5 46,8 49,9 38,5 48,7 52,6 61,6 2010 jan 55,5 59,6 50,9 59,7 47,5 56,6 49,0 62,2 feb 61,3 64,4 54,1 68,1 52,6 61,2 46,7 76,0 mar 61,7 65,4 58,7 64,2 55,8 60,9 56,4 72,5 apr 62,6 66,5 61,1 64,7 55,3 61,5 61,0 73,7 maj 58,9 59,4 59,5 60,0 55,7 57,9 62,4 69,1 juni 59,1 61,4 61,7 59,8 52,4 60,4 61,7 68,6 juli 62,8 66,2 61,1 65,6 55,2 63,3 62,3 71,2 aug 63,9 66,1 62,1 67,9 55,9 63,7 61,8 70,4 sep 61,0 59,6 64,4 63,5 54,8 60,2 63,3 73,6 okt 63,7 65,1 61,7 67,2 58,0 61,4 60,2 76,5 nov 64,2 65,0 58,8 67,7 62,3 64,0 65,8 78,0 dec 66,0 69,6 64,6 65,9 62,9 60,9 63,8 77,2 2011 jan 65,9 70,9 61,4 66,5 63,0 65,1 67,5 78,4 feb 62,4 63,0 62,7 61,8 62,2 58,9 69,4 70,3 mar 61,2 64,8 60,9 59,5 60,1 56,3 65,1 70,3 2 (4)
  • 3. Purchasing Managers’ Index – Services 6 April 2011, continued Silf / Swedbanks' Purchasing Mangers' Index Service Sector, original Components of PMI - Service Other indicies Forecast Total index Business Delivery New orders Employment Backlog of orders Prices Planned activity times business activity 2005 nov 53,8 60,3 47,6 57,3 46,0 50,8 46,0 65,1 dec 54,8 57,1 50,8 60,3 46,0 57,9 50,0 65,9 2006 jan 53,7 57,0 50,8 53,9 52,3 54,0 46,9 65,6 feb 57,5 63,8 52,6 57,8 54,3 56,9 49,1 63,2 mar 63,6 72,6 51,2 66,7 59,5 66,7 48,8 65,5 apr 59,6 63,6 52,7 63,6 54,6 55,6 53,6 70,9 may 63,6 69,2 52,9 67,3 60,6 62,5 56,7 76,0 jun 72,3 78,8 61,0 76,8 67,5 68,3 61,0 73,8 jul 58,9 58,1 62,8 55,8 61,6 54,7 52,3 67,4 aug 66,5 71,6 53,4 69,3 68,2 63,6 54,5 69,3 sep 64,0 72,6 53,5 68,6 55,8 64,0 57,0 66,3 okt 60,8 67,0 56,1 61,2 57,1 55,0 53,0 66,0 nov 62,2 64,1 62,0 59,8 64,1 56,5 52,2 69,6 dec 63,6 67,4 57,4 64,9 62,8 56,4 48,9 71,3 2007 jan 60,9 63,3 58,3 62,2 58,2 57,1 59,2 71,4 feb 61,7 68,9 60,0 62,2 53,3 64,0 61,1 71,1 mar 60,7 63,4 52,4 64,6 58,5 59,8 56,1 69,5 apr 68,7 76,2 59,5 73,8 59,5 67,9 59,5 70,2 may 63,8 66,3 60,5 65,1 61,6 69,8 62,8 70,9 jun 68,0 69,0 60,7 70,2 70,2 66,7 57,1 67,1 jul 56,1 56,3 64,1 53,1 53,1 53,1 59,4 65,6 aug 58,8 60,0 57,8 57,8 60,2 55,6 57,8 60,2 sep 60,4 63,1 58,1 58,1 63,4 58,1 53,5 61,6 oct 56,7 55,6 57,8 55,6 59,1 52,2 55,6 67,8 nov 59,1 65,8 55,3 57,9 56,6 55,3 57,9 51,3 dec 58,4 62,5 54,7 57,8 57,8 62,5 57,8 56,3 2008 jan 52,5 52,4 50,0 51,2 57,3 50,0 64,6 65,0 feb 55,3 55,4 54,2 58,1 51,4 61,1 62,2 65,3 mar 55,8 56,8 50,0 56,8 58,6 55,6 59,5 72,2 apr 55,3 56,4 48,7 53,8 62,8 56,4 57,7 65,4 may 63,6 72,7 51,5 60,6 69,7 59,4 59,1 68,2 jun 58,0 62,5 53,1 53,1 65,6 50,0 65,6 67,2 jul 49,0 50,0 48,3 41,4 62,1 37,9 67,2 60,3 aug 52,3 55,0 48,3 48,3 60,0 51,7 56,7 60,0 sep 54,3 60,3 48,5 50,0 60,3 39,7 58,8 55,9 oct 42,0 43,8 46,8 34,4 48,4 43,3 56,3 46,9 nov 42,2 42,6 50,0 33,8 48,5 32,4 50,0 39,4 dec 34,4 33,3 37,5 33,3 34,4 34,8 40,9 36,4 2009 jan 30,0 25,7 39,7 30,0 25,7 22,1 50,0 31,4 feb 37,1 35,5 38,7 35,5 40,3 37,1 48,4 41,9 mar 41,9 46,8 39,1 45,3 32,8 42,2 48,4 37,5 apr 42,7 44,2 38,5 44,2 42,3 42,3 44,2 50,0 may 43,6 48,4 43,5 46,8 32,3 41,9 43,5 48,4 jun 47,3 50,0 43,5 51,6 40,3 48,4 37,1 54,8 jul 38,5 37,5 41,1 39,3 35,7 35,7 41,1 55,6 aug 47,5 53,3 39,7 53,3 37,9 50,0 45,0 55,0 sep 50,9 56,7 46,6 58,3 35,0 55,2 50,0 58,3 oct 54,7 61,7 48,3 61,7 40,0 61,7 43,3 60,0 nov 49,6 55,4 48,2 53,6 37,0 53,6 41,1 64,3 dec 43,7 48,1 44,4 46,2 33,3 46,3 48,1 57,4 2010 jan 49,9 51,9 48,1 53,7 42,6 50,0 50,0 59,3 feb 59,8 62,2 53,9 67,1 50,0 63,2 47,4 76,3 mar 62,7 67,9 56,0 66,7 56,0 63,4 56,1 72,6 apr 65,0 69,4 60,4 68,7 57,5 64,4 61,9 77,6 may 62,3 64,5 60,5 63,7 59,0 62,5 65,3 73,4 jun 65,2 67,9 65,5 66,4 59,5 65,5 63,8 72,4 jul 58,9 59,0 64,0 58,0 55,0 56,1 64,0 72,0 aug 65,8 68,3 60,8 70,5 59,2 66,4 61,5 69,7 sep 63,2 63,5 65,3 66,7 54,8 61,1 64,3 73,0 oct 63,4 64,8 62,8 66,5 56,6 60,4 58,6 75,2 nov 62,5 63,8 59,1 64,4 60,7 60,5 62,2 74,6 dec 62,1 65,3 62,2 62,2 57,7 58,5 59,3 73,0 2011 jan 60,3 63,1 58,6 60,5 58,1 58,5 68,5 75,4 feb 60,9 60,8 62,5 60,8 59,6 60,8 70,0 70,6 mar 62,2 67,3 58,1 61,9 60,3 58,8 64,8 70,4 3 (4)
  • 4. Purchasing Managers’ Index – Services 6 April 2011, continued Silf/Swedbank’s Purchasing Managers’ Index – Services - objectives and methodology History Silf and Swedbank AB publ. made the first joint – internal – calculation of the “Purchasing Managers’ Index” for the service sector of the four indexes (PMI) during 2005. The model for PMI – Services is the U.S. based Non-Manufacturing Index and the Swedish PMI, which has been published since November 1994 Participants About 200 purchasing managers in the service sector. Publication Third weekday of each month, 8:30 am. Analysis Period Comparison with previous month. Composition of PMI – Services (%) New orders (within the company) 35 Business activity (within the company) 25 Employment (within the company) 20 Suppliers’ Delivery Times 20 Other leading indicators (not included in PMI – Services) Backlog of Orders Suppliers’ intermediate goods prices Planned business activity next six months Objective Quick economic indicator Simple statistics Statistics with relatively short publication intervals Constant contact with a well-informed professional group Calculation According to “diffusion index”. Positive changes are noted in percent for the four sub indexes. The percentage of unchanged replies, multiplied by 0.5, is added to this figure. Then the different sub indexes are weighted as described above to reach the total index. The Purchasing Managers’ Index – Services does not indicate activity levels but rather monthly changes in activity in the service sector. “Break-even” The dividing line between growth and decline – in line with US praxis – has been drawn at a total index of 50. However, this boundary or “neutral growth zone” should not be applied excessively. Rather, “Break-even” at 50 indicates a target value. We believe we have used reliable sources and procedures to generate and analyze the Purchasing Managers’ Index (PMI – Services). However, Swedbank AB (publ) and SILF (earlier Organisationen för Inköp och Logistik, /I&L/ – The Organization for Purchasing and Logistics) cannot guarantee the accuracy or completeness of the analyses and cannot be responsible for any errors or omissions in the basic data or processing thereof. The reader should base any decisions on other background material as well. Swedbank AB (publ), SILF. their employees, and other coworkers accept no liability whatsoever for any direct or consequential loss or injury of any kind arising from any errors or omissions in the analyses presented in the Purchasing Managers’ Index – Services. 4 (4)