08448380779 Call Girls In Friends Colony Women Seeking Men
Physics HL IRP
1. Kittitorn Kiatpipattanakun
Physics HL Period 6
How far is safe?
Following Japan’s tsunami, crisis broke out at Japan’s Fukushima Daiichi nuclear power
plant. The gamma radiation contaminated the areas around the plant, making it uninhabitable for
another several decades. Several authoritative sources ordered evacuations at certain distances to
the reactor, but the question is, how far is safe? In this research, the relationship between the
radiation intensity and its distance to the receiver will be investigated. For safety concerns, instead
of using a gamma ray emitter, a beta emitter will be substituted.
Before going into the theory, the way in which the radiation is detected must first be
understood. The Geiger counter, named after the Geiger-Marsden experiment or commonly known
as the gold foil experiment, is a type of particle detector that is use nowadays to measure radiation,
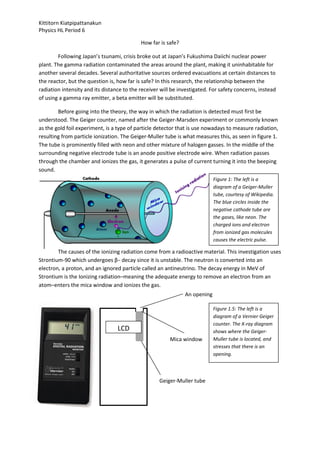
resulting from particle ionization. The Geiger-Muller tube is what measures this, as seen in figure 1.
The tube is prominently filled with neon and other mixture of halogen gasses. In the middle of the
surrounding negative electrode tube is an anode positive electrode wire. When radiation passes
through the chamber and ionizes the gas, it generates a pulse of current turning it into the beeping
sound.
Figure 1: The left is a
diagram of a Geiger-Muller
tube, courtesy of Wikipedia.
The blue circles inside the
negative cathode tube are
the gases, like neon. The
charged ions and electron
from ionized gas molecules
causes the electric pulse.
The causes of the ionizing radiation come from a radioactive material. This investigation uses
Strontium-90 which undergoes β− decay since it is unstable. The neutron is converted into an
electron, a proton, and an ignored particle called an antineutrino. The decay energy in MeV of
Strontium is the Ionizing radiation–meaning the adequate energy to remove an electron from an
atom–enters the mica window and ionizes the gas.
An opening
Figure 1.5: The left is a
diagram of a Vernier Geiger
counter. The X-ray diagram
LCD shows where the Geiger-
Mica window Muller tube is located, and
stresses that there is an
opening.
Geiger-Muller tube
2. Kittitorn Kiatpipattanakun
Physics HL Period 6
From several trusted sources, the relationship between the radiation intensity and distance
would have an inverse squared relationship showed in equation 1. The derivation to form this
equation can be found here.
Equation 1
Where is the radiation intensity in counts per minute, and is the distance between the plastic
cover of the beta material and the Geiger counter in centimeter. To show a linear relationship, the
equation 2 below is derived.
√ Equation 2
Thus, from equation 2, the square root of the radiation intensity is expected to increase linearly to
the inverse of distance.
Works cited:
http://imagine.gsfc.nasa.gov/YBA/M31-velocity/1overR2-more.html
http://www.lndinc.com/products/711/
http://www.scientrific.com.au/product.php?p=4015
http://www.nytimes.com/interactive/2011/03/16/world/asia/japan-nuclear-evaculation-zone.html
http://www.vernier.com/products/sensors/drm-btd/
3. Kittitorn Kiatpipattanakun
Physics HL Period 6
Design:
Research Question: How does the distance between the Geiger counter and the radioactive
material affects the intensity of the radiation.
Variables:
The independent variable is the distance between the Geiger counter’s sensor and the beta
material source emitter, the sufficiency of this measurement will further be explained after the
procedure writing. The dependent variable is the counts per unit time received by the Geiger
counter, which is the intensity of the radiation. The controlled variable is the type of beta source,
which is Strontium-90, its position is also controlled by not moving it at all in the investigation. The
same type of Geiger counter was used throughout, a Vernier Digital Radiation Monitor, with its
settings unchanged at CPM and audio on. The angle of the sensor to the beta source was
unchanged, only the distance to it was changed. The experiment was carried at the same place in
the corner of the room without moving anywhere else, so the background radiation was controlled
to be at about 4 ± 1 counts per 10 seconds or 24± 6 counts per minute (cpm), from table 1. The
temperature was controlled by turning on the air conditioner at 27± C without turning it off,
however, temperature would not be such an important factor that would affect the radiation.
Procedure:
A safe area where few people pass by is firstly found. A metal support stand with several
extension clamps is use to hold the Geiger counter. The counter’s sensor is face downward and the
LCD screen facing towards the experimenter. A ruler is attached to the metal stand, where at 0 cm,
the top end tip of the clamp screw is at 0 cm mark, and when the Geiger counter touches the beta
emitter. All of this can be seen in figure 2 down below. The Geiger counter is connected to the
computer, and to the Vernier™ Logger Pro program. Then a lead apron shield is setup between the
experimenter and the beta source so it reasonably protects the emitting radiation as seen in figure 3
below. A beta source, in this case, Strontium-90 is place directly perpendicular to the mica window,
where the beta particle enters the Geiger-Muller tube, as seen in figure 2. When ready, the radiation
counts were collected for a period of 180 seconds, at 10 seconds per one sample. This would give
out 18 samples, or can be said, 18 trials. Then for each 60 seconds, the graph is analyze with
statistics, the whole graph is also analyze with statistic to see the mean radiation counts per 10
second. This is repeated for several times for each distance away, the distances in this investigation
range from 0.0 ± 0.1 cm to 27.0 ± 0.1 cm.
4. Kittitorn Kiatpipattanakun
Physics HL Period 6
Figure 2: The left photo shows the
setup of the Geiger counter
perpendicular to the beta emitter.
The beta material is directly below a
circular opening in the Geiger
counter, where the beta particle will
enter through this opening and into
the Geiger-Muller tube where it
would detect the beta, alpha, or
gamma radiation. The tape as seen
in the photo was purposely taped
after 19 cm where this would be the
highest distance from collecting the
beta material’s radiation counts.
Wire connecting to computer
Tape at 19 cm
Figure 3: The above photo is the setup
for lead shielding, hanged by two
The position of the extension clamps from a meter stick.
detector’s opening The distance was about 25 ± 1 cm away
called the alpha between the lead shield and the beta
window, or the emitter.
mica window
5. Kittitorn Kiatpipattanakun
Physics HL Period 6
Data Collecting and Processing:
Beta material: Strontium-90 0.1 µC beta source
Instrument: Vernier Radiation Digital Monitor; LND 712 halogen-quenched GM tubed
Diameter of beta material’s plastic cover: 2.0 ± 0.1 cm
Table of raw data and its average
Seconds 0-60 61-121 121-180
Measured Average counts
Distance ± Raw Radiation Counts for each time interval per 10 second
0.1 cm
0.0 742 716 750 736 ± 20
1.0 280 288 285 285 ± 4
2.0 139 144 143 142 ± 3
3.0 77 76 77 77 ± 1
4.0 51 55 48 51 ± 4
5.0 42 41 35 39 ± 7
6.0 29 28 26 28 ± 2
7.0 22 20 19 20 ± 2
9.0 13 16 15 15 ± 2
11.0 9 8 11 9±2
13.0 9 8 10 9±1
15.0 8 7 8 8±1
17.0 7 6 6 6±1
19.0 5 5 6 6±1
27.0 4 4 3 4±1
Table 1: This table shows the selected raw data collected. The selected data are from taking the radiation count
for every 20 seconds, instead of 10.Since the mean would be the same nevertheless. The raw radiation count is
the number of counts per 10 seconds. The distance is between the plastic cover of the beta material and the
plastic surrounding of the Geiger counter, which leaves some distances to the mica window where the beta
particle enters. The last distance (27.0±0.1cm) is the background radiation. Sample calculations will be shown.
Graph 1: This is a sample raw data graph at 1.0±0.1 cm distances apart, where the statistic is analyzed.
6. Kittitorn Kiatpipattanakun
Physics HL Period 6
Table of actual distance and the average CPM
Measured distance (± 0.1 cm) Real Distance (± 0.5 cm) Average counts per minute (CPM)
0.0 1.5 4400 ± 100
1.0 2.5 1680 ± 20
2.0 3.5 840 ± 20
3.0 4.5 438 ± 6
4.0 5.5 280 ± 20
5.0 6.5 210 ± 40
6.0 7.5 140 ± 10
7.0 8.5 100 ± 10
9.0 10.5 70 ± 10
11.0 12.5 30 ± 10
13.0 14.5 30 ± 6
15.0 16.5 24 ± 6
17.0 18.5 12 ± 6
19.0 20.5 12 ± 6
Table 2: This table shows the actual distance between the approximated position of the beta material inside
the plastic cover, and the approximated distance inside the Geiger-Muller tube to where the gas actually
ionizes to create an electrical pulse. This will be extensively explained and discuss later in the evaluation
section. The second column is the actual average counts per minute, where it is subtracted by the background
radiation of 24 counts per minute. Sample calculations will be shown after graph 4.
Graph 2: This graph shows the inverse square relationship between the average counts per minute and the real
distance between the Geiger counter and the beta material. The constant ‘A’ is about 9900 ± 80.
7. Kittitorn Kiatpipattanakun
Physics HL Period 6
Table of the square root CPM and its inverse actual distance
Measured distance (± 0.1 Square root Average CPM
1 / real distance (± 0.01 cm)
cm) (CPM)
0.0 0.67 66.2 ± 0.8
1.0 0.40 41.0 ± 0.3
2.0 0.29 29.0 ± 0.3
3.0 0.22 20.9 ± 0.1
4.0 0.18 16.8 ± 0.7
5.0 0.15 15.0 ± 1.0
6.0 0.13 12.0 ± 0.5
7.0 0.12 9.8 ± 0.6
9.0 0.10 8.1 ± 0.7
11.0 0.08 6.0 ± 1.0
13.0 0.07 5.5 ± 0.6
15.0 0.06 4.9 ± 0.6
17.0 0.05 3.5 ± 0.9
19.0 0.05 3.5 ± 0.9
Table 3: This graph shows the square root of the counts per minute to the inverse actual distance, mainly to
show a linearly relationship. The uncertainty for the square root of CPM is individually calculated. A sample
calculation will be shown after graph 4.
Graph 3: This graph shows the data from table 3, where the highest square root counts per minute is the 0
distance between the Geiger counter and the beta material. The slope is 103 and the y-intercept is -1.77.
However, it is invalid when the inverse of a distance of 0 is calculated, and the square root of counts per minute
cannot be less than 0 to a negative number.
8. Kittitorn Kiatpipattanakun
Physics HL Period 6
Graph 4: This graph shows the high-low fit of graph 3. The sample calculation will be shown below.
Sample Calculations
1. Determining uncertainty for average counts per 10 second for 0.0±0.1 cm distance
a. Highest: 750; Lowest: 716
b. (750 – 716)/2 = 17 = rounded to 20, Thus, 736 ± 20 counts per 10 seconds
2. Real distance (explain in evaluation section)
a. Approximated distance of actual beta material (Strontium-90) to the plastic cover’s
skin: 0.2 cm
b. Approximated distance of the actual ionized gas position in the Geiger-Muller tube
to the opening of the tube 1.3 cm
c. Total distance apart = 1.3 + 0.2 = 1.5 cm
d. Real distance at 0 cm = 0 + 1.5 = 1.5 cm
3. Average counts per minute
a. Average counts per 10 seconds: 736 ± 20
b. Average counts per minute to significant figures = (736 ± 20) * 6 = 4400 ± 100
4. Square root of average CPM for distance of 0.0 ± 0.1 cm
a. √
b. Uncertainty: (√ -√ )/2 = 0.75 = 0.8
c. Square root average CPM = cm
5. Uncertainty for inverse real distance at measured distance 5.0 ± 0.1 cm
a. Real distance: 6.5 ± 0.5 cm
b. Uncertainty: ( )/2 = 0.011 = 0.01
c. Inverse real distance = 1/6.5 = 0.15 ± 0.01 cm
6. Uncertainty for slope and y-intercept from graph 4
a. Slope & intercept from graph 3 respectively: 103 , -1.77
b. Slope: (109.1 – 95.0) / 2 = 14 = ± 10
c. y-intercept: (1.6 + 4.1) / 2 = 2.9 = ± 3
9. Kittitorn Kiatpipattanakun
Physics HL Period 6
Conclusion:
From graph 2, it is clear that the results have support the hypothesis, in which it turned out
to be an inverse square relationship. But to model this investigation’s results to be a linear
relationship, the final equation is found, with respect to significant figures:
√ Equation 3
Where is the radiation intensity without the background radiation in counts per minute, and is
the distance apart from the beta source to the detector’s opening. Equation 3 is a linear equation
where when the higher the distances apart, the square root radiation intensity decreases.
The level of confidence in this investigation is medium. The qualities of the data as seen in
graph 2, the average CPM’s error bar is relatively acceptable, and the real distance error’s bar is 0.5
cm. The real distance is hard to determine because the exact position to where the beta material
really is inside the plastic cover is not stated, we must assume it ourselves. Also, the exact point in
the Geiger-Muller tube, where the radiation ionizes, is very hard to determine. Since the tube is
about three centimeters, the reaction can occur anywhere. It is assumed that most of the radiation
entering the tube starts reacting in the first half section. Further explanation of this will be discuss in
the evaluation. The validity of this relationship shown in equation 1 can be applicable universally.
Any type of radiation whether it’s REMS or the sun’s intensity can be used with equation 1.
However, equation 3 will only be applicable to this investigation only, since the distance will also
depend on the materials and instruments given. The setting experiment of this research may also
limit the equation 3. Nevertheless, further research must be done to confirm this relationship.
Evaluation:
One of the main causes of error in this experiment is determining the actual distance. The
actual distance between the beta material and the plastic cover skin is unknown, but it is
approximated to be 2 mm since the height of the plastic is 5 mm and the beta material assume to
have 1 mm thickness.
Distance between beta material and skin
of the plastic cover
Beta material Figure 4.1: Sr-90 sample as beta source
The other approximated value is where the radiation actually ionizes the gas in the Geiger-Muller
tube to generate an electrical pulse. So it is assumed that most of the reaction would occur about 1
cm inside from the mica window.
Approximated distance where most
reaction occur (about 1 centimeter)
Figure 4.2: LND 712 Neon filled Geiger-Muller tube
From all of these approximations, the data may be distorted from actual values. Some ways to
resolve this issue is to directly contact the material supplier and ask for specific dimension. For the
10. Kittitorn Kiatpipattanakun
Physics HL Period 6
Geiger-Muller tube, a shorter and more precise instrument may be implemented if possible to find
one.
The second cause of error may have come from the Geiger counter itself, which can be seen
in graph 1, the raw data. The standard deviation is up to 16 counts per 10 seconds. Even though the
Vernier Geiger counter is rated 1000 counts per minute for Cesium 137 laboratory standard,
different detectors should be considered to confirm the validity.
The last source of error that may affect the distance is the clamp. During the data collection,
the extension clamp might slip by about a millimeter. Since the arm is protected with a fabric like
texture. Moreover, the extension arms might bend a tiny bit due to the weight of the Geiger
counter. To fix this, a pulley mechanism should be considered, or using some kind of height
adjustment bar that have a height lock. In any method, the counter should have a fixed position
where it will not slip.