SlideShare une entreprise Scribd logo
1  sur  27
CHAPTER 5
RESULTS AND DATA ANALYSIS
Results include the descriptive analysis and hypotheses testing. To fulfill the aims of this
study the following research objectives are set:
-To study and analyse the role played by SMEs in the economic development of the UAE;
-To explore and analyse the steps taken by the UAE Government and Banks to support the
development of the UAE SME sector; and
-To investigate the challenges faced by UAE Based SMEs in accessing capital from banks.
5.1 Descriptive Analysis
The research data was computed and analyzed. Frequency distribution for each question was
developed with proper tables and graphs. Interpretation gives clear idea about the final results.
The proportions of responses indicating the degree of agreement to the questions related to the
role played by SME’s and various challenges faced by UAE government in accessing the capital
from banks.
5.1.1 The mission of the SME’s makes me feel that my job is important.
Table 5.1: Job Importance
Frequency Percent Valid Percent
Cumulative
Percent
Valid strongly disagree 1 1.3 1.3 1.3
Disagree 2 2.7 2.7 4.0
moderately agree 10 13.3 13.3 17.3
Agree 41 54.7 54.7 72.0
strongly agree 21 28.0 28.0 100.0
Total 75 100.0 100.0
Figure 5.1: Bar chart for Job Importance
Interpretation:
The number of the total employees who responded were n= 75. The question was asked from the
employees that whether the mission of the bank makes them feel that their job is important.
54.7% employees agree that the mission of the bank makes them feel that their job is important.
28% strongly agree with the statement. 13.3% moderately agree with the statement. 2.27%
1.3 2.7
13.3
54.7
28
0
10
20
30
40
50
60
strongly
disagree
disagree moderately
agree
agree strongly
agree
Percent
Job Importance
disagree with this statement and 1.13% employees strongly disagree with the statement. This is
also represented in bar chart format.
5.1.2 I understand the SME’s objectives and try to achieve them.
Table 5.2: Understand and achieve bank's objectives
Frequency Percent Valid Percent
Cumulative
Percent
Valid strongly disagree 1 1.3 1.3 1.3
disagree 2 2.7 2.7 4.0
moderately agree 11 14.7 14.7 18.7
agree 37 49.3 49.3 68.0
strongly agree 24 32.0 32.0 100.0
Total 75 100.0 100.0
Figure 5.2: Bar chart for Understand and achieve bank's objectives
Interpretation:
The question was asked from the employees that whether they understand the bank’s objectives
and try to achieve them. 49.3% employees agree that they have an understanding of the bank’s
1.3 2.7
14.7
49.3
32
0
10
20
30
40
50
60
strongly
disagree
disagree moderately
agree
agree strongly
agree
Percent
Understand and achieve bank's objectives
objectives and they try to achieve them. 32% strongly agree with the statement. 14.7%
moderately agree with the statement. 2.27% disagree with this statement and 1.13% employees
strongly disagree with the statement. This is also represented in bar chart format.
5.1.3 UAE government views SME’s as an asset.
Table 5.3: Employee an asset
Frequency Percent Valid Percent
Cumulative
Percent
Valid disagree 3 4.0 4.0 4.0
moderately agree 11 14.7 14.7 18.7
agree 42 56.0 56.0 74.7
strongly agree 19 25.3 25.3 100.0
Total 75 100.0 100.0
Figure 5.3: Bar chart for Employee an asset
Interpretation:
The question was asked from the employees that whether the oUAE government views them as
an asset. 56% employees agree that the organization views them as an asset. 25.3% strongly
agree with the statement. 14.7% moderately agree with the statement and 4% employees disagree
with the statement. This is also represented in bar chart format.
4
14.7
56
25.3
0
10
20
30
40
50
60
disagree moderately
agree
agree strongly agree
Percent
Employee an asset
5.1.4 The impact of SME’s contribution in economy is large.
Table 5.4: Contribution Impact in Department
Frequency Percent Valid Percent
Cumulative
Percent
Valid strongly disagree 1 1.3 1.3 1.3
disagree 8 10.7 10.7 12.0
moderately agree 22 29.3 29.3 41.3
agree 29 38.7 38.7 80.0
strongly agree 15 20.0 20.0 100.0
Total 75 100.0 100.0
Figure 5.4: Bar chart for Contribution Impact in Department
Interpretation:
The question was asked from the employees that the impact of their contribution in the economic
is large. 38.7% employees agree that the impact of their contribution in their department is large.
1.3
10.7
29.3
38.7
20
0
5
10
15
20
25
30
35
40
45
strongly
disagree
disagree moderately
agree
agree strongly
agree
Percent
Contribution impact in department
20% strongly agree with the statement. 29.3% moderately agree with the statement and 10.7%
employees disagree with the statement and 1.3% employees strongly disagree with this
statement. This is also represented in bar chart format.
5.1.5 UAE government have a great deal of control over what happens in SME’s callanges.
Table 5.5: Control over the working in the department
Frequency Percent Valid Percent
Cumulative
Percent
Valid strongly disagree 4 5.3 5.3 5.3
disagree 18 24.0 24.0 29.3
moderately agree 21 28.0 28.0 57.3
agree 19 25.3 25.3 82.7
strongly agree 13 17.3 17.3 100.0
Total 75 100.0 100.0
Figure 5.5: Bar chart for Control over the working in the department
Interpretation:
5.3
24
28
25.3
17.3
0
5
10
15
20
25
30
strongly
disagree
disagree moderately
agree
agree strongly
agree
Percent
Control over the working in the department
The question was asked from the employees that they have a great deal of control over what
happens in SME’s challenges. 25.3% employees agree that they have a great deal of control over
what happens in their department. 17.3% strongly agree with the statement. 28% moderately
agree with the statement and 24% employees disagree with the statement and 5.3% employees
strongly disagree with this statement. This is also represented in bar chart format.
5.1.6 SME’s have significant autonomy in handling the chanllenges with the support of
UAE government.
Table 5.6 Autonomy in performing job
Frequency Percent Valid Percent
Cumulative
Percent
Valid Disagree 10 13.3 13.3 13.3
moderately agree 12 16.0 16.0 29.3
Agree 34 45.3 45.3 74.7
strongly agree 19 25.3 25.3 100.0
Total 75 100.0 100.0
Figure 5.6: Bar chart for Autonomy in handling the challenges
Interpretation:
13.3
16
45.3
25.3
0
5
10
15
20
25
30
35
40
45
50
disagree moderately
agree
agree strongly agree
Percent
The question was asked from the SME’s that they have a significant autonomy in determining
how they do their job. 45.3% employees agree that they have a significant autonomy in
determining how they do their job. 25.3% strongly agree with the statement. 16% moderately
agree with the statement and 13.3% employees disagree with the statement. This is also
represented in bar chart format.
5.1.7 SME’s are allowed to be creative and innovative while dealing with problems at work.
Table 5.7: Creative and Innovative employees
Frequency Percent Valid Percent
Cumulative
Percent
Valid strongly disagree 1 1.3 1.3 1.3
disagree 1 1.3 1.3 2.7
moderately agree 4 5.3 5.3 8.0
agree 40 53.3 53.3 61.3
strongly agree 29 38.7 38.7 100.0
Total 75 100.0 100.0
1.3 1.3
5.3
53.3
38.7
0
10
20
30
40
50
60
strongly
disagree
disagree moderately
agree
agree strongly
agree
Percent
Creative and innovative while dealing with work problems
Figure 5.7: Bar chart for Creative and Innovative employees
Interpretation:
The question was asked from the employees that whether they are allowed to be creative and
innovative while dealing with problems at work 53.3% employees agree that they are allowed to
be creative and innovative while dealing with problems at work. 38.7% strongly agree with the
statement. 5.3% moderately agree with the statement, 1.3% employees disagree with the
statement and 1.3% strongly disagree with this statement. This is also represented in bar chart
format.
5.1.9 SME’s have to follow procedures closely while handling the heinous challenges for the
economy.
Table 5.9: Job has strict procedures to be followed
Frequency Percent Valid Percent
Cumulative
Percent
Valid strongly disagree 3 4.0 4.0 4.0
disagree 20 26.7 26.7 30.7
moderately agree 30 40.0 40.0 70.7
agree 17 22.7 22.7 93.3
strongly agree 5 6.7 6.7 100.0
Total 75 100.0 100.0
Figure 5.9: Bar chart for Job has no strict procedures to be followed
Interpretation:
The question was asked from the employees that their job doesn’t require any procedures to be
followed closely. 22.7% employees that their job doesn’t require any procedures to be followed
closely. 6.7% strongly agree with the statement. 40% moderately agree with the statement,
26.7% employees disagree with the statement and 4% strongly disagree with this statement. This
is also represented in bar chart format.
5.1.10 All SME’s work gives a feeling of personal accomplishment for the UAE’s economy
t.
Table 5.10: Personal accomplishment
Frequency Percent Valid Percent
Cumulative
Percent
Valid strongly disagree 1 1.3 1.3 1.3
disagree 2 2.7 2.7 4.0
moderately agree 6 8.0 8.0 12.0
agree 46 61.3 61.3 73.3
strongly agree 20 26.7 26.7 100.0
Total 75 100.0 100.0
4
26.7
40
22.7
6.7
0
5
10
15
20
25
30
35
40
45
strogly
disagree
disagree moderately
agree
agree strongly
agree
Percent
Job has no strict procedures to be followed
Figure 5.10: Bar chart for personal accomplishment
Interpretation:
The question was asked from the employees that all SME’s assocated in UAE gives them a
feeling of personal accomplishment. 61.3% employees agree that their work gives them a feeling
of personal accomplishment. 26.7% strongly agree with the statement. 8% moderately agree with
the statement, 2.7% employees disagree with the statement and 1.3% strongly disagree with this
statement. This is also represented in bar chart format.
5.1.11 The SME’s employees are willing to cooperate with the government in achieving the
targeted objectives.
Table 5.11: Employees willing to help
Frequency Percent Valid Percent
Cumulative
Percent
Valid moderately agree 10 13.3 13.3 13.3
agree 24 32.0 32.0 45.3
strongly agree 41 54.7 54.7 100.0
Total 75 100.0 100.0
1.3 2.7
8
61.3
26.7
0
10
20
30
40
50
60
70
strongly
disagree
disagree moderately
agree
agree strongly
agree
Percent
Personal accomplishment
Figure 5.11: Bar chart for Employees willing to help
Interpretation:
The number of the total customers who responded were n= 75. The question was asked from the
customers that whether the bank employees are willing to help them. 54.7% customers strongly
agree that the bank employees willing to help them. 32% agree with the statement and 13.3%
customers moderately agree with the statement. This is also represented in bar chart format.
5.1.12 The All SME’s employees promptly provide service for the acheievvemnt of the
objectives.
Table 5.12: Employees promptly provide service
Frequency Percent Valid Percent
Cumulative
Percent
Valid strongly disagree 1 1.3 1.3 1.3
disagree 5 6.7 6.7 8.0
moderately agree 8 10.7 10.7 18.7
13.3
32
54.7
0
10
20
30
40
50
60
moderately agree agree strongly agree
Percent
Employees willing to help customers
agree 35 46.7 46.7 65.3
strongly agree 26 34.7 34.7 100.0
Total 75 100.0 100.0
Figure 5.12: Bar chart for Employees promptly provide service
Interpretation:
The question was asked from the customers that whether the bank employees promptly provide
them service. 46.7% customers agree that the bank employees promptly provide them service.
34.7% strongly agree with the statement. 10.7% moderately agree with the statement. 6.7%
disagree with this statement and 1.3% customers strongly disagree with the statement. This is
also represented in bar chart format.
5.1.13 The SME’s has courteous, friendly and knowledgeable staff .
Table 5.13: Courteous, friendly and knowledgeable staff
Frequency Percent Valid Percent
Cumulative
Percent
Valid strongly disagree 1 1.3 1.3 1.3
disagree 3 4.0 4.0 5.3
1.3
6.7
10.7
46.7
34.7
0
5
10
15
20
25
30
35
40
45
50
strongly
disagree
disagree moderately
agree
agree strongly
agree
Percent
Employees promptly provide service
moderately agree 3 4.0 4.0 9.3
agree 32 42.7 42.7 52.0
strongly agree 36 48.0 48.0 100.0
Total 75 100.0 100.0
Figure 5.13: Bar chart for Courteous, friendly and knowledgeable staff
Interpretation:
The question was asked from the customers that whether the bank has courteous, friendly and
knowledgeable staff. 42.7% customers agree that the bank has courteous, friendly and
knowledgeable staff. 48% strongly agree with the statement. 4% moderately agree with the
statement. 4% disagree with this statement and 1.3% customers strongly disagree with the
statement. This is also represented in bar chart format.
5.1.14 The bank employee carefully address to when clints request a transaction.
Table 5.14: Employee carefully listens
Frequency Percent Valid Percent
Cumulative
Percent
Valid moderately agree 8 10.7 10.7 10.7
1.3
4 4
42.7
48
0
10
20
30
40
50
60
strongly
disagree
disagree moderately
agree
agree strongly
agree
Percent
Courteous, friendly and knowledgeable staff
agree 38 50.7 50.7 61.3
strongly agree 29 38.7 38.7 100.0
Total 75 100.0 100.0
Figure 5.14: Bar chart for Employee carefully listens
Interpretation:
The question was asked from the customers that whether the bank employee carefully listens to
them when they request a transaction. 50.7% customers agree that the bank employee carefully
listens to them when they request a transaction. 38.7% strongly agree and 10.7% customers
moderately agree with the statement. This is also represented in bar chart format.
5.1.16 The information given by SME’s is clear and easy to understand for the people and
UAE government in acheieving the objectives.
Table 5.16: Clear and easy to understand Information
10.7
50.7
38.7
0
10
20
30
40
50
60
moderately agree agree strongly agree
Percent
Employee carefully listens
Frequency Percent Valid Percent
Cumulative
Percent
Valid disagree 1 1.3 1.3 1.3
moderately agree 7 9.3 9.3 10.7
agree 31 41.3 41.3 52.0
strongly agree 36 48.0 48.0 100.0
Total 75 100.0 100.0
Figure 5.16: Bar chart for clear and easy to understand Information
Interpretation:
The question was asked from the customers that whether the information given was clear and
easy to understand. 41.3% customers agree that the information given was clear and easy to
understand. 48% strongly agree with the statement. 9.3% moderately agree with the statement
and 1.3% customers disagree with this statement. This is also represented in bar chart format.
5.1.17 The SME’s strategy about employees in providi individual attention to address the
challenges faced by UAE government.
1.3
9.3
41.3
48
0
10
20
30
40
50
60
disagree moderately
agree
agree strongly agree
Percent
Clear and easy to understand Information
Table 5.17: Individual attention to customers
Frequency Percent Valid Percent
Cumulative
Percent
Valid strongly disagree 1 1.3 1.3 1.3
disagree 2 2.7 2.7 4.0
moderately agree 7 9.3 9.3 13.3
agree 25 33.3 33.3 46.7
strongly agree 40 53.3 53.3 100.0
Total 75 100.0 100.0
Figure 5.17: Bar chart for Individual attention to customers
Interpretation:
The question was asked from the customers that whether the employees at SME’s provide them
individual attention. 33.3% customers agree that the bank employees provide them individual
attention. 53.3% strongly agree with the statement. 9.3% moderately agree with the statement.
2.7% disagree with this statement and 1.3% customers strongly disagree with the statement. This
is also represented in bar chart format.
5.1.19 The UAE government and employees at SME’s quickly resolve the problems
encounter.
1.3 2.7
9.3
33.3
53.3
0
10
20
30
40
50
60
strongly
disagree
disagree moderately
agree
agree strongly
agree
Percent
Individual attention to customers
Table 5.19: Problems resolution
Frequency Percent Valid Percent
Cumulative
Percent
Valid strongly disagree 2 2.7 2.7 2.7
disagree 3 4.0 4.0 6.7
moderately agree 8 10.7 10.7 17.3
agree 34 45.3 45.3 62.7
strongly agree 28 37.3 37.3 100.0
Total 75 100.0 100.0
Figure 5.19: Bar chart for Problems resolution
Interpretation:
The question was asked from the customers that whether the bank employees quickly resolve the
problems they encounter. 45.3% customers were agreeing that the bank employees quickly
resolve the problems they encounter. 37.3% strongly agree with the statement. 10.7% moderately
agree with the statement. 4% disagree with this statement and 2.7% customers strongly disagree
with the statement. This is also represented in bar chart format.
5.1.20 The employees complete transaction in no time.
2.7 4
10.7
45.3
37.3
0
5
10
15
20
25
30
35
40
45
50
strongly
disagree
disagree moderately
agree
agree strongly
agree
Percent
Problems resolution
Table 5.20: Transaction completes in no time
Frequency Percent Valid Percent
Cumulative
Percent
Valid strongly disagree 1 1.3 1.3 1.3
disagree 2 2.7 2.7 4.0
moderately agree 9 12.0 12.0 16.0
agree 33 44.0 44.0 60.0
strongly agree 30 40.0 40.0 100.0
Total 75 100.0 100.0
Figure 5.20: Bar chart for Transaction completes in no time
Interpretation:
The question was asked from the customers that whether the bank employees complete their
transaction in no time. 44% customers agree that the bank employees complete their transaction
in no time.40 % strongly agree with the statement. 12% moderately agree with the statement.
2.7% disagree with this statement and 1.3% customers strongly disagree with the statement. This
is also represented in bar chart format.
1.3 2.7
12
44
40
0
5
10
15
20
25
30
35
40
45
50
strongly
disagree
disagree moderately
agree
agree strongly
agree
Percent
Transaction completes in no time
5.1.25 The SME’s and UAE government gives priority to keep information confidential.
Table 5.25: Priority to keep Information confidential
Frequency Percent Valid Percent
Cumulative
Percent
Valid agree 9 12.0 12.0 12.0
strongly agree 66 88.0 88.0 100.0
Total 75 100.0 100.0
Figure 5.25: Bar chart for Priority to keep Information confidential
Interpretation:
The question was asked from the customers that whether the bank gives priority to keep their
information confidential. 88 % customers strongly agree that the bank gives priority to keep their
information confidential and 12% customers strongly agree with the statement. This is also
represented in bar chart format.
12
88
0
10
20
30
40
50
60
70
80
90
100
agree strongly agree
Percent
Priority to keep Information confidential
5.1.26 The bank provides wide ranges of service packages with the functions and features
to achieve the objectives.
Table 5.26: Range of service packages.
Frequency Percent Valid Percent
Cumulative
Percent
Valid moderately agree 5 6.7 6.7 6.7
agree 19 25.3 25.3 32.0
strongly agree 51 68.0 68.0 100.0
Total 75 100.0 100.0
Figure 5.26: Bar chart for Range of service packages
Interpretation:
The question was asked from the customers that whether the bank provides wide ranges of
service packages with the functions and features they want. 68% customers strongly agree that
the bank provides wide ranges of service packages with the functions and features they want.
25.3% strongly agree with the statement and 6.7% customers moderately agree with the
statement. This is also represented in bar chart format.
6.7
25.3
68
0
10
20
30
40
50
60
70
80
moderately agree agree strongly agree
Percent
Range of service packages
5.1.27 The SME’s is charging reasonable service fees.
Table 5.27: Reasonable service fees
Frequency Percent Valid Percent
Cumulative
Percent
Valid strongly disagree 2 2.7 2.7 2.7
disagree 6 8.0 8.0 10.7
moderately agree 23 30.7 30.7 41.3
agree 29 38.7 38.7 80.0
strongly agree 15 20.0 20.0 100.0
Total 75 100.0 100.0
Figure 5.27: Bar chart for Reasonable service fees
Interpretation:
The question was asked from the customers that whether the bank is charging reasonable service
fees. 38.7% customers agree that the bank is charging reasonable service fees. 20 % strongly
agree with the statement. 30.7% moderately agree with the statement. 8% disagree with this
statement and 2.27% customers strongly disagree with the statement. This is also represented in
bar chart format.
2.7
8
30.7
38.7
20
0
5
10
15
20
25
30
35
40
45
strongly
disagree
disagree moderately
agree
agree strongly
agree
Percent
Reasonable service fees
5.1.28 Overall, I am satisfied with the service quality of my bank.
Table 5.28: Customer Satisfaction
Frequency Percent Valid Percent
Cumulative
Percent
Valid disagree 1 1.3 1.3 1.3
moderately agree 4 5.3 5.3 6.7
agree 22 29.3 29.3 36.0
strongly agree 48 64.0 64.0 100.0
Total 75 100.0 100.0
Figure 5.28: Bar chart for Customer Satisfaction
Interpretation:
The question was asked from the customers that whether they are satisfied with the service
quality provided by their bank. 29.3% customers agree that they are satisfied with the service
quality of their bank, 64% strongly agree with the statement. 5.3% moderately agree with the
statement and 1.13% customers disagree with this statement. This is also represented in bar chart
format.
1.3
5.3
29.3
64
0
10
20
30
40
50
60
70
disagree moderately
agree
agree strongly agree
Percent
Satisfactory service quality
5.2 Hypotheses Testing
Chi-square test and correlation analysis is applied to test the hypothesis and check the rejection
and acceptance criteria. As for each hypothesis there was a single variable so non parametric test
was applied. The level of significance for all hypotheses was 5%.
5.2.1 Relationship of Service Quality with Customer Satisfaction
Ho: There is no significant challenges between SME and UAE government in handling .
H1: There is a significant challenges between SME and UAE government in handling
Table 5.2.1: Chi-Square Test Statistics Service SME and UAE
Chi-Square 77.480a
df 3
Asymp. Sig. .000
Interpretation
The p-value of the chi-square is less than level of significance i.e. 0.000 < 0.05, therefore null
hypothesis is rejected and alternative hypothesis is accepted that there is a significant
relationship between SME and UAE government in handling. When service quality is improved
customer are more satisfied.
Acceptance and Rejection of Hypothesis: So H1 is accepted that there is a significant
relationship between service SME and UAE government in handling.
5.2.2 Testing Correlations between SME and UAE government in handling
Ho: There is no significant challenges between SME and UAE government and Employees
empowerment in handling
H2: There is no significant challenges between SME and UAE government and Employees
Empowerment in handling
Table 5.2.2: Correlations Between SME’S, UAE Government And Employees
Empowerment
SME UAE Employee.empowerment
SME Pearson
Correlation
1 .278*
.749**
Sig. (2-tailed) .016 .000
N 75 75 75
UAE Government Pearson
Correlation
.278*
1 .286*
Sig. (2-tailed) .016 .013
N 75 75 75
Employee.empowerment Pearson
Correlation
.749**
.286*
1
Sig. (2-tailed) .000 .013
N 75 75 75
*. Correlation is significant at the 0.05 level (2-tailed).
**. Correlation is significant at the 0.01 level (2-tailed).
Interpretation:
The correlations between service quality and customer satisfaction has sig=0.016, p> 0.05, thus
having a weak positive relationship. The correlations between SME’s and employee
empowerment has sig=0.000, p> 0.05, thus having a strong positive relationship. The
correlations between employee empowerment and UAE government has sig=0.013, p> 0.05, thus
having a weak positive relationship. All the correlations are statistically significant and the null
hypothesis is rejected. The fact that all of these correlation coefficients have positive values
indicates that increases in one variable correspond to increases in the other.
Acceptance and Rejection of Hypothesis: So H2 is accepted There is no significant challenges
between SME and UAE government and Employees Empowerment in handling
Role of SMEs in UAE's Economic Development

Contenu connexe

Similaire à Role of SMEs in UAE's Economic Development

Data analysis vin 1
Data analysis vin 1Data analysis vin 1
Data analysis vin 1kishore1000
 
Mid term nov_07
Mid term nov_07Mid term nov_07
Mid term nov_07Hany Nozhy
 
EY 3rd Remuneration Governance Survey
EY 3rd Remuneration Governance SurveyEY 3rd Remuneration Governance Survey
EY 3rd Remuneration Governance SurveyRay Harraway
 
Gallup Q12 index survey
Gallup Q12 index surveyGallup Q12 index survey
Gallup Q12 index surveyTaha Momin
 
PRESENTATION.pptx
PRESENTATION.pptxPRESENTATION.pptx
PRESENTATION.pptxRjAutnap1
 
Tools Of Quality Management PowerPoint Presentation Slides
Tools Of Quality Management PowerPoint Presentation Slides Tools Of Quality Management PowerPoint Presentation Slides
Tools Of Quality Management PowerPoint Presentation Slides SlideTeam
 
Work life balance practices on employee job performance at eco bank kenya
Work life balance practices on employee job performance at eco bank kenyaWork life balance practices on employee job performance at eco bank kenya
Work life balance practices on employee job performance at eco bank kenyaAlexander Decker
 
A study of graduate & post graduate students regarding their career plans
A study of graduate & post graduate students regarding their career plansA study of graduate & post graduate students regarding their career plans
A study of graduate & post graduate students regarding their career plansVaibhav Vaidya
 
Can launch passengers be loyal customer
Can launch passengers be loyal customerCan launch passengers be loyal customer
Can launch passengers be loyal customerEnamul Islam
 
A Study on Effect of Motivation on Employee Job Performance at Anurag Group o...
A Study on Effect of Motivation on Employee Job Performance at Anurag Group o...A Study on Effect of Motivation on Employee Job Performance at Anurag Group o...
A Study on Effect of Motivation on Employee Job Performance at Anurag Group o...IRJET Journal
 
Why Lean Efforts fail - looking at cultural reasons why Lean dosen't work and...
Why Lean Efforts fail - looking at cultural reasons why Lean dosen't work and...Why Lean Efforts fail - looking at cultural reasons why Lean dosen't work and...
Why Lean Efforts fail - looking at cultural reasons why Lean dosen't work and...Ankit Patel
 
5 Years of The SA-csi National results
5 Years of The SA-csi National results5 Years of The SA-csi National results
5 Years of The SA-csi National resultsAdre Schreuder
 
Retention survey questionaire_Compiling Results Example
Retention survey questionaire_Compiling Results ExampleRetention survey questionaire_Compiling Results Example
Retention survey questionaire_Compiling Results ExampleJames Baker, SPHR Retired, MAS
 

Similaire à Role of SMEs in UAE's Economic Development (20)

ms.pptx
ms.pptxms.pptx
ms.pptx
 
Data analysis vin 1
Data analysis vin 1Data analysis vin 1
Data analysis vin 1
 
Mid term nov_07
Mid term nov_07Mid term nov_07
Mid term nov_07
 
EY 3rd Remuneration Governance Survey
EY 3rd Remuneration Governance SurveyEY 3rd Remuneration Governance Survey
EY 3rd Remuneration Governance Survey
 
SM.pptx
SM.pptxSM.pptx
SM.pptx
 
Mba project report
Mba project reportMba project report
Mba project report
 
Gallup Q12 index survey
Gallup Q12 index surveyGallup Q12 index survey
Gallup Q12 index survey
 
PRESENTATION.pptx
PRESENTATION.pptxPRESENTATION.pptx
PRESENTATION.pptx
 
Tools Of Quality Management PowerPoint Presentation Slides
Tools Of Quality Management PowerPoint Presentation Slides Tools Of Quality Management PowerPoint Presentation Slides
Tools Of Quality Management PowerPoint Presentation Slides
 
Work life balance practices on employee job performance at eco bank kenya
Work life balance practices on employee job performance at eco bank kenyaWork life balance practices on employee job performance at eco bank kenya
Work life balance practices on employee job performance at eco bank kenya
 
A study of graduate & post graduate students regarding their career plans
A study of graduate & post graduate students regarding their career plansA study of graduate & post graduate students regarding their career plans
A study of graduate & post graduate students regarding their career plans
 
Can launch passengers be loyal customer
Can launch passengers be loyal customerCan launch passengers be loyal customer
Can launch passengers be loyal customer
 
A Study on Effect of Motivation on Employee Job Performance at Anurag Group o...
A Study on Effect of Motivation on Employee Job Performance at Anurag Group o...A Study on Effect of Motivation on Employee Job Performance at Anurag Group o...
A Study on Effect of Motivation on Employee Job Performance at Anurag Group o...
 
Ijmet 10 01_173
Ijmet 10 01_173Ijmet 10 01_173
Ijmet 10 01_173
 
Why Lean Efforts fail - looking at cultural reasons why Lean dosen't work and...
Why Lean Efforts fail - looking at cultural reasons why Lean dosen't work and...Why Lean Efforts fail - looking at cultural reasons why Lean dosen't work and...
Why Lean Efforts fail - looking at cultural reasons why Lean dosen't work and...
 
Questionnaire of thesis
Questionnaire of thesisQuestionnaire of thesis
Questionnaire of thesis
 
Project
Project Project
Project
 
5 Years of The SA-csi National results
5 Years of The SA-csi National results5 Years of The SA-csi National results
5 Years of The SA-csi National results
 
Retention survey questionaire_Compiling Results Example
Retention survey questionaire_Compiling Results ExampleRetention survey questionaire_Compiling Results Example
Retention survey questionaire_Compiling Results Example
 
418 Homework 2
418 Homework 2418 Homework 2
418 Homework 2
 

Dernier

Booking open Available Pune Call Girls Shivane 6297143586 Call Hot Indian Gi...
Booking open Available Pune Call Girls Shivane  6297143586 Call Hot Indian Gi...Booking open Available Pune Call Girls Shivane  6297143586 Call Hot Indian Gi...
Booking open Available Pune Call Girls Shivane 6297143586 Call Hot Indian Gi...Call Girls in Nagpur High Profile
 
The Economic History of the U.S. Lecture 30.pdf
The Economic History of the U.S. Lecture 30.pdfThe Economic History of the U.S. Lecture 30.pdf
The Economic History of the U.S. Lecture 30.pdfGale Pooley
 
20240417-Calibre-April-2024-Investor-Presentation.pdf
20240417-Calibre-April-2024-Investor-Presentation.pdf20240417-Calibre-April-2024-Investor-Presentation.pdf
20240417-Calibre-April-2024-Investor-Presentation.pdfAdnet Communications
 
The Economic History of the U.S. Lecture 17.pdf
The Economic History of the U.S. Lecture 17.pdfThe Economic History of the U.S. Lecture 17.pdf
The Economic History of the U.S. Lecture 17.pdfGale Pooley
 
CALL ON ➥8923113531 🔝Call Girls Gomti Nagar Lucknow best sexual service
CALL ON ➥8923113531 🔝Call Girls Gomti Nagar Lucknow best sexual serviceCALL ON ➥8923113531 🔝Call Girls Gomti Nagar Lucknow best sexual service
CALL ON ➥8923113531 🔝Call Girls Gomti Nagar Lucknow best sexual serviceanilsa9823
 
VIP Call Girls LB Nagar ( Hyderabad ) Phone 8250192130 | ₹5k To 25k With Room...
VIP Call Girls LB Nagar ( Hyderabad ) Phone 8250192130 | ₹5k To 25k With Room...VIP Call Girls LB Nagar ( Hyderabad ) Phone 8250192130 | ₹5k To 25k With Room...
VIP Call Girls LB Nagar ( Hyderabad ) Phone 8250192130 | ₹5k To 25k With Room...Suhani Kapoor
 
Q3 2024 Earnings Conference Call and Webcast Slides
Q3 2024 Earnings Conference Call and Webcast SlidesQ3 2024 Earnings Conference Call and Webcast Slides
Q3 2024 Earnings Conference Call and Webcast SlidesMarketing847413
 
High Class Call Girls Nagpur Grishma Call 7001035870 Meet With Nagpur Escorts
High Class Call Girls Nagpur Grishma Call 7001035870 Meet With Nagpur EscortsHigh Class Call Girls Nagpur Grishma Call 7001035870 Meet With Nagpur Escorts
High Class Call Girls Nagpur Grishma Call 7001035870 Meet With Nagpur Escortsranjana rawat
 
The Economic History of the U.S. Lecture 19.pdf
The Economic History of the U.S. Lecture 19.pdfThe Economic History of the U.S. Lecture 19.pdf
The Economic History of the U.S. Lecture 19.pdfGale Pooley
 
TEST BANK For Corporate Finance, 13th Edition By Stephen Ross, Randolph Weste...
TEST BANK For Corporate Finance, 13th Edition By Stephen Ross, Randolph Weste...TEST BANK For Corporate Finance, 13th Edition By Stephen Ross, Randolph Weste...
TEST BANK For Corporate Finance, 13th Edition By Stephen Ross, Randolph Weste...ssifa0344
 
03_Emmanuel Ndiaye_Degroof Petercam.pptx
03_Emmanuel Ndiaye_Degroof Petercam.pptx03_Emmanuel Ndiaye_Degroof Petercam.pptx
03_Emmanuel Ndiaye_Degroof Petercam.pptxFinTech Belgium
 
Best VIP Call Girls Noida Sector 18 Call Me: 8448380779
Best VIP Call Girls Noida Sector 18 Call Me: 8448380779Best VIP Call Girls Noida Sector 18 Call Me: 8448380779
Best VIP Call Girls Noida Sector 18 Call Me: 8448380779Delhi Call girls
 
Call Girls Koregaon Park Call Me 7737669865 Budget Friendly No Advance Booking
Call Girls Koregaon Park Call Me 7737669865 Budget Friendly No Advance BookingCall Girls Koregaon Park Call Me 7737669865 Budget Friendly No Advance Booking
Call Girls Koregaon Park Call Me 7737669865 Budget Friendly No Advance Bookingroncy bisnoi
 
Log your LOA pain with Pension Lab's brilliant campaign
Log your LOA pain with Pension Lab's brilliant campaignLog your LOA pain with Pension Lab's brilliant campaign
Log your LOA pain with Pension Lab's brilliant campaignHenry Tapper
 
VIP Call Girls Service Dilsukhnagar Hyderabad Call +91-8250192130
VIP Call Girls Service Dilsukhnagar Hyderabad Call +91-8250192130VIP Call Girls Service Dilsukhnagar Hyderabad Call +91-8250192130
VIP Call Girls Service Dilsukhnagar Hyderabad Call +91-8250192130Suhani Kapoor
 
The Economic History of the U.S. Lecture 22.pdf
The Economic History of the U.S. Lecture 22.pdfThe Economic History of the U.S. Lecture 22.pdf
The Economic History of the U.S. Lecture 22.pdfGale Pooley
 
06_Joeri Van Speybroek_Dell_MeetupDora&Cybersecurity.pdf
06_Joeri Van Speybroek_Dell_MeetupDora&Cybersecurity.pdf06_Joeri Van Speybroek_Dell_MeetupDora&Cybersecurity.pdf
06_Joeri Van Speybroek_Dell_MeetupDora&Cybersecurity.pdfFinTech Belgium
 
Independent Call Girl Number in Kurla Mumbai📲 Pooja Nehwal 9892124323 💞 Full ...
Independent Call Girl Number in Kurla Mumbai📲 Pooja Nehwal 9892124323 💞 Full ...Independent Call Girl Number in Kurla Mumbai📲 Pooja Nehwal 9892124323 💞 Full ...
Independent Call Girl Number in Kurla Mumbai📲 Pooja Nehwal 9892124323 💞 Full ...Pooja Nehwal
 
(ANIKA) Budhwar Peth Call Girls Just Call 7001035870 [ Cash on Delivery ] Pun...
(ANIKA) Budhwar Peth Call Girls Just Call 7001035870 [ Cash on Delivery ] Pun...(ANIKA) Budhwar Peth Call Girls Just Call 7001035870 [ Cash on Delivery ] Pun...
(ANIKA) Budhwar Peth Call Girls Just Call 7001035870 [ Cash on Delivery ] Pun...ranjana rawat
 
Dharavi Russian callg Girls, { 09892124323 } || Call Girl In Mumbai ...
Dharavi Russian callg Girls, { 09892124323 } || Call Girl In Mumbai ...Dharavi Russian callg Girls, { 09892124323 } || Call Girl In Mumbai ...
Dharavi Russian callg Girls, { 09892124323 } || Call Girl In Mumbai ...Pooja Nehwal
 

Dernier (20)

Booking open Available Pune Call Girls Shivane 6297143586 Call Hot Indian Gi...
Booking open Available Pune Call Girls Shivane  6297143586 Call Hot Indian Gi...Booking open Available Pune Call Girls Shivane  6297143586 Call Hot Indian Gi...
Booking open Available Pune Call Girls Shivane 6297143586 Call Hot Indian Gi...
 
The Economic History of the U.S. Lecture 30.pdf
The Economic History of the U.S. Lecture 30.pdfThe Economic History of the U.S. Lecture 30.pdf
The Economic History of the U.S. Lecture 30.pdf
 
20240417-Calibre-April-2024-Investor-Presentation.pdf
20240417-Calibre-April-2024-Investor-Presentation.pdf20240417-Calibre-April-2024-Investor-Presentation.pdf
20240417-Calibre-April-2024-Investor-Presentation.pdf
 
The Economic History of the U.S. Lecture 17.pdf
The Economic History of the U.S. Lecture 17.pdfThe Economic History of the U.S. Lecture 17.pdf
The Economic History of the U.S. Lecture 17.pdf
 
CALL ON ➥8923113531 🔝Call Girls Gomti Nagar Lucknow best sexual service
CALL ON ➥8923113531 🔝Call Girls Gomti Nagar Lucknow best sexual serviceCALL ON ➥8923113531 🔝Call Girls Gomti Nagar Lucknow best sexual service
CALL ON ➥8923113531 🔝Call Girls Gomti Nagar Lucknow best sexual service
 
VIP Call Girls LB Nagar ( Hyderabad ) Phone 8250192130 | ₹5k To 25k With Room...
VIP Call Girls LB Nagar ( Hyderabad ) Phone 8250192130 | ₹5k To 25k With Room...VIP Call Girls LB Nagar ( Hyderabad ) Phone 8250192130 | ₹5k To 25k With Room...
VIP Call Girls LB Nagar ( Hyderabad ) Phone 8250192130 | ₹5k To 25k With Room...
 
Q3 2024 Earnings Conference Call and Webcast Slides
Q3 2024 Earnings Conference Call and Webcast SlidesQ3 2024 Earnings Conference Call and Webcast Slides
Q3 2024 Earnings Conference Call and Webcast Slides
 
High Class Call Girls Nagpur Grishma Call 7001035870 Meet With Nagpur Escorts
High Class Call Girls Nagpur Grishma Call 7001035870 Meet With Nagpur EscortsHigh Class Call Girls Nagpur Grishma Call 7001035870 Meet With Nagpur Escorts
High Class Call Girls Nagpur Grishma Call 7001035870 Meet With Nagpur Escorts
 
The Economic History of the U.S. Lecture 19.pdf
The Economic History of the U.S. Lecture 19.pdfThe Economic History of the U.S. Lecture 19.pdf
The Economic History of the U.S. Lecture 19.pdf
 
TEST BANK For Corporate Finance, 13th Edition By Stephen Ross, Randolph Weste...
TEST BANK For Corporate Finance, 13th Edition By Stephen Ross, Randolph Weste...TEST BANK For Corporate Finance, 13th Edition By Stephen Ross, Randolph Weste...
TEST BANK For Corporate Finance, 13th Edition By Stephen Ross, Randolph Weste...
 
03_Emmanuel Ndiaye_Degroof Petercam.pptx
03_Emmanuel Ndiaye_Degroof Petercam.pptx03_Emmanuel Ndiaye_Degroof Petercam.pptx
03_Emmanuel Ndiaye_Degroof Petercam.pptx
 
Best VIP Call Girls Noida Sector 18 Call Me: 8448380779
Best VIP Call Girls Noida Sector 18 Call Me: 8448380779Best VIP Call Girls Noida Sector 18 Call Me: 8448380779
Best VIP Call Girls Noida Sector 18 Call Me: 8448380779
 
Call Girls Koregaon Park Call Me 7737669865 Budget Friendly No Advance Booking
Call Girls Koregaon Park Call Me 7737669865 Budget Friendly No Advance BookingCall Girls Koregaon Park Call Me 7737669865 Budget Friendly No Advance Booking
Call Girls Koregaon Park Call Me 7737669865 Budget Friendly No Advance Booking
 
Log your LOA pain with Pension Lab's brilliant campaign
Log your LOA pain with Pension Lab's brilliant campaignLog your LOA pain with Pension Lab's brilliant campaign
Log your LOA pain with Pension Lab's brilliant campaign
 
VIP Call Girls Service Dilsukhnagar Hyderabad Call +91-8250192130
VIP Call Girls Service Dilsukhnagar Hyderabad Call +91-8250192130VIP Call Girls Service Dilsukhnagar Hyderabad Call +91-8250192130
VIP Call Girls Service Dilsukhnagar Hyderabad Call +91-8250192130
 
The Economic History of the U.S. Lecture 22.pdf
The Economic History of the U.S. Lecture 22.pdfThe Economic History of the U.S. Lecture 22.pdf
The Economic History of the U.S. Lecture 22.pdf
 
06_Joeri Van Speybroek_Dell_MeetupDora&Cybersecurity.pdf
06_Joeri Van Speybroek_Dell_MeetupDora&Cybersecurity.pdf06_Joeri Van Speybroek_Dell_MeetupDora&Cybersecurity.pdf
06_Joeri Van Speybroek_Dell_MeetupDora&Cybersecurity.pdf
 
Independent Call Girl Number in Kurla Mumbai📲 Pooja Nehwal 9892124323 💞 Full ...
Independent Call Girl Number in Kurla Mumbai📲 Pooja Nehwal 9892124323 💞 Full ...Independent Call Girl Number in Kurla Mumbai📲 Pooja Nehwal 9892124323 💞 Full ...
Independent Call Girl Number in Kurla Mumbai📲 Pooja Nehwal 9892124323 💞 Full ...
 
(ANIKA) Budhwar Peth Call Girls Just Call 7001035870 [ Cash on Delivery ] Pun...
(ANIKA) Budhwar Peth Call Girls Just Call 7001035870 [ Cash on Delivery ] Pun...(ANIKA) Budhwar Peth Call Girls Just Call 7001035870 [ Cash on Delivery ] Pun...
(ANIKA) Budhwar Peth Call Girls Just Call 7001035870 [ Cash on Delivery ] Pun...
 
Dharavi Russian callg Girls, { 09892124323 } || Call Girl In Mumbai ...
Dharavi Russian callg Girls, { 09892124323 } || Call Girl In Mumbai ...Dharavi Russian callg Girls, { 09892124323 } || Call Girl In Mumbai ...
Dharavi Russian callg Girls, { 09892124323 } || Call Girl In Mumbai ...
 

Role of SMEs in UAE's Economic Development

  • 1. CHAPTER 5 RESULTS AND DATA ANALYSIS Results include the descriptive analysis and hypotheses testing. To fulfill the aims of this study the following research objectives are set: -To study and analyse the role played by SMEs in the economic development of the UAE; -To explore and analyse the steps taken by the UAE Government and Banks to support the development of the UAE SME sector; and -To investigate the challenges faced by UAE Based SMEs in accessing capital from banks. 5.1 Descriptive Analysis The research data was computed and analyzed. Frequency distribution for each question was developed with proper tables and graphs. Interpretation gives clear idea about the final results. The proportions of responses indicating the degree of agreement to the questions related to the role played by SME’s and various challenges faced by UAE government in accessing the capital from banks.
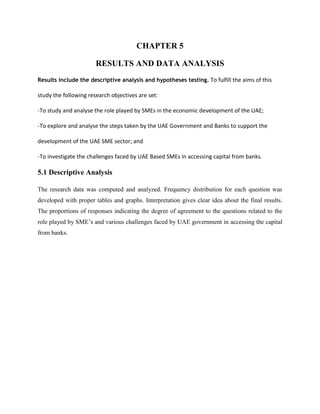
  • 2. 5.1.1 The mission of the SME’s makes me feel that my job is important. Table 5.1: Job Importance Frequency Percent Valid Percent Cumulative Percent Valid strongly disagree 1 1.3 1.3 1.3 Disagree 2 2.7 2.7 4.0 moderately agree 10 13.3 13.3 17.3 Agree 41 54.7 54.7 72.0 strongly agree 21 28.0 28.0 100.0 Total 75 100.0 100.0 Figure 5.1: Bar chart for Job Importance Interpretation: The number of the total employees who responded were n= 75. The question was asked from the employees that whether the mission of the bank makes them feel that their job is important. 54.7% employees agree that the mission of the bank makes them feel that their job is important. 28% strongly agree with the statement. 13.3% moderately agree with the statement. 2.27% 1.3 2.7 13.3 54.7 28 0 10 20 30 40 50 60 strongly disagree disagree moderately agree agree strongly agree Percent Job Importance
  • 3. disagree with this statement and 1.13% employees strongly disagree with the statement. This is also represented in bar chart format. 5.1.2 I understand the SME’s objectives and try to achieve them. Table 5.2: Understand and achieve bank's objectives Frequency Percent Valid Percent Cumulative Percent Valid strongly disagree 1 1.3 1.3 1.3 disagree 2 2.7 2.7 4.0 moderately agree 11 14.7 14.7 18.7 agree 37 49.3 49.3 68.0 strongly agree 24 32.0 32.0 100.0 Total 75 100.0 100.0 Figure 5.2: Bar chart for Understand and achieve bank's objectives Interpretation: The question was asked from the employees that whether they understand the bank’s objectives and try to achieve them. 49.3% employees agree that they have an understanding of the bank’s 1.3 2.7 14.7 49.3 32 0 10 20 30 40 50 60 strongly disagree disagree moderately agree agree strongly agree Percent Understand and achieve bank's objectives
  • 4. objectives and they try to achieve them. 32% strongly agree with the statement. 14.7% moderately agree with the statement. 2.27% disagree with this statement and 1.13% employees strongly disagree with the statement. This is also represented in bar chart format. 5.1.3 UAE government views SME’s as an asset. Table 5.3: Employee an asset Frequency Percent Valid Percent Cumulative Percent Valid disagree 3 4.0 4.0 4.0 moderately agree 11 14.7 14.7 18.7 agree 42 56.0 56.0 74.7 strongly agree 19 25.3 25.3 100.0 Total 75 100.0 100.0 Figure 5.3: Bar chart for Employee an asset Interpretation: The question was asked from the employees that whether the oUAE government views them as an asset. 56% employees agree that the organization views them as an asset. 25.3% strongly agree with the statement. 14.7% moderately agree with the statement and 4% employees disagree with the statement. This is also represented in bar chart format. 4 14.7 56 25.3 0 10 20 30 40 50 60 disagree moderately agree agree strongly agree Percent Employee an asset
  • 5. 5.1.4 The impact of SME’s contribution in economy is large. Table 5.4: Contribution Impact in Department Frequency Percent Valid Percent Cumulative Percent Valid strongly disagree 1 1.3 1.3 1.3 disagree 8 10.7 10.7 12.0 moderately agree 22 29.3 29.3 41.3 agree 29 38.7 38.7 80.0 strongly agree 15 20.0 20.0 100.0 Total 75 100.0 100.0 Figure 5.4: Bar chart for Contribution Impact in Department Interpretation: The question was asked from the employees that the impact of their contribution in the economic is large. 38.7% employees agree that the impact of their contribution in their department is large. 1.3 10.7 29.3 38.7 20 0 5 10 15 20 25 30 35 40 45 strongly disagree disagree moderately agree agree strongly agree Percent Contribution impact in department
  • 6. 20% strongly agree with the statement. 29.3% moderately agree with the statement and 10.7% employees disagree with the statement and 1.3% employees strongly disagree with this statement. This is also represented in bar chart format. 5.1.5 UAE government have a great deal of control over what happens in SME’s callanges. Table 5.5: Control over the working in the department Frequency Percent Valid Percent Cumulative Percent Valid strongly disagree 4 5.3 5.3 5.3 disagree 18 24.0 24.0 29.3 moderately agree 21 28.0 28.0 57.3 agree 19 25.3 25.3 82.7 strongly agree 13 17.3 17.3 100.0 Total 75 100.0 100.0 Figure 5.5: Bar chart for Control over the working in the department Interpretation: 5.3 24 28 25.3 17.3 0 5 10 15 20 25 30 strongly disagree disagree moderately agree agree strongly agree Percent Control over the working in the department
  • 7. The question was asked from the employees that they have a great deal of control over what happens in SME’s challenges. 25.3% employees agree that they have a great deal of control over what happens in their department. 17.3% strongly agree with the statement. 28% moderately agree with the statement and 24% employees disagree with the statement and 5.3% employees strongly disagree with this statement. This is also represented in bar chart format. 5.1.6 SME’s have significant autonomy in handling the chanllenges with the support of UAE government. Table 5.6 Autonomy in performing job Frequency Percent Valid Percent Cumulative Percent Valid Disagree 10 13.3 13.3 13.3 moderately agree 12 16.0 16.0 29.3 Agree 34 45.3 45.3 74.7 strongly agree 19 25.3 25.3 100.0 Total 75 100.0 100.0 Figure 5.6: Bar chart for Autonomy in handling the challenges Interpretation: 13.3 16 45.3 25.3 0 5 10 15 20 25 30 35 40 45 50 disagree moderately agree agree strongly agree Percent
  • 8. The question was asked from the SME’s that they have a significant autonomy in determining how they do their job. 45.3% employees agree that they have a significant autonomy in determining how they do their job. 25.3% strongly agree with the statement. 16% moderately agree with the statement and 13.3% employees disagree with the statement. This is also represented in bar chart format. 5.1.7 SME’s are allowed to be creative and innovative while dealing with problems at work. Table 5.7: Creative and Innovative employees Frequency Percent Valid Percent Cumulative Percent Valid strongly disagree 1 1.3 1.3 1.3 disagree 1 1.3 1.3 2.7 moderately agree 4 5.3 5.3 8.0 agree 40 53.3 53.3 61.3 strongly agree 29 38.7 38.7 100.0 Total 75 100.0 100.0 1.3 1.3 5.3 53.3 38.7 0 10 20 30 40 50 60 strongly disagree disagree moderately agree agree strongly agree Percent Creative and innovative while dealing with work problems
  • 9. Figure 5.7: Bar chart for Creative and Innovative employees Interpretation: The question was asked from the employees that whether they are allowed to be creative and innovative while dealing with problems at work 53.3% employees agree that they are allowed to be creative and innovative while dealing with problems at work. 38.7% strongly agree with the statement. 5.3% moderately agree with the statement, 1.3% employees disagree with the statement and 1.3% strongly disagree with this statement. This is also represented in bar chart format. 5.1.9 SME’s have to follow procedures closely while handling the heinous challenges for the economy. Table 5.9: Job has strict procedures to be followed Frequency Percent Valid Percent Cumulative Percent Valid strongly disagree 3 4.0 4.0 4.0 disagree 20 26.7 26.7 30.7 moderately agree 30 40.0 40.0 70.7 agree 17 22.7 22.7 93.3 strongly agree 5 6.7 6.7 100.0 Total 75 100.0 100.0
  • 10. Figure 5.9: Bar chart for Job has no strict procedures to be followed Interpretation: The question was asked from the employees that their job doesn’t require any procedures to be followed closely. 22.7% employees that their job doesn’t require any procedures to be followed closely. 6.7% strongly agree with the statement. 40% moderately agree with the statement, 26.7% employees disagree with the statement and 4% strongly disagree with this statement. This is also represented in bar chart format. 5.1.10 All SME’s work gives a feeling of personal accomplishment for the UAE’s economy t. Table 5.10: Personal accomplishment Frequency Percent Valid Percent Cumulative Percent Valid strongly disagree 1 1.3 1.3 1.3 disagree 2 2.7 2.7 4.0 moderately agree 6 8.0 8.0 12.0 agree 46 61.3 61.3 73.3 strongly agree 20 26.7 26.7 100.0 Total 75 100.0 100.0 4 26.7 40 22.7 6.7 0 5 10 15 20 25 30 35 40 45 strogly disagree disagree moderately agree agree strongly agree Percent Job has no strict procedures to be followed
  • 11. Figure 5.10: Bar chart for personal accomplishment Interpretation: The question was asked from the employees that all SME’s assocated in UAE gives them a feeling of personal accomplishment. 61.3% employees agree that their work gives them a feeling of personal accomplishment. 26.7% strongly agree with the statement. 8% moderately agree with the statement, 2.7% employees disagree with the statement and 1.3% strongly disagree with this statement. This is also represented in bar chart format. 5.1.11 The SME’s employees are willing to cooperate with the government in achieving the targeted objectives. Table 5.11: Employees willing to help Frequency Percent Valid Percent Cumulative Percent Valid moderately agree 10 13.3 13.3 13.3 agree 24 32.0 32.0 45.3 strongly agree 41 54.7 54.7 100.0 Total 75 100.0 100.0 1.3 2.7 8 61.3 26.7 0 10 20 30 40 50 60 70 strongly disagree disagree moderately agree agree strongly agree Percent Personal accomplishment
  • 12. Figure 5.11: Bar chart for Employees willing to help Interpretation: The number of the total customers who responded were n= 75. The question was asked from the customers that whether the bank employees are willing to help them. 54.7% customers strongly agree that the bank employees willing to help them. 32% agree with the statement and 13.3% customers moderately agree with the statement. This is also represented in bar chart format. 5.1.12 The All SME’s employees promptly provide service for the acheievvemnt of the objectives. Table 5.12: Employees promptly provide service Frequency Percent Valid Percent Cumulative Percent Valid strongly disagree 1 1.3 1.3 1.3 disagree 5 6.7 6.7 8.0 moderately agree 8 10.7 10.7 18.7 13.3 32 54.7 0 10 20 30 40 50 60 moderately agree agree strongly agree Percent Employees willing to help customers
  • 13. agree 35 46.7 46.7 65.3 strongly agree 26 34.7 34.7 100.0 Total 75 100.0 100.0 Figure 5.12: Bar chart for Employees promptly provide service Interpretation: The question was asked from the customers that whether the bank employees promptly provide them service. 46.7% customers agree that the bank employees promptly provide them service. 34.7% strongly agree with the statement. 10.7% moderately agree with the statement. 6.7% disagree with this statement and 1.3% customers strongly disagree with the statement. This is also represented in bar chart format. 5.1.13 The SME’s has courteous, friendly and knowledgeable staff . Table 5.13: Courteous, friendly and knowledgeable staff Frequency Percent Valid Percent Cumulative Percent Valid strongly disagree 1 1.3 1.3 1.3 disagree 3 4.0 4.0 5.3 1.3 6.7 10.7 46.7 34.7 0 5 10 15 20 25 30 35 40 45 50 strongly disagree disagree moderately agree agree strongly agree Percent Employees promptly provide service
  • 14. moderately agree 3 4.0 4.0 9.3 agree 32 42.7 42.7 52.0 strongly agree 36 48.0 48.0 100.0 Total 75 100.0 100.0 Figure 5.13: Bar chart for Courteous, friendly and knowledgeable staff Interpretation: The question was asked from the customers that whether the bank has courteous, friendly and knowledgeable staff. 42.7% customers agree that the bank has courteous, friendly and knowledgeable staff. 48% strongly agree with the statement. 4% moderately agree with the statement. 4% disagree with this statement and 1.3% customers strongly disagree with the statement. This is also represented in bar chart format. 5.1.14 The bank employee carefully address to when clints request a transaction. Table 5.14: Employee carefully listens Frequency Percent Valid Percent Cumulative Percent Valid moderately agree 8 10.7 10.7 10.7 1.3 4 4 42.7 48 0 10 20 30 40 50 60 strongly disagree disagree moderately agree agree strongly agree Percent Courteous, friendly and knowledgeable staff
  • 15. agree 38 50.7 50.7 61.3 strongly agree 29 38.7 38.7 100.0 Total 75 100.0 100.0 Figure 5.14: Bar chart for Employee carefully listens Interpretation: The question was asked from the customers that whether the bank employee carefully listens to them when they request a transaction. 50.7% customers agree that the bank employee carefully listens to them when they request a transaction. 38.7% strongly agree and 10.7% customers moderately agree with the statement. This is also represented in bar chart format. 5.1.16 The information given by SME’s is clear and easy to understand for the people and UAE government in acheieving the objectives. Table 5.16: Clear and easy to understand Information 10.7 50.7 38.7 0 10 20 30 40 50 60 moderately agree agree strongly agree Percent Employee carefully listens
  • 16. Frequency Percent Valid Percent Cumulative Percent Valid disagree 1 1.3 1.3 1.3 moderately agree 7 9.3 9.3 10.7 agree 31 41.3 41.3 52.0 strongly agree 36 48.0 48.0 100.0 Total 75 100.0 100.0 Figure 5.16: Bar chart for clear and easy to understand Information Interpretation: The question was asked from the customers that whether the information given was clear and easy to understand. 41.3% customers agree that the information given was clear and easy to understand. 48% strongly agree with the statement. 9.3% moderately agree with the statement and 1.3% customers disagree with this statement. This is also represented in bar chart format. 5.1.17 The SME’s strategy about employees in providi individual attention to address the challenges faced by UAE government. 1.3 9.3 41.3 48 0 10 20 30 40 50 60 disagree moderately agree agree strongly agree Percent Clear and easy to understand Information
  • 17. Table 5.17: Individual attention to customers Frequency Percent Valid Percent Cumulative Percent Valid strongly disagree 1 1.3 1.3 1.3 disagree 2 2.7 2.7 4.0 moderately agree 7 9.3 9.3 13.3 agree 25 33.3 33.3 46.7 strongly agree 40 53.3 53.3 100.0 Total 75 100.0 100.0 Figure 5.17: Bar chart for Individual attention to customers Interpretation: The question was asked from the customers that whether the employees at SME’s provide them individual attention. 33.3% customers agree that the bank employees provide them individual attention. 53.3% strongly agree with the statement. 9.3% moderately agree with the statement. 2.7% disagree with this statement and 1.3% customers strongly disagree with the statement. This is also represented in bar chart format. 5.1.19 The UAE government and employees at SME’s quickly resolve the problems encounter. 1.3 2.7 9.3 33.3 53.3 0 10 20 30 40 50 60 strongly disagree disagree moderately agree agree strongly agree Percent Individual attention to customers
  • 18. Table 5.19: Problems resolution Frequency Percent Valid Percent Cumulative Percent Valid strongly disagree 2 2.7 2.7 2.7 disagree 3 4.0 4.0 6.7 moderately agree 8 10.7 10.7 17.3 agree 34 45.3 45.3 62.7 strongly agree 28 37.3 37.3 100.0 Total 75 100.0 100.0 Figure 5.19: Bar chart for Problems resolution Interpretation: The question was asked from the customers that whether the bank employees quickly resolve the problems they encounter. 45.3% customers were agreeing that the bank employees quickly resolve the problems they encounter. 37.3% strongly agree with the statement. 10.7% moderately agree with the statement. 4% disagree with this statement and 2.7% customers strongly disagree with the statement. This is also represented in bar chart format. 5.1.20 The employees complete transaction in no time. 2.7 4 10.7 45.3 37.3 0 5 10 15 20 25 30 35 40 45 50 strongly disagree disagree moderately agree agree strongly agree Percent Problems resolution
  • 19. Table 5.20: Transaction completes in no time Frequency Percent Valid Percent Cumulative Percent Valid strongly disagree 1 1.3 1.3 1.3 disagree 2 2.7 2.7 4.0 moderately agree 9 12.0 12.0 16.0 agree 33 44.0 44.0 60.0 strongly agree 30 40.0 40.0 100.0 Total 75 100.0 100.0 Figure 5.20: Bar chart for Transaction completes in no time Interpretation: The question was asked from the customers that whether the bank employees complete their transaction in no time. 44% customers agree that the bank employees complete their transaction in no time.40 % strongly agree with the statement. 12% moderately agree with the statement. 2.7% disagree with this statement and 1.3% customers strongly disagree with the statement. This is also represented in bar chart format. 1.3 2.7 12 44 40 0 5 10 15 20 25 30 35 40 45 50 strongly disagree disagree moderately agree agree strongly agree Percent Transaction completes in no time
  • 20. 5.1.25 The SME’s and UAE government gives priority to keep information confidential. Table 5.25: Priority to keep Information confidential Frequency Percent Valid Percent Cumulative Percent Valid agree 9 12.0 12.0 12.0 strongly agree 66 88.0 88.0 100.0 Total 75 100.0 100.0 Figure 5.25: Bar chart for Priority to keep Information confidential Interpretation: The question was asked from the customers that whether the bank gives priority to keep their information confidential. 88 % customers strongly agree that the bank gives priority to keep their information confidential and 12% customers strongly agree with the statement. This is also represented in bar chart format. 12 88 0 10 20 30 40 50 60 70 80 90 100 agree strongly agree Percent Priority to keep Information confidential
  • 21. 5.1.26 The bank provides wide ranges of service packages with the functions and features to achieve the objectives. Table 5.26: Range of service packages. Frequency Percent Valid Percent Cumulative Percent Valid moderately agree 5 6.7 6.7 6.7 agree 19 25.3 25.3 32.0 strongly agree 51 68.0 68.0 100.0 Total 75 100.0 100.0 Figure 5.26: Bar chart for Range of service packages Interpretation: The question was asked from the customers that whether the bank provides wide ranges of service packages with the functions and features they want. 68% customers strongly agree that the bank provides wide ranges of service packages with the functions and features they want. 25.3% strongly agree with the statement and 6.7% customers moderately agree with the statement. This is also represented in bar chart format. 6.7 25.3 68 0 10 20 30 40 50 60 70 80 moderately agree agree strongly agree Percent Range of service packages
  • 22. 5.1.27 The SME’s is charging reasonable service fees. Table 5.27: Reasonable service fees Frequency Percent Valid Percent Cumulative Percent Valid strongly disagree 2 2.7 2.7 2.7 disagree 6 8.0 8.0 10.7 moderately agree 23 30.7 30.7 41.3 agree 29 38.7 38.7 80.0 strongly agree 15 20.0 20.0 100.0 Total 75 100.0 100.0 Figure 5.27: Bar chart for Reasonable service fees Interpretation: The question was asked from the customers that whether the bank is charging reasonable service fees. 38.7% customers agree that the bank is charging reasonable service fees. 20 % strongly agree with the statement. 30.7% moderately agree with the statement. 8% disagree with this statement and 2.27% customers strongly disagree with the statement. This is also represented in bar chart format. 2.7 8 30.7 38.7 20 0 5 10 15 20 25 30 35 40 45 strongly disagree disagree moderately agree agree strongly agree Percent Reasonable service fees
  • 23. 5.1.28 Overall, I am satisfied with the service quality of my bank. Table 5.28: Customer Satisfaction Frequency Percent Valid Percent Cumulative Percent Valid disagree 1 1.3 1.3 1.3 moderately agree 4 5.3 5.3 6.7 agree 22 29.3 29.3 36.0 strongly agree 48 64.0 64.0 100.0 Total 75 100.0 100.0 Figure 5.28: Bar chart for Customer Satisfaction Interpretation: The question was asked from the customers that whether they are satisfied with the service quality provided by their bank. 29.3% customers agree that they are satisfied with the service quality of their bank, 64% strongly agree with the statement. 5.3% moderately agree with the statement and 1.13% customers disagree with this statement. This is also represented in bar chart format. 1.3 5.3 29.3 64 0 10 20 30 40 50 60 70 disagree moderately agree agree strongly agree Percent Satisfactory service quality
  • 24. 5.2 Hypotheses Testing Chi-square test and correlation analysis is applied to test the hypothesis and check the rejection and acceptance criteria. As for each hypothesis there was a single variable so non parametric test was applied. The level of significance for all hypotheses was 5%. 5.2.1 Relationship of Service Quality with Customer Satisfaction Ho: There is no significant challenges between SME and UAE government in handling . H1: There is a significant challenges between SME and UAE government in handling Table 5.2.1: Chi-Square Test Statistics Service SME and UAE Chi-Square 77.480a df 3 Asymp. Sig. .000 Interpretation The p-value of the chi-square is less than level of significance i.e. 0.000 < 0.05, therefore null hypothesis is rejected and alternative hypothesis is accepted that there is a significant relationship between SME and UAE government in handling. When service quality is improved customer are more satisfied. Acceptance and Rejection of Hypothesis: So H1 is accepted that there is a significant relationship between service SME and UAE government in handling.
  • 25. 5.2.2 Testing Correlations between SME and UAE government in handling Ho: There is no significant challenges between SME and UAE government and Employees empowerment in handling H2: There is no significant challenges between SME and UAE government and Employees Empowerment in handling Table 5.2.2: Correlations Between SME’S, UAE Government And Employees Empowerment SME UAE Employee.empowerment SME Pearson Correlation 1 .278* .749** Sig. (2-tailed) .016 .000 N 75 75 75 UAE Government Pearson Correlation .278* 1 .286* Sig. (2-tailed) .016 .013 N 75 75 75 Employee.empowerment Pearson Correlation .749** .286* 1 Sig. (2-tailed) .000 .013 N 75 75 75 *. Correlation is significant at the 0.05 level (2-tailed). **. Correlation is significant at the 0.01 level (2-tailed). Interpretation: The correlations between service quality and customer satisfaction has sig=0.016, p> 0.05, thus having a weak positive relationship. The correlations between SME’s and employee empowerment has sig=0.000, p> 0.05, thus having a strong positive relationship. The correlations between employee empowerment and UAE government has sig=0.013, p> 0.05, thus having a weak positive relationship. All the correlations are statistically significant and the null
  • 26. hypothesis is rejected. The fact that all of these correlation coefficients have positive values indicates that increases in one variable correspond to increases in the other. Acceptance and Rejection of Hypothesis: So H2 is accepted There is no significant challenges between SME and UAE government and Employees Empowerment in handling