Power BI reports and dashboards for Microsoft Project Server
•Télécharger en tant que PPTX, PDF•
5 j'aime•6,447 vues

In Project Server, Power BI adds value in creating interactive reports and dashboards as it allows data connectivity with OData and other data sources. Power BI reporting can be used with both Project Online and Project Server. This webinar gives you a platform to learn how to connect to Data Source - OData feed from Power BI. In this session, you will also learn how to create and publish reports and dashboards using the visual tools set available in Power BI desktop, and explore more on its features.

Recommandé
Recommandé
Contenu connexe
Tendances
Tendances (20)
En vedette
En vedette (20)
Similaire à Power BI reports and dashboards for Microsoft Project Server
Similaire à Power BI reports and dashboards for Microsoft Project Server (20)
Plus de Advaiya Solutions, Inc.
Plus de Advaiya Solutions, Inc. (20)
Dernier
Dernier (20)
Power BI reports and dashboards for Microsoft Project Server
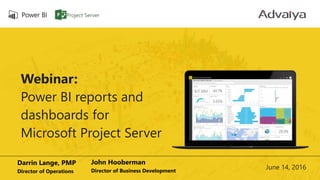
- 1. Webinar: Power BI reports and dashboards for Microsoft Project Server Darrin Lange, PMP Director of Operations John Hooberman Director of Business Development June 14, 2016
- 2. About the Speaker Darrin Lange, PMP Director of Operations at Advaiya Solutions, Inc. Two decades of diverse project management experience in the Information Technology industry
- 3. Code of Conduct • Presentation of around 30 minutes, followed by a brief Q and A session • Attendees are expected to stay quiet during the session, and note down questions which can be taken up in the Q and A • In case of any urgency, attendees can ping us to discuss the matter
- 4. Agenda • Introduction to Advaiya Solutions, Inc. • Common terms and concepts • PWA data and how to access it (OData feed) • PowerBI • Natural Query Language • Sharing dashboards • Importing visuals from Power BI visual gallery • Creating group workspaces
- 5. • Extensive expertise and experienced professionals for EPM and SharePoint • Application Extensions • ERP, LOB Integration • Workflow Automation • IT Architecture • Platform Extensions • Verticals’ Understanding (BFSI, IT/ITES, Manufacturing, Construction, etc.) • Business Scenarios (IT Governance, Product development) enablement • Aligning the IT initiatives with business objectives • Quality Management • Change Management • Domain expertise • Agile Approach • Personalized Training • Regulatory Compliance • Aligned with PMI OPM3 & PMBOK Project Management Powering your digital initiatives which enhance marketing effectiveness, customer experiences, technology-led innovation, and business productivity Solution implementation Portfolio management solutions Innovation management Integration, customization, mobility and development Reporting and dashboards Centers of Excellence Technology business consulting Mobile, devices & cloud Enterprise Project Management Office 365 & SharePoint Applications development Web & Digital 2005 Advaiya is founded 3 Locations: Redmond, Dubai, and India 45+ Clients 5000+ Deliverables 1200+ Project Completed Our EPM Offerings Our featured offerings Deep Technology ExpertiseIndustry Sensitive SolutionsExtensive Project Background Who we are
- 6. Common terms and concepts
- 7. Power BI ecosystem Power BI Desktop - a Windows desktop application Power BI Services - an online SaaS (Software as a Service) service (formerly Power BI for Office 365, now PowerBI.com ) Power BI Apps - Mobile apps for Windows phones and tablets, as well as for iOS and Android devices Power BI Gateways - To sync external files with Power BI, you need to install Gateway on your machine, and sign-in to authenticate the data refresh Power BI REST API - Create apps that integrate with a Power BI dashboard in real-time using REST calls.
- 8. Power BI - Building blocks Creating (using Power BI Desktop) Datasets Visualizations Reports Sharing (via PowerBi.com and Power BI gateways) Dashboards Workspaces Content Packs Consuming (via mobile apps) Tiles Apps
- 9. Natural Query Language Query your data using simple English language, and get instant results from underlying datasets. Change the outcome on the go to reach to the desired insight.
- 10. Dashboards Dashboards - A single canvas with tiles from one or more reports. In Dashboards, you can query your data (Q & A)
- 11. Power BI visual gallery Provides a large number of pre-built ready-to- use visuals, available in the Custom Visual Gallery: https://app.powerbi.com/visuals/ You can create and submit your own custom visuals Can be published and used across the organization
- 12. Creating group workspaces Workspaces – The work area that you see on login All the Power BI elements are associated with some workspaces, either individual / personal workspaces (My Workspace), or shared (Group Workspaces) Shared Workspaces allows you to share and collaborate with others in your organization
- 13. Accessing PWA data using Power BI (via OData)
- 14. PWA data and how to access it (OData feed) Odata is an open data protocol which allows you to query the PWA data. https://<sharepointdomain>/<PWA site collection>/_api/projectdata https://<sharepointdomain>/<PWA site collection>/_api/projectdata/$metadat a
- 15. Natural Query Language This displays the data on basis of Query written as an English sentence “Project Name by assignment actual cost”.
- 16. Custom Visuals: Chiclet Slicer It is used to filter data in more visualizing way compared to normal Slicer.
- 17. Project Dashboards It displays data from various Reports about Assignments, Projects and their information Browser Version iPad Version
- 18. Demo
- 19. Questions ?
- 20. Upcoming Webinar: July Darrin Lange Director of Operations Advaiya Solutions Inc. Deep-dive project team collaboration with SharePoint team sites MPUG - July 26 @ 12:00 pm - 1:00 pm EST http://www.mpug.com/event/deep-dive-project-team-collaboration-with-sharepoint-team-sites/
- 21. Resources You're now well versed in all these important concepts: • What Power BI is • The building blocks of Power BI • Getting (Desktop) and modeling data • Getting (Services) and modeling data • Visualizations • Exploring data in the Power BI service • Using Excel and Power BI together • And publishing and sharing your work Here are some links to downloads or to get your browser connected to the Power BI service: • You can always get the latest Power BI Desktop • Heading to the Power BI service is easy • Getting mobile apps for Power BI is a tap away
- 22. Follow Us, Today! For more details, please e-mail to: Darrin Lange: Darrin.Lange@advaiya.com Contact us: ADVAIYA SOLUTIONS, INC. 411 108th Ave NE Ste 700 Bellevue, WA 98004 Phone: +1 (425) 256 3123
- 23. Thank you!
Notes de l'éditeur
- Why MS PowerBI? part of the MS ecosystem. Native to the tools already in use. What is the difference between a dashboard, report and widget? What is a content pack? What is a tile?
- In Dashboards, you can query your data using the Question and Answer feature. In this, you ask your queries in form of simple English language, and get instant results from underlying datasets, and even change it on-the-go. So suppose you have a bar graph in front, and you want to change the sorting order and apply additional filters, you can just type it in the QA box, and you will get the updated bar graph immediately. When would I use NQL? How long has this been around?
- What is a dashboard?
- What can I do with a workspace? Who is this for?
- In Dashboards, you can query your data using the Question and Answer feature. In this, you ask your queries in form of simple English language, and get instant results from underlying datasets, and even change it on-the-go. So suppose you have a bar graph in front, and you want to change the sorting order and apply additional filters, you can just type it in the QA box, and you will get the updated bar graph immediately.