
Recommandé
Recommandé
Contenu connexe
Tendances
Tendances (20)
Similaire à Joseph slides-for-20160601
Similaire à Joseph slides-for-20160601 (20)
Dernier
Dernier (20)
Joseph slides-for-20160601
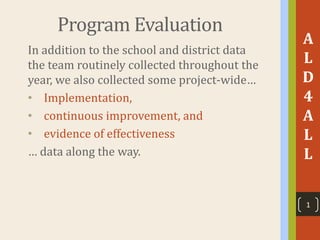
- 1. Program Evaluation In addition to the school and district data the team routinely collected throughout the year, we also collected some project-wide… • Implementation, • continuous improvement, and • evidence of effectiveness … data along the way. A L D 4 A L L 1
- 2. Program Evaluation • Implementation: The project was successfully implemented because it did more than it said it would do. • Continuous Improvement: The project continuously evolved and adapted to take advantage of new knowledge and opportunities. • Evidence of Effectiveness: The project demonstrated its value by the lasting changes it spearheaded and/or helped to bring about. A L D 4 A L L 2
- 3. A L D 4 A L L 9 Program Evaluation System-wide Indicator Assessment Results from Inquiry Process • School-by-School to get a sense of how good schools distribute effort, focus, and resources • Process included open-coding and axial sorting techniques
- 4. A L D 4 A L L 9 Program Evaluation Program-wide indicator assessment of all included schools System-wide Indicator Assessment Results from Inquiry Process
- 5. Professional Learning Content 1. Content was relevant… 2. The content was organized and meaningful… 3. Content will be helpful to me in my role as an educator of diverse students… 4. The content will help me to improve how I teach or work with diverse students and families… 5. I will be able use the content to raise the my level of activity, advocacy, understanding, or quality of performance in the service of diverse students. Professional Learning Process 6. Facilitator(s) used engaging activities, strategies, or methods... 7. Facilitator(s) ensured that I was a participant in the process… 8. Good use of materials, visuals, and/or artifacts…. A L D 4 A L L 9 Program Evaluation
- 6. A L D 4 A L L 9 Program Evaluation Q1 Q2 Q3 Q4 Q5 Q6 Q7 Q8 Average 9 9.01 9.17 9.02 9.03 9.01 8.89 8.96 0 1 2 3 4 5 6 7 8 9 10 Professional Learning feedback results for 2014 – 2016 Note. N=144. Started gathering data using feedback forms in 2014. Generally highly positive feedback rate, but what else does it mean?
- 7. Teacher Self- Assessment Scales (TSAS) • Online and paper questionnaire • Based on NMTEACH (four domains) and Teacher Efficacy • Schools receive a personalized report • Provides results based on highs and lows for each element A L D 4 A L L 9 Program Evaluation
- 8. TSAS program-wide results for 2014 - 2016 A L D 4 A L L 9 Program Evaluation
- 9. TSAS program-wide results for 2014 - 2016 A L D 4 A L L 9 Program Evaluation Fall 2014 Spring 2015 Fall 2015 Spring 2016 ALD4ALL 86.67 88.7 83.2 91.23 ALL 79.12 84.38 85.02 72 74 76 78 80 82 84 86 88 90 92 94 ALD4ALL schools versus non-ALD4ALL TSAS dataset
- 10. TSAS program-wide results for 2014 - 2016 A L D 4 A L L 9 Program Evaluation 1A. 1B. 1C. 1D. 1E. 1F. FALL_2014 82.85 84.66 82.2 85.5 86.32 82.38 SPRING_2015 87.98 87.45 87.38 89.48 90.5 84.74 FALL_2015 81.02 81.59 81.79 83.26 83.85 79.9 SPRING_2016 89.08 89.4 88.46 90.12 90.73 86.25 80 82 84 86 88 90 92 Example of trend lines using Domain 1
- 11. TSAS program-wide results for 2014 - 2016 A L D 4 A L L 9 Program Evaluation Example of trend lines combining Spring and Fall 2015, using Domain 3 as an example. 3A. 3B. 3C. 3D. 3E. ALD4ALL _2014 87.61 85.26 87.82 86.47 87.88 ALD4ALL _2015 85.58 82.31 83.97 81.66 85.18 ALD4ALL _2016 92.25 89.13 91.25 87.94 92.35 70 75 80 85 90 95
- 12. TSAS program-wide PD-Related TSAS results for 2014 - 2016 A L D 4 A L L 9 Program Evaluation Teacher Efficacy differences by participation in ALD4ALL Professional Learning activities. 1 2 3 4 5 6 PD YES 86.72 86.55 85.57 87.78 87.12 83.39 PD NO 81.57 82.68 83.89 83.27 85.18 79.7 74 76 78 80 82 84 86 88 90
- 13. TSAS program-wide results for 2014 - 2016 A L D 4 A L L 9 Program Evaluation Just another view: Teacher Efficacy differences by participation in ALD4ALL Professional Learning activities. 1 2 3 4 5 6 PD YES 86.72 86.55 85.57 87.78 87.12 83.39 PD NO 81.57 82.68 83.89 83.27 85.18 79.7 74 76 78 80 82 84 86 88 90
Notes de l'éditeur
- Joseph Note to Susana: All of my evaluation slides start at position/slide #7.
- Joseph
- Joseph: Adapted form system categories established by Karen Cadiero-Kaplan.
- Joseph: Adapted form system categories established by Karen Cadiero-Kaplan. Assumption: Overall, these good schools are highest in 1, 2, 3, and 4; lower in 5 and 6.
- Joseph: Online and paper-based questionnaire. Available at ald4all.org. Questions are condensed for quick review.
- Joseph: Strong on all items, but strongest on Q3: Content will be helpful to me in my role as an educator of diverse students… There’s no diminishing the quality of service provided by facilitators, but there’s something else at work here, too. More than anything, chart suggests that educators were hungry for this kind of content and process. For example, participants may not consider the professional learning content so highly if they were already getting a sufficient amount.
- Joseph: Schools receive reports that includes the breakdown of what they said. They’re the experts.
- Joseph: Highs and Lows from aggregated ALD4ALL program-wide results.
- Joseph: ALD4ALL school self-ratings compared to non-ALD4ALL schools. ALD4ALL, or higher performing schools, seem to have greater levels of teacher efficacy aligned to the NMTEACH Educator Effectiveness System evaluation criteria.
- Joseph: Highs and Lows
- Joseph: Highs and Lows
- Joseph: Highs and Lows
- Joseph: Just another view that more clearly shows that teachers participating in ALD4ALL professional learning activities.
- Joseph: ALD4ALL Website Susana: This slide replaces the website slide toward the end