15 points) American Fuel Oil is a distributor of fuel-oil products i.pdf
•
0 j'aime•3 vues
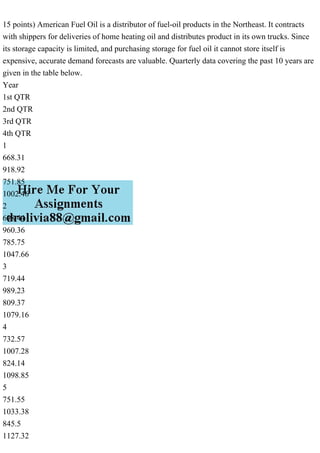
American Fuel Oil distributes home heating oil in the Northeast US using contracted shippers and its own trucks. Accurate demand forecasts are important because the company has limited storage capacity and renting additional storage is expensive. Quarterly demand data over the past 10 years is provided. The document asks to develop forecasts using a 4-quarter moving average and exponential smoothing with seasonality (Holt-Winters), and recommend which forecast to use.
Signaler
Partager
Signaler
Partager
Télécharger pour lire hors ligne

Recommandé
Recommandé
Contenu connexe
Plus de allwayscollection
Plus de allwayscollection (20)
17.16 Uno de los inconvenientes de la televisi�n por sat�lite es....pdf
17.16 Uno de los inconvenientes de la televisi�n por sat�lite es....pdf
16.Sophia est� muy molesta. Le ha contado a su maestra sobre mensaje.pdf
16.Sophia est� muy molesta. Le ha contado a su maestra sobre mensaje.pdf
16. The Plainfield Company has a long-term debt ratio (i.e., the rat.pdf
16. The Plainfield Company has a long-term debt ratio (i.e., the rat.pdf
15.Durante el per�odo de julio a diciembre, el mismo Hospital mencio.pdf
15.Durante el per�odo de julio a diciembre, el mismo Hospital mencio.pdf
15. valor 10.00 puntos Informaci�n requerida El enfoque c.pdf
15. valor 10.00 puntos Informaci�n requerida El enfoque c.pdf
15. A principios de 2021, Waterway Industries hab�a retenido gananci.pdf
15. A principios de 2021, Waterway Industries hab�a retenido gananci.pdf
14. Essay Using the following information f�Using the followi.pdf
14. Essay Using the following information f�Using the followi.pdf
14. Mary es una maestra de secundaria jubilada de 72 a�os. Ella in.pdf
14. Mary es una maestra de secundaria jubilada de 72 a�os. Ella in.pdf
13. Alan, Bruce and Connie want to combine their property in a new c.pdf
13. Alan, Bruce and Connie want to combine their property in a new c.pdf
13. La revisi�n judicial de las decisiones de las agencias gira en t.pdf
13. La revisi�n judicial de las decisiones de las agencias gira en t.pdf
13. It is year 1225 and Easter Islanders are crafting their now well.pdf
13. It is year 1225 and Easter Islanders are crafting their now well.pdf
20) The antibiotic penicillin is isolated from ________.A) B. subt.pdf
20) The antibiotic penicillin is isolated from ________.A) B. subt.pdf
2.1 Estudio de caso un l�der emergente Tim T. retrata su vida com.pdf
2.1 Estudio de caso un l�der emergente Tim T. retrata su vida com.pdf
2.4 CollaboratorsThe company should also understand the relationsh.pdf
2.4 CollaboratorsThe company should also understand the relationsh.pdf
2. �Cu�l de los siguientes no es un rasgo de alta inteligencia cultu.pdf
2. �Cu�l de los siguientes no es un rasgo de alta inteligencia cultu.pdf
2. Write a Python program to remove characters that have odd index v.pdf
2. Write a Python program to remove characters that have odd index v.pdf
2. Use uno de los enfoques de generaci�n de ideas presentados en est.pdf
2. Use uno de los enfoques de generaci�n de ideas presentados en est.pdf
Dernier
God is a creative God Gen 1:1. All that He created was “good”, could also be translated “beautiful”. God created man in His own image Gen 1:27. Maths helps us discover the beauty that God has created in His world and, in turn, create beautiful designs to serve and enrich the lives of others.
Explore beautiful and ugly buildings. Mathematics helps us create beautiful d...
Explore beautiful and ugly buildings. Mathematics helps us create beautiful d...christianmathematics
Making communications land - Are they received and understood as intended? webinar
Thursday 2 May 2024
A joint webinar created by the APM Enabling Change and APM People Interest Networks, this is the third of our three part series on Making Communications Land.
presented by
Ian Cribbes, Director, IMC&T Ltd
@cribbesheet
The link to the write up page and resources of this webinar:
https://www.apm.org.uk/news/making-communications-land-are-they-received-and-understood-as-intended-webinar/
Content description:
How do we ensure that what we have communicated was received and understood as we intended and how do we course correct if it has not.Making communications land - Are they received and understood as intended? we...
Making communications land - Are they received and understood as intended? we...Association for Project Management
Dernier (20)
This PowerPoint helps students to consider the concept of infinity.
This PowerPoint helps students to consider the concept of infinity.
On National Teacher Day, meet the 2024-25 Kenan Fellows
On National Teacher Day, meet the 2024-25 Kenan Fellows
Explore beautiful and ugly buildings. Mathematics helps us create beautiful d...
Explore beautiful and ugly buildings. Mathematics helps us create beautiful d...
Mixin Classes in Odoo 17 How to Extend Models Using Mixin Classes
Mixin Classes in Odoo 17 How to Extend Models Using Mixin Classes
Unit-V; Pricing (Pharma Marketing Management).pptx
Unit-V; Pricing (Pharma Marketing Management).pptx
Making communications land - Are they received and understood as intended? we...
Making communications land - Are they received and understood as intended? we...
Food safety_Challenges food safety laboratories_.pdf
Food safety_Challenges food safety laboratories_.pdf
Asian American Pacific Islander Month DDSD 2024.pptx
Asian American Pacific Islander Month DDSD 2024.pptx
15 points) American Fuel Oil is a distributor of fuel-oil products i.pdf
- 1. 15 points) American Fuel Oil is a distributor of fuel-oil products in the Northeast. It contracts with shippers for deliveries of home heating oil and distributes product in its own trucks. Since its storage capacity is limited, and purchasing storage for fuel oil it cannot store itself is expensive, accurate demand forecasts are valuable. Quarterly data covering the past 10 years are given in the table below. Year 1st QTR 2nd QTR 3rd QTR 4th QTR 1 668.31 918.92 751.85 1002.46 2 698.44 960.36 785.75 1047.66 3 719.44 989.23 809.37 1079.16 4 732.57 1007.28 824.14 1098.85 5 751.55 1033.38 845.5 1127.32
- 2. 6 790.03 1086.3 888.78 1185.05 7 813.8 1118.97 915.52 1220.7 8 828.93 1139.79 932.55 1243.41 9 866.16 1190.97 974.43 1299.24 10 891.47 1225.77 1002.91 1337.2 a. Develop an appropriate forecast using a 4-quarter moving-average approach. b. Develop an appropriate forecast using exponential smoothing with and cyclicality (Holt- Winters method). (alpha=.2,beta=.5, and gamma=.6) c. Which of the two forecasts developed above would you recommend using? Year 1st QTR 2nd QTR 3rd QTR 4th QTR 1