Recommandé

Recommandé
Contenu connexe
Plus de amrahlifestyle
Plus de amrahlifestyle (17)
Dernier
Dernier (20)
Scatterplot Line Not Least Squares - Averages Don't Intersect
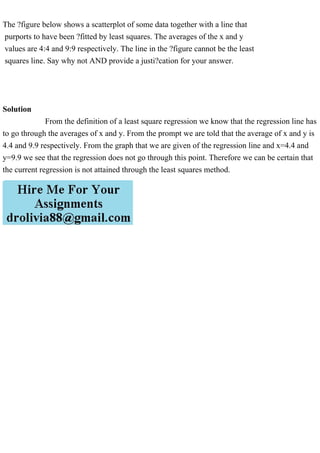
- 1. The ?figure below shows a scatterplot of some data together with a line that purports to have been ?fitted by least squares. The averages of the x and y values are 4:4 and 9:9 respectively. The line in the ?figure cannot be the least squares line. Say why not AND provide a justi?cation for your answer. Solution From the definition of a least square regression we know that the regression line has to go through the averages of x and y. From the prompt we are told that the average of x and y is 4.4 and 9.9 respectively. From the graph that we are given of the regression line and x=4.4 and y=9.9 we see that the regression does not go through this point. Therefore we can be certain that the current regression is not attained through the least squares method.