SlideShare une entreprise Scribd logo
1  sur  88
Quality of Life Among Asian American Youth
Chris Fradkin and Jan L. Wallander
University of California, Merced
Yoshimi Yamakawa
National Center for Chronic Disease Prevention and Health
Promotion, Centers for Disease Control and Prevention, Atlanta,
Georgia
David C. Schwebel
University of Alabama at Birmingham
Alyna Chien
Harvard Medical School
Yen-Chi L. Le and Dennis H. Li
University of Texas, School of Public Health, Houston
Marc Elliott
RAND Corporation, Santa Monica, California
Mark Schuster
Harvard Medical School and RAND Corporation, Santa Monica,
California
The aims of the present study were to examine whether Asian
American youth experience disparities in
quality of life (QL) compared with Hispanic, African American,
and white youth in the general
population and to what extent socioeconomic status (SES)
mediates any disparities among these
racial/ethnic groups. Data were obtained from the Healthy
Passages study, in which 4,972 Asian
American (148; 3%), Hispanic (1,813; 36%), African American
(1,755; 35%), and white (1,256; 25%)
fifth-graders were enrolled in a population-based, cross-
sectional survey conducted in three U.S.
metropolitan areas. Youth reported their own QL using the
PedsQL and supplemental scales. Parents
reported youth’s overall health status as well as parent’s
education and household income level. Asian
American youth experienced worse status than white youth for
three of 10 QL and well-being measures,
better status than Hispanic youth on six measures, and better
status than African American youth on three
measures. However, the observed advantages for Asian
American youth over Hispanic and African
American youth disappeared when the marked SES differences
that are also present among these
racial/ethnic groups were taken into account. In contrast, the
differences between Asian American and
white youth remained after adjusting for SES. These findings
suggest that the disparities in QL that favor
white youth over Asian American youth exist independent of
SES and warrant further examination. In
contrast, the QL differences that favor Asian American over
Hispanic and African American youth may
be partly explained by SES. Interpretations are limited by the
heterogeneity existing among Asian
Americans.
Keywords: Asian American, youth, disparities, quality of life,
socioeconomic status
This article was published Online First October 8, 2012.
Chris Fradkin and Jan L. Wallander, Psychological Sciences,
Center of
Excellence on Health Disparities, and Health Sciences Research
Institute,
University of California, Merced; Yoshimi Yamakawa, National
Center for
Chronic Disease Prevention and Health Promotion, Centers for
Disease
Control and Prevention, Atlanta, GA; David C. Schwebel,
Department of
Psychology, University of Alabama at Birmingham; Alyna
Chien, Division
of General Pediatrics, Children’s Hospital Boston and
Department of
Pediatrics, Harvard Medical School; Yen-Chi L. Le and Dennis
H. Li,
University of Texas School of Public Health, Houston; Marc
Elliott,
RAND Corporation, Santa Monica, CA; Mark Schuster,
Division of Gen-
eral Pediatrics, Children’s Hospital Boston, Department of
Pediatrics,
Harvard Medical School, and RAND Corporation.
The contributions made to this research by study participants in
the
Birmingham, Houston, and Los Angeles areas, other Healthy
Passages
investigators, field teams at each site, and the CDC Division of
Ado-
lescent and School Health are gratefully acknowledged. The
Healthy
Passages study is funded by the Centers for Disease Control
(CDC) and
Prevention, Prevention Research Centers (Cooperative
Agreements
U19DP002663, U19DP002664, and U19DP002665). The
findings and
conclusions in this report are those of the authors and do not
necessarily
represent the official position of the CDC. Dr. Yen-Chi Le is
supported
by a National Cancer Institute (NCI) postdoctoral research
fellowship at
the University of Texas School of Public Health Cancer
Education and
Career Development Program (NCI R25 CA57712). The authors
have
no conflict of interest to disclose. No author received any form
of
payment to produce this paper.
Correspondence concerning this article should be addressed to
Jan L.
Wallander, UC Merced, 5200 North Lake Road, Merced, CA
95343.
E-mail: [email protected]
T
hi
s
do
cu
m
en
t
is
co
py
ri
gh
te
d
by
th
e
A
m
er
ic
an
P
sy
ch
ol
og
ic
al
A
ss
oc
ia
ti
on
or
on
e
of
it
s
al
li
ed
pu
bl
is
he
rs
.
T
hi
s
ar
ti
cl
e
is
in
te
nd
ed
so
le
ly
fo
r
th
e
pe
rs
on
al
us
e
of
th
e
in
di
vi
du
al
us
er
an
d
is
no
t
to
be
di
ss
em
in
at
ed
br
oa
dl
y.
Asian American Journal of Psychology © 2012 American
Psychological Association
2014, Vol. 5, No. 1, 13–21 1948-1985/14/$12.00 DOI:
10.1037/a0029822
13
In the United States, Asian American children and adolescents
are frequently referred to as the model minority (Ishii-Kuntz,
Gomel, Tinsley, & Parke, 2010; Wong & Halgin, 2006; Yoo,
Burrola, & Steger, 2010). However, this characterization may
primarily reflect Asian Americans’ educational achievements
and
physical health, which are better on average than other racial/
ethnic groups (e.g., Bloom, Dey, & Freeman, 2006; Caplan,
Choy,
& Whitmore, 1991; Hsia, 1988; Yu & Vyas, 2009; Zhou,
Peverly,
Xin, Huang, & Wang, 2003). In terms of psychosocial health
and
well-being, Asian American youth, as a group, may not appear
to
be a model. Indeed, in many areas Asian American youth’s psy-
chosocial functioning is well below that of non-Hispanic white
youth’s and is in the range of Hispanic and non-Hispanic
African
American youth (Yeh et al., 2002).
Whereas studies have provided insights into specific aspects of
Asian American youth’s health (e.g., depression, social well-
being,
anxiety), there is no study we are aware of that informs about
broadly construed health and well-being in the youth of this
growing population group, which currently constitutes 5% of
the
U.S. population (Humes, Jones, & Ramirez, 2011). The World
Health Organization (1948) defines health as “a complete state
of
physical, mental, and social well-being, not merely the absence
of
disease.” Quality of life (QL) is an organizing concept that
matches well this broad perspective on health and well-being.
As
applied to children and adolescents, it reflects an individual’s
wellness across multiple domains of life, including at a
minimum
physical, emotional, and social (Koot & Wallander, 2001). QL
may also include information about their role functioning, for
example in school and with family (Koot and Wallander (2001).
Current Knowledge on Quality of Life in Asian
American Youth
QL has been used to examine the well-being of various groups
of youth and adolescents in the population. To date, in the
United
States, QL research with children and adolescents that examines
racial/ethnic disparities has focused on differences across the
three
largest racial/ethnic groups in the country (Olson, Lara, &
Frintner,
2004), non-Hispanic Whites (63.7%), non-Hispanic African
Amer-
ican (12.6%), and Hispanics (16.3%) (Humes et al., 2011). Al-
though some QL studies have included Asian American youth in
their samples (e.g., Cremeens, Eiser, & Blades, 2006; Varni,
Limbers, & Burwinkle, 2007), there is no study we are aware of
that has reported on the QL of this group specifically or
disparities
that may exist between Asian American youth and other groups.
Research has been conducted, however, reporting differences
be-
tween Asian American children adolescents and other
racial/ethnic
groups in specific dimensions of the physical, emotional, and
social domains usually constituting QL.
In the area of physical health, studies find Asian American
youth generally healthier than their non-Asian peers in almost
every measurement. For example, Asian American youth have
lower morbidity rates than non-Hispanic whites (Yu & Vyas,
2009). They also have the highest rates of “no missed school
days”
in comparison with other racial/ethnic groups (Bloom et al.,
2006).
Asian American youth have lower rates of chronic and
congenital
diseases than non-Hispanic white youth (Yu & Vyas, 2009). In
addition, data from the 2005 National Health Interview Survey
indicate that parents of Asian American youth rate their health
higher, with only 0.4% describing them as being of “fair or
poor”
health, in contrast to parents of non-Hispanic white (1.5%),
non-
Hispanic African American (3.3%), and Hispanic (3.2%)
children
(Bloom et al., 2006). In terms of weight class, Asian American
adolescent girls report less than half the rates of obesity than
non-Hispanic White girls (4% and 10%, respectively) (Wang &
Beydoun, 2007).
In contrast to these positive findings in the physical domain for
Asian American children and adolescents, other studies show
that
they experience substandard psychosocial health in comparison
with other racial/ethnic groups (Chang, Morrissey, &
Koplewicz,
1995; Onoda, 1977; Pang, 1991; Rhee, Chang, & Rhee, 2003).
Higher rates have been reported among Asian American youth
in
depression (Centers for Disease Control & Prevention, 1995,
1997;
Chang et al., 1995) and anxiety (Onoda, 1977; Pang, 1991), as
well
as lower self-esteem (Greene, Way, & Pahl, 2006; Rhee et al.,
2003). High prevalences of fighting and suicidal ideation have
also
been reported among Asian American/Pacific Islander high
school
students (Grunbaum, Lowry, Kann, & Pateman, 2000). The
liter-
ature finds high rates of anxiety, depression, and social stress
among Chinese American adolescents in contrast to their non-
Asian American peers (Zhou et al., 2003). In terms of social
well-being, Asian American high school students report high
rates
of on-campus discrimination and harassment from their non-
Hispanic African American and Hispanic peers (Rosenbloom &
Way, 2004). Most of this research, however, has focused on
adolescents (about 12–18 of age). There has been a dearth of
research on younger children, especially just prior to the
transition
to adolescence.
Although the literature on Asian American youth presents find-
ings suggestive of better physical and poorer psychosocial
health,
it also reports considerable variation in health within this group
(Gong-Guy, 1987; Yu, Huang, & Singh, 2004). Asian
Americans,
although often treated as such, are not a homogeneous ethnic
group. Most obvious is that their heritage is rooted in quite
different regions and cultures, ranging from India and Pakistan
to
Korea and Japan and many different locations in between. In
addition, Asian American youth may have very different levels
of
acculturation, ranging from those who were born and partially
raised in their country of origin and who are still closely
immersed
in their home culture, to those whose families have resided in
the
United States for five generations or more and who are very
much
integrated into the majority U.S. culture. For these reasons, the
diversity of Asian Americans challenges research. Even a large
sample study would have to significantly oversample Asian
Amer-
icans to be able to make even gross differentiations within this
group.
Current Study
We acknowledge that the present study, like most others pre-
ceding it, is unable to make finer discriminations within the
Asian
American group, as desirable as that would be. Yet this study
provides a distinct opportunity to examine QL broadly in a
sizable
sample of Asian American youth at an important specific point
in
development, in fifth grade toward the end of elementary school
and prior to the transition to middle school. Therefore, this
infor-
mation can provide a baseline against which to illuminate
changes
that may occur during adolescence. We take advantage of the
T
hi
s
do
cu
m
en
t
is
co
py
ri
gh
te
d
by
th
e
A
m
er
ic
an
P
sy
ch
ol
og
ic
al
A
ss
oc
ia
ti
on
or
on
e
of
it
s
al
li
ed
pu
bl
is
he
rs
.
T
hi
s
ar
ti
cl
e
is
in
te
nd
ed
so
le
ly
fo
r
th
e
pe
rs
on
al
us
e
of
th
e
in
di
vi
du
al
us
er
an
d
is
no
t
to
be
di
ss
em
in
at
ed
br
oa
dl
y.
14 FRADKIN ET AL.
Healthy Passages project for this purpose, which is a
prospective
longitudinal cohort study tracking health risk indicators and
their
correlates in youth from 5th grade through 10th grade. This
project
was designed to examine disparities among Hispanic, non-
Hispanic African American, and non-Hispanic white youth but
did
not exclude members of other ethnic groups in the catchment
areas
from enrolling. Thus this study enrolled Asian American youth
in
sufficient numbers to enable comparison of them to age peers
from
the other three major racial/ethnic groups. The rationale and
meth-
ods of Healthy Passages are detailed elsewhere (Windle et al.,
2004).
This study will thus examine Asian American youth’s QL
within the three core domains of wellness—physical, emotional,
and social—plus the school domain. Wellness in the school do-
main is important because within this environment occur
important
interactions with both peers and nonfamilial figures of authority
(teachers) as well as preparation for future productivity. To sup-
plement information about QL and in light of previous findings
on
Asian American youth’s psychosocial and physical functioning,
we also examine youth’s self-concept, social integration, and
stan-
dard overall health status. We also examine possible race/
ethnicity-by-gender interactions and adjust comparisons for
socio-
economic differences that may exist among racial/ethnic groups.
Thus with the specific aim to examine differences that may
exist in
QL between Asian American youth and their non-Asian peers,
based on existing literature we expect that the Asian American
youth will report physical QL in the range of the non-Hispanic
white majority population. We further expect that this group
will
report psychosocial QL (emotional, social, and school domains)
in
the range of the Hispanic and non-Hispanic African American
minority populations.
Method
Sample and Procedures
Data for the analysis are available at this time from Wave I of
the Healthy Passages study (Windle et al., 2004), collected in
2004 –2006. Recruitment into Healthy Passages was designed to
enroll about equal representation of the three largest
racial/ethnic
groups in the U.S: Hispanic, non-Hispanic African American,
and
non-Hispanic white. Thus, participants were recruited from
public
schools in (1) 10 contiguous public school districts in and
around
Birmingham, Alabama, (2) 25 contiguous public school districts
in
Los Angeles County, California, and (3) the largest public
school
district in Houston, Texas. Eligible schools had an enrollment
of at
least 25 fifth-graders, representing more than 99% of students
enrolled in regular classrooms in the three areas. Information
was
disseminated to the 5th grade students in the 118 selected
schools,
with 11,532 students, to bring to their parents (or caregivers).
Permission to be contacted was returned by 6,663, of which
5,147
(77%) completed both a parent and a child interview. However,
enrollment was not limited to Hispanic, African American, and
White children, resulting in 6% belonging to an “other” racial/
ethnic group (see below for racial/ethnic classification). Among
this group, 46% were classified as Asian American. Excluding
all
others resulted in 4,972 in the analysis sample, with an
unweighted
distribution based on Census-style classification of: Asian
Amer-
ican � 3% (n � 148), Hispanic � 36% (1,813), non-Hispanic
African American � 35% (1,755), and non-Hispanic white �
25%
(1,256). Child age M � 11.12 (SD � .56), and 51% were boys.
The Asian American group had an unweighted geographic
distri-
bution of Los Angeles � 49% (n � 72), Houston � 35% (n �
52),
and Birmingham � 16% (n � 24) and included 12 youth
identified
as Native Hawaiian or Pacific Islander (NH/PI). Additional
demo-
graphics appear in Table 1.
Procedures
This research was conducted in compliance with APA ethical
standards in the treatment of participants and was approved by
the
Institutional Review Boards at the three study sites and the
Centers
for Disease Control and Prevention. Two trained interviewers
administered the full Healthy Passages assessment protocol with
the child and parent separated in private spaces at their home or
a
research facility using both computer-assisted personal
interview
and self-interview methods. The parent could choose whether
material would be presented in English or Spanish. The
following
variables were used in this study.
Measures
Quality of life (QL) was measured with the self-report form of
the Pediatric Quality of Life Inventory Version 4.0 (PedsQL;
Varni, Seid, & Kurtin, 2001), a widely used, well-validated
mea-
sure of QL in children and adolescents. For example, in a study
involving 10,241 children and adolescents, including 1.204
Asian/
Pacific Islanders (Varni, Burwinkle, Seid, & Skarr, 2003), the
PedsQL demonstrated high construct validity, with healthy
youth
reporting significantly higher QL in all domains than
chronically
ill peers. After translation and validation, the PedsQL has been
used to measure QL in at least 63 cultures outside the U.S,
including more than 10 in South and East Asia. Results from
these
applications have yielded results consistent with theoretical
expec-
tations, thus supporting the construct validity of the instrument
in
a variety of cultures. The PedsQL provides six scores, including
subscale scores for Physical (8 items, � .72 [all �s are reported
for
the current study sample]), Emotional (5 items, � � .71), Social
(5
items, � � .76), and School (5 items, � � .66) QL as well as a
composite Psychosocial QL (15 items, � � .84) score based on
the
last three subscales and a Total QL (23 items, � � .87) score
based
on all items. This hierarchical scale structure has been
replicated
across racial/ethnic groups, including 1,106 Asian American
chil-
dren and adolescents (Limbers, Newman, & Varni, 2009). Each
item posits a certain behavior being a problem in the past month
(e.g., Physical subscale: “it is hard for you to do sports activity
or
exercise”; Emotional subscale: “you feel afraid or scared”;
Social
subscale: “you have trouble getting along with other kids”;
School
subscale: “it is hard to pay attention in class”). Answers are
reported on a five-point scale (0 � never a problem, 4 � almost
always a problem), but scale scores are calculated such that a
higher score indicates better QL.
These traditional QL measures were complemented by mea-
sures of subjective well-being. Personal well-being was mea-
sured with two subscales of the Self-Perception Profile (SPP)
(Harter, 1983). The Global Self-Worth subscale (six items, � �
.70) is a measure of general self-perception. Construct validity
is supported by substantial differences in scores between
T
hi
s
do
cu
m
en
t
is
co
py
ri
gh
te
d
by
th
e
A
m
er
ic
an
P
sy
ch
ol
og
ic
al
A
ss
oc
ia
ti
on
or
on
e
of
it
s
al
li
ed
pu
bl
is
he
rs
.
T
hi
s
ar
ti
cl
e
is
in
te
nd
ed
so
le
ly
fo
r
th
e
pe
rs
on
al
us
e
of
th
e
in
di
vi
du
al
us
er
an
d
is
no
t
to
be
di
ss
em
in
at
ed
br
oa
dl
y.
15QUALITY OF LIFE AMONG ASIAN AMERICAN YOUTH
healthy youth and those with depression and anxiety problems
(Muris, Meesters, & Fijen, 2003). The Physical Appearance
subscale (6 items, � � .65) is used to measure the child’s
satisfaction with his or her physical appearance, in contrast to
the PedsQL Physical subscale, which is used to measure phys-
ical challenges and discomforts the child may be experiencing.
Construct validity for the Physical Appearance subscale is
supported for example by finding expected differences among
obese, overweight, and normal weight youth (Wallander et al.,
2009). These validity studies did not make any references to
including Asian American youth. For both subscales, youth are
asked for each item to identify which contrasting description
best fits them (e.g., Global Self-Worth subscale; “some kids
like the kind of person they are, other kids often wish they were
someone else”; Physical Appearance subscale: “some kids wish
their body was different, other kids like their body the way it
is”) and how much (sort of true, really true). Higher scores
indicate better personal well-being.
Social well-being was measured with the Social Anxiety Scale
for Children-Revised Fear of Negative Evaluation subscale (six
items, � � .88), which focuses on issues of interpersonal sensi-
tivity (e.g., “you worry about being teased”), using a five-point
scale (1 � not true at all, 5 � always true) (La Greca & Lopez,
1998). This subscale has demonstrated convergent validity, with
children with negative peer interactions reporting higher scores
than their more confident and better socialized peers (Ginsburg,
LA Greca, & Silverman, 1998). Although the larger U.S. ethnic
groups were included, the sample did not include Asian
American
youth. We reversed the subscale score, such that a higher score
indicated better social well-being.
Overall health status (OHS) was reported by the parent using
the
single item: “In general, would you say your child’s health is . .
..”
with a five-point response scale (excellent, very good, good,
fair,
poor). An association has been demonstrated between parents’
perception of their child’s health status and actual health status
(National Center for Health Statistics, 1972). Findings from the
use of this item in numerous child health surveys with
ethnically
diverse samples, including Asian American youth, have been
consistent with theoretical expectations and support its validity
as
a measure of OHS (Bauman, Silver, & Stein, 2006; Bramlett &
Blumberg, 2007; Kohen et al., 2007). Herein higher scores
indicate
better health status.
Table 1
Sample Demographics
Total analysis
sample
(n � 4,972)
Asian
American
(n � 148)
African
American
(n � 1,755)
Hispanic
(n � 1,813)
White
(n � 1,256)
Raw n Wtd % Wtd % Wtd % Wtd % Wtd %
Highest education by parent
�9th grade 678 18 0 2 39 0
Some high school 538 13 1 12 18 4
High school graduate 956 21 14 31 19 11
Some college or 2-yr. degree 1,298 24 20 37 17 23
Bachelor degree 800 14 30 13 5 35
�Bachelor degree 589 10 35 6 2 27
Household income as % FPL
�100% 1,559 38 15 47 50 7
100–199% 999 23 27 25 28 11
200–299% 616 13 10 14 12 13
300–399% 354 7 13 6 4 15
400–499% 338 6 16 4 3 15
�500% 709 13 19 5 3 40
Youth’s generational status
Born in United States 4,490 90 71 99 81 97
Born outside United States 450 10 29 1 19 3
Caregiver’s generational status
Born in United States 3,262 60 18 96 22 93
Born outside United States 1,677 40 82 4 78 7
Household size (Mdn) — 4 4 4 5 4
Family structure
Two biological parents 2,284 48 66 21 57 65
Other 2,652 52 35 79 43 35
English spoken in home (if no, self-rated
proficiency level)
Yes 3,000 54 18 96 10 91
No/Very well 526 11 32 3 17 5
No/Well 389 9 39 1 16 4
No/Not well 696 18 11 0 39 0
No/Not at all 321 9 0 0 20 0
Note. Sample constituted by Asian American, African
American, Hispanic, or White participants in Healthy Passages
Wave 1; n � 4,972 (unweighted
cases); % is calculated with weights to reflect sampling. FPL �
Federal Poverty Level.
T
hi
s
do
cu
m
en
t
is
co
py
ri
gh
te
d
by
th
e
A
m
er
ic
an
P
sy
ch
ol
og
ic
al
A
ss
oc
ia
ti
on
or
on
e
of
it
s
al
li
ed
pu
bl
is
he
rs
.
T
hi
s
ar
ti
cl
e
is
in
te
nd
ed
so
le
ly
fo
r
th
e
pe
rs
on
al
us
e
of
th
e
in
di
vi
du
al
us
er
an
d
is
no
t
to
be
di
ss
em
in
at
ed
br
oa
dl
y.
16 FRADKIN ET AL.
For race/ethnicity, the parent was asked whether the child be-
longs to any of the following categories: American
Indian/Alaskan
Native, Asian, African American, Hispanic/Latino, Native
Hawai-
ian/Pacific Islander, White, or other. Using Census categories,
the
child was classified as Hispanic if the parent indicated Hispanic
ethnicity regardless of responses regarding race, and Asian and
Native Hawaiian/Pacific Islanders were combined into the Asian
American category. Youth not categorized as Hispanic were
clas-
sified as African American, white, Asian American, or other,
with
the latter group being excluded from the analysis.
Because socioeconomic status (SES) is multifaceted (Chen,
Martin, & Matthews, 2006), no single variable adequately
captures
this construct, especially for racial/ethnic minorities (Kauffman,
Cooper, & McGee, 1997; Williams, 1999). An SES composite
index was formed as the average of standardized parent reported
highest level of education completed (six categories, treated lin-
early) and standardized household income transformed as
percent
of federal poverty level (continuous).
Data Analysis
All 10 scale scores used to measure QL well-being, and health
were retained for the primary analysis, but to reduce the
likelihood
of spurious results resulting from correlated measures, a
Bonfer-
roni corrected significance level of p � .005 (.05/10) was used.
These outcome variables were measured on continuous scales,
with the exception of the five-point ordinal OHS scale, which
was
analyzed as linear. While descriptive information is provided
for
the outcome variables in their original measurement scales,
stan-
dardized Z-scores (M � 0.00, SD � 1.00) were used for all
analyses to enable comparisons across variables. All analyses
were
performed using SPSS Complex Sampling module with
weighted
data to adjust for the complex survey design, which included
clustered sampling of schools with unequal probability to
improve
the ability to estimate racial/ethnic disparities. The distribution
of
all model residuals adequately conformed to the assumptions for
the use of General Linear Model (GLM), which was applied to
each outcome measure.
Possible differences within the Asian American subgroup were
addressed first. Because NH/PIs can be argued to be culturally
distinct from other Asian American groups (e.g., Mau, Sinclair,
Saito, Baumhofer, & Kaholokula, 2009), preliminary analyses
were conducted to ascertain possible differences between the
NH/PI (n � 12) and the remaining Asian American (n � 136)
youth. Differences were found on only Global Self-Worth, with
Asian American youth reporting significantly higher than their
NH/PI peers. The absence of within group differences on the
nine
remaining measures suggested that the within groups variance
would likely be smaller than the variance between the four main
racial/ethnic groups. Thus, analysis proceeded on the
aggregated
subgroup (n � 148), thereby maximizing statistical power.
In the first step, the model consisted of main effects for race/
ethnicity (four categories) and gender (two categories) and their
interaction. However, because no interaction reached
significance
( p � .005), the interaction term was dropped from the model
and
the analysis was repeated with just the main effects. The main
effect for gender was retained in all models but is not of
substan-
tive interest and thus is not further addressed. In the second
step,
the GLM analysis included race/ethnicity and gender with
adjust-
ment for SES. Significant main effects for race/ethnicity were
examined by comparing Asian Americans to each of the other
three racial/ethnic groups, with Wald F tests with significance
set
at p � .005.
Results
Racial/Ethnic Disparities
Table 2 reports unadjusted descriptive statistics for the 10 out-
come variables, and Table 3 shows results from the unadjusted
and
adjusted GLM models, The standardized unadjusted means for
all
outcomes by race/ethnicity are graphed in Figure 1. As seen in
Table 3, there were significant unadjusted differences between
racial/ethnic groups for all 10 outcome measures, with eight
being
significant for the Asian American group. The finding of larger
between groups differences (eight) overall than differences
within
the Asian American group (one) supported the earlier decision
to
include the NH/PI youth in the Asian American subgroup. Post
hoc
analysis indicated that Asian American youth had better self-
Table 2
Unadjusted Means (SE) for Outcome Variables
Outcome measure Score range
Total analysis
sample Asian American African American Hispanic White
Quality of life
Total 0–100 78.28 (.323) 79.35 (.844) 76.89 (.444) 75.88 (.447)
81.01 (.561)
Physical 0–100 84.23 (.283) 83.56 (.748) 84.04 (.409) 81.95
(.469) 87.39 (.400)
Psychosocial 0–100 75.11 (.389) 77.11 (1.050) 73.08 (.528)
72.65 (.478) 77.60 (.700)
Emotional 0–100 70.70 (.489) 71.23 (1.479) 70.37 (.626) 67.52
(.584) 73.67 (.805)
Social 0–100 79.45 (.500) 82.61 (1.407) 76.64 (.656) 76.96
(.602) 81.59 (.824)
School 0–100 75.18 (.432) 77.47 (1.137) 72.23 (.581) 73.47
(.518) 77.54 (.806)
Personal well-being
Global self worth 6–24 19.53 (.083) 19.70 (.246) 19.15 (.105)
18.61 (.144) 20.66 (.125)
Physical appearance 6–24 17.80 (.119) 17.57 (.384) 18.08 (.104)
17.00 (.141) 18.56 (.196)
Social well-being 6–30 22.61 (.140) 21.76 (.488) 23.77 (.164)
21.44 (.214) 23.46 (.162)
Overall health status 1–5 4.07 (.027) 4.21 (.098) 3.97 (.029)
3.59 (.037) 4.51 (.033)
Note. Sample constituted by Asian American, African
American, Hispanic, or White participants in Healthy Passages
Wave 1; n � 4,972 (unweighted
cases). Higher values indicate better outcome on all variables.
T
hi
s
do
cu
m
en
t
is
co
py
ri
gh
te
d
by
th
e
A
m
er
ic
an
P
sy
ch
ol
og
ic
al
A
ss
oc
ia
ti
on
or
on
e
of
it
s
al
li
ed
pu
bl
is
he
rs
.
T
hi
s
ar
ti
cl
e
is
in
te
nd
ed
so
le
ly
fo
r
th
e
pe
rs
on
al
us
e
of
th
e
in
di
vi
du
al
us
er
an
d
is
no
t
to
be
di
ss
em
in
at
ed
br
oa
dl
y.
17QUALITY OF LIFE AMONG ASIAN AMERICAN YOUTH
reported outcomes than Hispanic youth on six of the 10 outcome
measures, with ES ranging from small to medium. Also, Asian
American youth had better outcomes than African American
youth
on physical, social and school QL, with ES ranging from small
to
medium. Asian Americans had worse physical QL, global self-
worth, and social well-being compared to white youth. Asian
American youth also had worse social well-being than non-
Hispanic African American youth.
Adjusting for SES Differences
Table 1 shows there are differences in SES among the racial/
ethnic groups. As presented in Table 3, when adjusting for SES,
four of the 10 statistically significant racial/ethnic disparities in
the
outcome measures identified in the unadjusted analysis disap-
peared. Of the eight measures that were significantly different
among the Asian American group in the unadjusted analysis, all
but three disappeared when adjusting for SES. Previous
instances
of Asian American youth having better outcomes than Hispanic
and/or African American youth disappeared when adjusting for
SES differences. However, Asian American youth continued to
have worse physical QL, global self-worth, and social well-
being
than white youth and poorer social well-being than African
Amer-
ican youth. The standardized SES-adjusted means for all
outcomes
by race/ethnicity are graphed in Figure 1.
Discussion
This study demonstrates that there are substantial racial/ethnic
disparities in youth’s QL. Asian American youth experienced
worse status compared with white youth across three quite
differ-
ent domains of well-being—physical QL, global self-worth,
social
well-being—and experienced better status compared with His-
panic youth on six measures and African American youth on
three
measures. However the advantages for Asian American youth
over
Hispanic and African American youth disappeared when the
marked socioeconomic differences that are also present among
the
racial/ethnic groups were taken into account. Thus the observed
advantages attributed to Asian American youth may be largely
attributable to their advantageous, on average, SES compared
with
other racial/ethnic minority groups. In contrast, the differences
between Asian American and white youth remained after taking
into account these socioeconomic differences. In sum, these
find-
ings suggest that the disparities that favor white youth over
Asian
American youth exist independent of SES, in contrast to those
that
favor Asian American over Hispanic and African American
youth,
which may be explained by SES.
A theoretical rationale for the observed advantages attributed to
Asian American youth can be found in the social gradient theory
(Marmot, Rose, Shipley, & Hamilton, 1978). Foundational to
much of disparities research, this theory articulates the positive
and
significant relationship between health and SES. Framed within
this theory, the rationale for the observed advantages of Asian
American youth over Hispanic and African American youth may
be directly attributed to the socioeconomic differences between
the
groups, as evidenced by those advantages disappearing when
SES
is introduced into the model.
A rationale for why the disadvantages of Asian American youth
compared with white youth did not disappear when the same
differences between groups was taken into account poses a more
complex question that requires further research focused on this
question. One issue that may be considered is the universality of
the QL construct (Koot & Wallander, 2001) and whether QL can
be measured using the same instrument across cultures. We
argue
it is useful to do so for among other reasons to stimulate more
focused research into QL of disparate groups of youth. For
exam-
ple, interesting research has followed the finding of cross-
cultural
differences in parent-reported behavior problems in children
and
adolescents (Verhulst & Achenbach, 1995). As noted in its de-
scription previously, the PedsQL has considerable psychometric
support for its applicability in a variety of cultures. Yet subtle
differences in response style and reporting biases may exist that
contribute to between group differences and should be
examined.
Our findings challenge findings from previous studies. We had
expected Asian American youth to report physical QL in the
range
of the white youth. This was not the case, however, with the
Asian
American youth reporting poorer physical QL than the white
youth
in both the unadjusted and SES-adjusted models (d � �0.28 and
�0.25, respectively). Unexpected, too, was that there was no
disparity in emotional, social, or school QL between white and
Asian American youth in either the unadjusted or SES-adjusted
model. This was surprising because much of the literature (e.g.,
Rhee et al., 2003; Zhou et al., 2003) has suggested that Asian
American youth experience deficits in both emotional and social
areas. This discrepancy may be a result of our using a broad
Table 3
Disparities in Quality of Life, Well-Being, and Health
Associated With Race/Ethnicity
Outcome measure
Unadjusted
main effects
Race/Ethnicity
Wald F
SES adjusted
main effects
Race/Ethnicity
Wald F
Quality of life
Total 20.02�� —
AS � H
Physical 27.96�� 6.54��
W � AS W � AS
Psychosocial 15.66�� —
AS � AA, H
Emotional 12.97�� —
(n.s.)
Social 12.21�� —
AS � H, AA
School 15.02�� 5.97�
AS � H, AA (n.s.)
Personal well-being
Global self worth 45.59�� 9.21��
W � AS � H W � AS
Physical appearance 17.66�� 7.96��
(n.s.) (n.s.)
Social well-being 35.30�� 28.67��
AA, W � AS AA, W � AS
Overall health status 128.84�� 38.68��
AS � H (n.s.)
Note. Only significant results are reported; significant ( p �
.005) post
hoc group differences are reported in reference to Asian
American group;
n.s., post hoc difference not significant as referenced to Asian
American
group; � indicates better outcome; W � White (non-Hispanic);
AS �
Asian American; AA � African American (non-Hispanic); H �
Hispanic.
� p � .005. �� p � .001.
T
hi
s
do
cu
m
en
t
is
co
py
ri
gh
te
d
by
th
e
A
m
er
ic
an
P
sy
ch
ol
og
ic
al
A
ss
oc
ia
ti
on
or
on
e
of
it
s
al
li
ed
pu
bl
is
he
rs
.
T
hi
s
ar
ti
cl
e
is
in
te
nd
ed
so
le
ly
fo
r
th
e
pe
rs
on
al
us
e
of
th
e
in
di
vi
du
al
us
er
an
d
is
no
t
to
be
di
ss
em
in
at
ed
br
oa
dl
y.
18 FRADKIN ET AL.
measure of functioning in these domains, whereas previous re-
search has used more specific and focused measurements.
We did find, however, a disparity in some of our adjunct
psychosocial measures that favored white over Asian American
youth (global self-worth, social well-being) and African
American
over Asian American youth (social well-being) in both our
unad-
justed and SES-adjusted models. These findings are consistent
with the current literature that reports deficits in psychosocial
well-being among Asian American youth and adolescents.
Future
research might explore the relationship between these adjunct
measures (global self-worth, social well-being) and our
psychos-
ocial QL measures among Asian American and non-Asian Amer-
ican youth.
Future research might also explore the influence of parent–
child
relationship—and more specifically, parental expectation— on
Asian American youth’s QL. While the literature suggests that
parental expectation of Asian American children can be over-
whelming (Kibria, 1993) and is tied to increased risk of anxiety,
depression, and low self-esteem (Park & Kim, 2006), there is no
study that we know of that examines its influence on children’s
QL. Future research might explore this relationship both inside
and
outside the home. In light of this study’s finding of low social
well-being among Asian American youth, future research might
explore the quality of friends and social circles among Asian
American youth inside the school environment. Are there
notice-
able differences across racial/ethnic groups regarding social
sup-
port for youth in the school environment? This could be
especially
pertinent in light of the high rates of on-campus harassment
Asian
American students report from their African American and His-
panic peers (Rosenbloom & Way, 2004).
Among limitations in this research, first is the relatively small
size of the sample of Asian Americans here. Findings from this
study are therefore best viewed as preliminary and stimulation
for
further research. Moreover, as with the 2003–2004 National
Sur-
vey of Children’s Health (Kogan & Newacheck, 2007) and the
2001–2004 National Health and Nutrition Examination Survey
(Braun et al., 2008), our study had no survey materials for non-
English or non-Spanish speaking families. Hence, the least
accul-
-0.6
-0.4
-0.2
0.0
0.2
0.4
0.6
Q
L-
To
ta
l
Q
L-
P
h
ys
Q
L-
P
sy
ch
Q
L-
Em
o
Q
L-
So
ci
al
Q
L-
Sc
h
o
o
l
SP
P
-G
SW
SP
P -
P
A
So
ci
al
W
-B
O
H
S
Z
Asian-Amer
Afr-Amer
Hispanic
White
-0.6
-0.4
-0.2
0.0
0.2
0.4
0.6
Q
L-
To
ta
l
Q
L-
P
h
ys
Q
L-
P
sy
ch
Q
L-
Em
o
Q
L-
So
ci
al
Q
L-
Sc
h
o
o
l
SP
P
-G
SW
SP
P-
PA
So
ci
al
W
-B
O
H
S
Z
Asian-Amer
Afr-Amer
Hispanic
White
Figure 1. Z-score transformed means for outcome measures
across race/ethnicity. Upper panel, Unadjusted
means; Lower panel, Adjusted means. Higher values indicate
better outcome on all variables; SES used as a
covariate in adjusted model. QL, quality of life; Psych,
Psychosocial; Emo, Emotional; SPP, Self-Perception
Profile; GSW, Global-Self-Worth; PA, Physical Appearance; W-
B, Well-being; OHS, overall health status.
T
hi
s
do
cu
m
en
t
is
co
py
ri
gh
te
d
by
th
e
A
m
er
ic
an
P
sy
ch
ol
og
ic
al
A
ss
oc
ia
ti
on
or
on
e
of
it
s
al
li
ed
pu
bl
is
he
rs
.
T
hi
s
ar
ti
cl
e
is
in
te
nd
ed
so
le
ly
fo
r
th
e
pe
rs
on
al
us
e
of
th
e
in
di
vi
du
al
us
er
an
d
is
no
t
to
be
di
ss
em
in
at
ed
br
oa
dl
y.
19QUALITY OF LIFE AMONG ASIAN AMERICAN YOUTH
turated families of the pool were likely excluded from
participation
based on low proficiency of English. Another limitation of the
study is its aggregation of ethnically and culturally diverse
groups
into the entity we call “Asian American.” Studies (e.g., Barnes,
Adams, & Powell-Griner, 2008) show that there is sizable varia-
tion in many aspects of health among Chinese, Filipino, Asian
Indian, Japanese, Vietnamese, and Korean groups, yet like most
survey studies we were unable to disaggregate this group.
Another
possible influence on QL and health not examined in our study
is
acculturation. As a moderating and mediating variable,
accultura-
tion is influential in affecting children’s health. An example is
the
inverse relationship between acculturation and healthy weight
class among children and adolescents, with each successive gen-
eration more at risk for obesity (Popkin & Udry, 1998). It
should
be valuable to examine QL in relation to acculturation in future
research. Finally, whereas considerable support for the validity
of
the PedsQL and equivalence of the measurement structure in
different cultures exist already, future research would do well to
continue to examine the use of this and related measures across
cultures.
This study is the first we know of to examine differences
between Asian American and non-Asian youth in broadly
concep-
tualized QL, while accounting for socioeconomic contextual
fac-
tors. These types of measures may describe the health and well-
being of children and adolescents in the general population
more
comprehensively than conventional mortality and morbidity
mea-
sures and provide better identification of unrecognized
conditions,
social and emotional problems, and poor functioning (Koot &
Wallander, 2001; Szilagyi & Schor, 1998).
The March 2011 U.S. Census Brief (Humes et al., 2011) reports
that in the decade between 2000 and 2010 the Asian population
in
the United States “experienced the fastest rate of growth” of
any
racial/ethnic group. In light of these statistics, it will serve the
children of this group and our population as a whole to better
understand the challenges of health and well-being of Asian
Amer-
ican children.
References
Barnes, P. M., Adams, P. F., & Powell-Griner, E. (2008). Health
charac-
teristics of the Asian adult population: United States, 2004 –
2006.
Hyattsville, MD: National Center for Health Statistics, 1–24.
Bauman, L. J., Silver, E. J., & Stein, R. E. (2006). Cumulative
social
disadvantage and child health. Pediatrics, 117, 1321–1328.
doi:10.1542/
peds.2005-1647
Bloom, B., Dey, A. N., & Freeman, G. (2006). Summary health
statistics
for U.S. children: National health interview survey, National
Center for
Health Statistics. Washington, DC: National Center for Health
Statistics.
Bramlett, M. D., & Blumberg, S. J. (2007). Family structure and
children’s
physical and mental health. Health Affairs, 26, 549 –558.
doi:10.1377/
hlthaff.26.2.549
Braun, J. M., Froehlich, T. E., Daniels, J. L., Dietrich, K. N.,
Hornung, R.,
Auinger, P., & Lanphear, B. P. (2008). Association of
environmental
toxicants and conduct disorder in U.S. children: NHANES
2001–2004.
Environmental Health Perspectives, 116, 956 –962. doi:10.1289/
ehp.11177
Caplan, N., Choy, M. H., & Whitmore, J. K. (1991). Children of
the boat
people: A study of educational success. Ann Arbor, MI:
University of
Michigan Press.
Centers for Disease Control and Prevention/National Council
for Health
Statistics. (1995). Health, United States 1994. Hyattsville, MD:
U.S.
Public Health Service.
Centers for Disease Control and Prevention/National Council
for Health
Statistics. (1997). Monthly vital statistics report (Vol. 46).
Hyattsville,
MD: U.S. Public Health Service.
Chang, L., Morrissey, R. F., & Koplewicz, H. S. (1995).
Prevalence of
psychiatric symptoms and their relation to adjustment among
Chinese-
American youth. Journal of the American Academy of Child &
Adoles-
cent Psychiatry, 34, 91–99. doi:10.1097/00004583-199501000-
00019
Chen, E., Martin, A. D., & Matthews, K. A. (2006).
Understanding health
disparities: The role of race and socioeconomic status in
children’s
health. American Journal of Public Health, 96, 702–708.
doi:10.2105/
AJPH.2004.048124
Cremeens, J., Eiser, C., & Blades, M. (2006). Characteristics of
health-
related self-report measures for children aged three to eight
years: A
review of the literature. Quality of Life Research: An
International
Journal of Quality of Life Aspects of Treatment, Care &
Rehabilitation,
15, 739 –754. doi:10.1007/s11136-005-4184-x
Ginsburg, G. S., La Greca, A. M., & Silverman, W. K. (1998).
Social
anxiety in children with anxiety disorders: Relation with social
and
emotional functioning. Journal of Abnormal Child Psychology,
26,
175–185. doi:10.1023/A:1022668101048
Gong-Guy, E. (1987). Report on the California Southeast Asian
Mental
Health Needs Assessment (Contract No. 85-76282A-2).
Sacramento,
CA: California Department of Mental Health.
Greene, M. L., Way, N., & Pahl, K. (2006). Trajectories of
perceived adult
and peer discrimination among Black, Latino, and Asian
American
adolescents: Patterns and psychological correlates.
Developmental Psy-
chology, 42, 218 –238. doi:10.1037/0012-1649.42.2.218
Grunbaum, J. A., Lowry, R., Kann, L., & Pateman, B. (2000).
Prevalence
of health risk behaviors among Asian American/Pacific Islander
high
school students. Journal of Adolescent Health, 27, 322–330.
doi:
10.1016/S1054-139X(00)00093-8
Harter, S. (1983). Developmental perspectives on self-system.
In E. M.
Hetherington (Ed.), Handbook of child psychology: Vol 4.
Social, emo-
tional, and personality development (4th ed., pp. 275–283). New
York,
NY: Wiley.
Hsia, J. (1988). Asian Americans in higher education and at
work. Hills-
dale, NJ: Lawrence Erlbaum.
Humes, K. R., Jones, N. A., & Ramirez, R. R. (2011). Overview
of race
and Hispanic origin: 2010. 2010 census briefs. Retrieved from
U.S.
Census Bureau website:
Http://www.census.gov/prod/cen2010/briefs/
c2010br-02.pdf
Ishii-Kuntz, M., Gomel, J. N., Tinsley, B. J., & Parke, R. D.
(2010).
Economic hardship and adaptation among Asian American
families.
Journal of Family Issues, 31, 407– 420. doi:10.1177/
0192513X09351271
Kauffman, J. S., Cooper, R. S., & McGee, D. L. (1997).
Socioeconomic
status and health in blacks and whites: The problem of residual
con-
founding and the resiliency of race. Epidemiology, 8, 621– 628.
Kibria, N. (1993). Family tightrope: The changing lives of
Vietnamese
Americans. Princeton, NJ: Princeton University Press.
Kogan, M. D., & Newacheck, P. W. (2007). Introduction to the
volume on
articles from the National Survey of Children’s Health.
Pediatrics, 119,
S1–S3. doi:10.1542/peds.2006-2089B
Kohen, D. E., Brehaut, J. C., Garner, R. E., Miller, A. R., Lach,
L. M.,
Klassen, A. F., & Rosenbaum, P. I. (2007). Conceptualizing
childhood
health problems using survey data: A comparison of key
indicators.
BMC Pediatrics, 7, 40. doi:10.1186/1471-2431-7-40
Koot, H. M., & Wallander, J. L. (Eds.). (2001). Quality of life
in child and
adolescent illness: Concepts, methods and findings. East
Sussex, UK:
Brunner-Routledge.
La Greca, A. M., & Lopez, N. (1998). Social anxiety among
adolescents:
T
hi
s
do
cu
m
en
t
is
co
py
ri
gh
te
d
by
th
e
A
m
er
ic
an
P
sy
ch
ol
og
ic
al
A
ss
oc
ia
ti
on
or
on
e
of
it
s
al
li
ed
pu
bl
is
he
rs
.
T
hi
s
ar
ti
cl
e
is
in
te
nd
ed
so
le
ly
fo
r
th
e
pe
rs
on
al
us
e
of
th
e
in
di
vi
du
al
us
er
an
d
is
no
t
to
be
di
ss
em
in
at
ed
br
oa
dl
y.
20 FRADKIN ET AL.
http://dx.doi.org/10.1542/peds.2005-1647
http://dx.doi.org/10.1377/hlthaff.26.2.549
http://dx.doi.org/10.1289/ehp.11177
http://dx.doi.org/10.1097/00004583-199501000-00019
http://dx.doi.org/10.2105/AJPH.2004.048124
http://dx.doi.org/10.1007/s11136-005-4184-x
http://dx.doi.org/10.1023/A:1022668101048
http://dx.doi.org/10.1037/0012-1649.42.2.218
http://dx.doi.org/10.1016/S1054-139X%2800%2900093-8
www.census.gov/prod/cen2010/briefs/c2010br-02.pdf
http://dx.doi.org/10.1177/0192513X09351271
http://dx.doi.org/10.1542/peds.2006-2089B
http://dx.doi.org/10.1186/1471-2431-7-40
Linkages with peer relations and friendships. Journal of
Abnormal Child
Psychology, 26, 83–94. doi:10.1023/A:1022684520514
Limbers, C. A., Newman, D. A., & Varni, J. W. (2009).
Factorial invari-
ance of child self-report across race/ethnicity groups: A
multigroup
confirmatory factor analysis approach utilizing the PedsQL 4.0
Generic
Core Scales. Annals of Epidemiology, 19, 575–581.
doi:10.1016/
j.annepidem.2009.04.004
Marmot, M. G., Rose, G., Shipley, M., & Hamilton, P. J.
(1978). Employ-
ment grade and coronary heart disease in British civil servants.
Journal
of Epidemiology and Community Health, 32, 244 –249.
doi:10.1136/
jech.32.4.244
Mau, M. K., Sinclair, K., Saito, E. P., Baumhofer, K. N., &
Kaholokula,
J. K. (2009). Cardiometabolic health disparities in native
Hawaiians and
other Pacific Islanders. Epidemiologic Reviews, 31, 113–129.
doi:
10.1093/ajerev/mxp004
Muris, P., Meesters, C., & Fijen, P. (2003). The self-perception
profile for
children: Further evidence for its factor structure, reliability,
and valid-
ity. Personality and Individual Differences, 35, 1791–1802. doi:
10.1016/S0191-8869(03)00004-7
National Center for Health Statistics. (1972). Examination and
health
history findings among children and youth 6 –17 years. Vital
and Health
Statistics, 2, 1A.
Olson, L. M., Lara, M., & Frintner, M. P. (2004). Measuring
health status
and quality of life for US children: Relationship to race,
ethnicity, and
income status. Ambulatory Pediatrics, 4, 377–386.
doi:10.1367/A03-
156.1
Onoda, L. (1977). Neurotic-stable tendencies among Japanese
American
sanseis and Caucasian students. Journal of Non-White Concerns
in
Personnel & Guidance, 5, 180 –185. doi:10.1002/j.2164-
4950.1977.tb00065.x
Pang, V. O. (1991). The relationship of test anxiety and math
achievement
to parental values in Asian-American and European-American
middle
school students. Journal of Research & Development in
Education, 24,
1–10.
Park, Y., & Kim, U. (2006). Family, parent– child relationship
and aca-
demic achievement in Korea. In K. Uichol, K. Yang, & K.
Hwang
(Eds.), Indigenous and cultural psychology: Understanding
people in
context (pp. 421– 443). New York, NY: Springer.
Popkin, B. M., & Udry, J. R. (1998). Adolescent obesity
increases signif-
icantly in second and third generation U.S. immigrants: The
national
longitudinal study of adolescent health. The Journal of
Nutrition, 128,
701–706.
Rhee, S., Chang, J., & Rhee, J. (2003). Acculturation,
communication
patterns, and self-esteem among Asian and Caucasian American
adoles-
cents. Adolescence, 38, 749 –768.
Rosenbloom, S. R., & Way, N. (2004). Experiences of
discrimination
among African American, Asian American, and Latino
adolescents in an
urban high school. Youth & Society, 35, 420 – 451.
doi:10.1177/
0044118X03261479
Szilagyi, P. G., & Schor, E. L. (1998). The health of children.
HSR: Health
Services Research, 33, 1001–1039.
Varni, J. W., Burwinkle, T. M., Seid, M., & Skarr, D. (2003).
The PedsQL
4.0 as a pediatric population health measure: Feasibility,
reliability, and
validity. Ambulatory Pediatrics, 3, 329 –341. doi:10.1367/1539-
4409(2003)003�0329:TPAAPP�2.0.CO;2
Varni, J. W., Limbers, C. A., & Burwinkle, T. M. (2007). Parent
proxy-
report of their children’s health-related quality of life: An
analysis of
13,878 parents’ reliability and validity across age subgroups
using the
PedsQL 4.0 Generic Core Scales. Health and Quality of Life
Outcomes,
5, 1–10. doi:10.1186/1477-7525-5-1
Varni, J. W., Seid, M., & Kurtin, P. S. (2001). The PedsQL 4.0:
Reliability
and validity of the Pediatric Quality of Life Inventory Version
4.0
Generic Core Scales in healthy and patient populations. Medical
Care,
39, 800 – 812. doi:10.1097/00005650-200108000-00006
Verhulst, F. C., & Achenbach, T. M. (1995). Empirically based
assessment
and taxonomy of psychopathology. Cross-cultural applications:
A re-
view. European Child & Adolescent Psychiatry, 4, 61–76.
doi:10.1007/
BF01977734
Wallander, J. L., Taylor, W. C., Grunbaum, J. A., Franklin, F.
A., Harrison,
G. G., Kelder, S. H., & Schuster, M. A. (2009). Weight status,
quality of
life, and self-concept in African American, Hispanic, and white
fifth-
grade children. Obesity, 17, 1363–1368.
Wang, Y., & Beydoun, M. A. (2007). The obesity epidemic in
the United
States—Gender, age, socioeconomic, racial/ethnic, and
geographic char-
acteristics: A systematic review and meta-regression analysis.
Epidemi-
ologic Reviews, 29, 6 –28. doi:10.1093/epirev/mxm007
Williams, D. R. (1999). Race, socioeconomic status, and health:
The added
effects of racism and discrimination. Annals of the New York
Academy
of Sciences, 896, 173–188. doi:10.1111/j.1749-
6632.1999.tb08114.x
Windle, M., Grunbaum, J. A., Elliott, M., Tortolero, S. R.,
Berry, S.,
Gilliland, J., . . . Shuster, M. (2004). Healthy passages. A
multilevel,
multimethod longitudinal study of adolescent health. American
Journal
of Preventive Medicine, 27, 164 –172. doi:10.1016/
j.amepre.2004.04.007
Wong, F., & Halgin, R. (2006). The “Model Minority”, bane or
blessing for
Asian Americans? Journal of Multicultural Counseling and
Develop-
ment, 34, 38 – 49. doi:10.1002/j.2161-1912.2006.tb00025.x
World Health Organization. (1948). Basic documents. Geneva,
Switzer-
land: World Health Organization. Retrieved from World Health
Orga-
nization site:
http://apps.who.int/gb/bd/PDF/bd47/EN/constitution-
en.pdf
Yeh, M., McCabe, K., Hurlburt, M., Hough, R., Hazen, A.,
Culver, S., . . .
Landsverk, J. (2002). Referral sources, diagnoses, and service
types of
youth in public outpatient mental health care: A focus on ethnic
minor-
ities. The Journal of Behavioral Health Services & Research,
29, 45– 60.
doi:10.1007/BF02287831
Yoo, H. C., Burrola, K. S., & Steger, M. F. (2010). A
preliminary report on
a new measure: Internalization of the Model Minority Myth
Measure
(IM-4) and its psychological correlates among Asian American
college
students. Journal of Counseling Psychology, 57, 114 –127.
doi:10.1037/
a0017871
Yu, S. M., Huang, Z. J., & Singh, G. K. (2004). Health status
and health
services utilization among US Chinese, Asian Indian, Filipino,
and other
Asian/Pacific islander children. Pediatrics, 113, 101–107.
doi:10.1542/
peds.113.1.101
Yu, S. M., & Vyas, A. N. (2009). The Health of Children and
Adolescents.
In C. Trinh-Shevrin, N. S. Islam, & M. J. Rey (Eds.), Asian
American
communities and health: Context, research, policy, and action
(pp.
107–131). San Francisco, CA: Jossey-Bass.
Zhou, Z., Peverly, S. T., Xin, T., Huang, A. S., & Wang, W.
(2003). School
adjustment of first-generation Chinese-American adolescents.
Psychol-
ogy in the Schools, 40, 71– 84. doi:10.1002/pits.10070
Received September 28, 2011
Revision received May 17, 2012
Accepted June 4, 2012 �
T
hi
s
do
cu
m
en
t
is
co
py
ri
gh
te
d
by
th
e
A
m
er
ic
an
P
sy
ch
ol
og
ic
al
A
ss
oc
ia
ti
on
or
on
e
of
it
s
al
li
ed
pu
bl
is
he
rs
.
T
hi
s
ar
ti
cl
e
is
in
te
nd
ed
so
le
ly
fo
r
th
e
pe
rs
on
al
us
e
of
th
e
in
di
vi
du
al
us
er
an
d
is
no
t
to
be
di
ss
em
in
at
ed
br
oa
dl
y.
21QUALITY OF LIFE AMONG ASIAN AMERICAN YOUTH
http://dx.doi.org/10.1023/A:1022684520514
http://dx.doi.org/10.1016/j.annepidem.2009.04.004
http://dx.doi.org/10.1136/jech.32.4.244
http://dx.doi.org/10.1093/ajerev/mxp004
http://dx.doi.org/10.1016/S0191-8869%2803%2900004-7
http://dx.doi.org/10.1367/A03-156.1
http://dx.doi.org/10.1002/j.2164-4950.1977.tb00065.x
http://dx.doi.org/10.1177/0044118X03261479
http://dx.doi.org/10.1367/1539-
4409%282003%29003%3C0329:TPAAPP%3E2.0.CO;2
http://dx.doi.org/10.1367/1539-
4409%282003%29003%3C0329:TPAAPP%3E2.0.CO;2
http://dx.doi.org/10.1186/1477-7525-5-1
http://dx.doi.org/10.1097/00005650-200108000-00006
http://dx.doi.org/10.1007/BF01977734
http://dx.doi.org/10.1093/epirev/mxm007
http://dx.doi.org/10.1111/j.1749-6632.1999.tb08114.x
http://dx.doi.org/10.1016/j.amepre.2004.04.007
http://dx.doi.org/10.1002/j.2161-1912.2006.tb00025.x
http://dx.doi.org/10.1007/BF02287831
http://dx.doi.org/10.1037/a0017871
http://dx.doi.org/10.1542/peds.113.1.101
http://dx.doi.org/10.1002/pits.10070

Contenu connexe

Similaire à Quality of Life Among Asian American YouthChris Fradkin an.docx

Female Adolescent Health Care Needs.docx
Female Adolescent Health Care Needs.docxFemale Adolescent Health Care Needs.docx
Female Adolescent Health Care Needs.docxwrite31
 
J Child Fam Stud (2007) 16331–346DOI 10.1007s10826-006-908.docx
J Child Fam Stud (2007) 16331–346DOI 10.1007s10826-006-908.docxJ Child Fam Stud (2007) 16331–346DOI 10.1007s10826-006-908.docx
J Child Fam Stud (2007) 16331–346DOI 10.1007s10826-006-908.docxchristiandean12115
 
Reaction to Non-Cognitive ability, College Learning.docx
Reaction to Non-Cognitive ability, College Learning.docxReaction to Non-Cognitive ability, College Learning.docx
Reaction to Non-Cognitive ability, College Learning.docxmakdul
 
Health disparities in_dementia
Health disparities in_dementiaHealth disparities in_dementia
Health disparities in_dementiawef
 
Diversity and Anxiety Disorder discussion.docx
Diversity and Anxiety Disorder discussion.docxDiversity and Anxiety Disorder discussion.docx
Diversity and Anxiety Disorder discussion.docxwrite4
 
Diversity Paper Each student will complete a diversity research assig.pdf
Diversity Paper Each student will complete a diversity research assig.pdfDiversity Paper Each student will complete a diversity research assig.pdf
Diversity Paper Each student will complete a diversity research assig.pdfarjuncp10
 
Strong Foundations: Getting oriented to children's behavioral health in Georgia
Strong Foundations: Getting oriented to children's behavioral health in GeorgiaStrong Foundations: Getting oriented to children's behavioral health in Georgia
Strong Foundations: Getting oriented to children's behavioral health in GeorgiaGeorgians for a Healthy Future
 
Perception of Child Abuse 2COLLEGE STUDENTS’ AND PROFESSIO.docx
Perception of Child Abuse     2COLLEGE STUDENTS’ AND PROFESSIO.docxPerception of Child Abuse     2COLLEGE STUDENTS’ AND PROFESSIO.docx
Perception of Child Abuse 2COLLEGE STUDENTS’ AND PROFESSIO.docxherbertwilson5999
 
Tangible Needs and External Stressors Faced by Chinese Ameri.docx
Tangible Needs and External Stressors Faced by Chinese Ameri.docxTangible Needs and External Stressors Faced by Chinese Ameri.docx
Tangible Needs and External Stressors Faced by Chinese Ameri.docxperryk1
 
Diversity and Health Assessments.docx
Diversity and Health Assessments.docxDiversity and Health Assessments.docx
Diversity and Health Assessments.docxbkbk37
 
Diversity and Health Assessments.docx
Diversity and Health Assessments.docxDiversity and Health Assessments.docx
Diversity and Health Assessments.docxbkbk37
 
VU RESEARCH PROPOSAL
VU RESEARCH PROPOSALVU RESEARCH PROPOSAL
VU RESEARCH PROPOSALLinh Vu
 
What is population health?
What is population health?What is population health?
What is population health?Tomas J. Aragon
 

Similaire à Quality of Life Among Asian American YouthChris Fradkin an.docx (20)

Female Adolescent Health Care Needs.docx
Female Adolescent Health Care Needs.docxFemale Adolescent Health Care Needs.docx
Female Adolescent Health Care Needs.docx
 
conferences.jbsinternational.com
conferences.jbsinternational.comconferences.jbsinternational.com
conferences.jbsinternational.com
 
Tapsa 11 09
Tapsa 11 09Tapsa 11 09
Tapsa 11 09
 
ACEs AAPI briefandbib
ACEs AAPI briefandbibACEs AAPI briefandbib
ACEs AAPI briefandbib
 
J Child Fam Stud (2007) 16331–346DOI 10.1007s10826-006-908.docx
J Child Fam Stud (2007) 16331–346DOI 10.1007s10826-006-908.docxJ Child Fam Stud (2007) 16331–346DOI 10.1007s10826-006-908.docx
J Child Fam Stud (2007) 16331–346DOI 10.1007s10826-006-908.docx
 
Reaction to Non-Cognitive ability, College Learning.docx
Reaction to Non-Cognitive ability, College Learning.docxReaction to Non-Cognitive ability, College Learning.docx
Reaction to Non-Cognitive ability, College Learning.docx
 
Health disparities in_dementia
Health disparities in_dementiaHealth disparities in_dementia
Health disparities in_dementia
 
Diversity and Anxiety Disorder discussion.docx
Diversity and Anxiety Disorder discussion.docxDiversity and Anxiety Disorder discussion.docx
Diversity and Anxiety Disorder discussion.docx
 
Diversity Paper Each student will complete a diversity research assig.pdf
Diversity Paper Each student will complete a diversity research assig.pdfDiversity Paper Each student will complete a diversity research assig.pdf
Diversity Paper Each student will complete a diversity research assig.pdf
 
Strong Foundations: Getting oriented to children's behavioral health in Georgia
Strong Foundations: Getting oriented to children's behavioral health in GeorgiaStrong Foundations: Getting oriented to children's behavioral health in Georgia
Strong Foundations: Getting oriented to children's behavioral health in Georgia
 
Perception of Child Abuse 2COLLEGE STUDENTS’ AND PROFESSIO.docx
Perception of Child Abuse     2COLLEGE STUDENTS’ AND PROFESSIO.docxPerception of Child Abuse     2COLLEGE STUDENTS’ AND PROFESSIO.docx
Perception of Child Abuse 2COLLEGE STUDENTS’ AND PROFESSIO.docx
 
SELF ESTEEM IN YOUTH
SELF ESTEEM IN YOUTHSELF ESTEEM IN YOUTH
SELF ESTEEM IN YOUTH
 
Article1
Article1Article1
Article1
 
Article1
Article1Article1
Article1
 
Tangible Needs and External Stressors Faced by Chinese Ameri.docx
Tangible Needs and External Stressors Faced by Chinese Ameri.docxTangible Needs and External Stressors Faced by Chinese Ameri.docx
Tangible Needs and External Stressors Faced by Chinese Ameri.docx
 
Diversity and Health Assessments.docx
Diversity and Health Assessments.docxDiversity and Health Assessments.docx
Diversity and Health Assessments.docx
 
Diversity and Health Assessments.docx
Diversity and Health Assessments.docxDiversity and Health Assessments.docx
Diversity and Health Assessments.docx
 
VU RESEARCH PROPOSAL
VU RESEARCH PROPOSALVU RESEARCH PROPOSAL
VU RESEARCH PROPOSAL
 
What is population health?
What is population health?What is population health?
What is population health?
 
05 session 2 - Juan Raul Gutierrez
05 session 2 - Juan Raul Gutierrez05 session 2 - Juan Raul Gutierrez
05 session 2 - Juan Raul Gutierrez
 

Plus de amrit47

APA, The assignment require a contemporary approach addressing Race,.docx
APA, The assignment require a contemporary approach addressing Race,.docxAPA, The assignment require a contemporary approach addressing Race,.docx
APA, The assignment require a contemporary approach addressing Race,.docxamrit47
 
APA style and all questions answered ( no min page requirements) .docx
APA style and all questions answered ( no min page requirements) .docxAPA style and all questions answered ( no min page requirements) .docx
APA style and all questions answered ( no min page requirements) .docxamrit47
 
Apa format1-2 paragraphsreferences It is often said th.docx
Apa format1-2 paragraphsreferences It is often said th.docxApa format1-2 paragraphsreferences It is often said th.docx
Apa format1-2 paragraphsreferences It is often said th.docxamrit47
 
APA format2-3 pages, double-spaced1. Choose a speech to review. It.docx
APA format2-3 pages, double-spaced1. Choose a speech to review. It.docxAPA format2-3 pages, double-spaced1. Choose a speech to review. It.docx
APA format2-3 pages, double-spaced1. Choose a speech to review. It.docxamrit47
 
APA format  httpsapastyle.apa.orghttpsowl.purd.docx
APA format     httpsapastyle.apa.orghttpsowl.purd.docxAPA format     httpsapastyle.apa.orghttpsowl.purd.docx
APA format  httpsapastyle.apa.orghttpsowl.purd.docxamrit47
 
APA format2-3 pages, double-spaced1. Choose a speech to review. .docx
APA format2-3 pages, double-spaced1. Choose a speech to review. .docxAPA format2-3 pages, double-spaced1. Choose a speech to review. .docx
APA format2-3 pages, double-spaced1. Choose a speech to review. .docxamrit47
 
APA Formatting AssignmentUse the information below to create.docx
APA Formatting AssignmentUse the information below to create.docxAPA Formatting AssignmentUse the information below to create.docx
APA Formatting AssignmentUse the information below to create.docxamrit47
 
APA style300 words10 maximum plagiarism  Mrs. Smith was.docx
APA style300 words10 maximum plagiarism  Mrs. Smith was.docxAPA style300 words10 maximum plagiarism  Mrs. Smith was.docx
APA style300 words10 maximum plagiarism  Mrs. Smith was.docxamrit47
 
APA format1. What are the three most important takeawayslessons.docx
APA format1. What are the three most important takeawayslessons.docxAPA format1. What are the three most important takeawayslessons.docx
APA format1. What are the three most important takeawayslessons.docxamrit47
 
APA General Format Summary APA (American Psychological.docx
APA General Format Summary APA (American Psychological.docxAPA General Format Summary APA (American Psychological.docx
APA General Format Summary APA (American Psychological.docxamrit47
 
Appearance When I watched the video of myself, I felt that my b.docx
Appearance When I watched the video of myself, I felt that my b.docxAppearance When I watched the video of myself, I felt that my b.docx
Appearance When I watched the video of myself, I felt that my b.docxamrit47
 
apa format1-2 paragraphsreferencesFor this week’s .docx
apa format1-2 paragraphsreferencesFor this week’s .docxapa format1-2 paragraphsreferencesFor this week’s .docx
apa format1-2 paragraphsreferencesFor this week’s .docxamrit47
 
APA Format, with 2 references for each question and an assignment..docx
APA Format, with 2 references for each question and an assignment..docxAPA Format, with 2 references for each question and an assignment..docx
APA Format, with 2 references for each question and an assignment..docxamrit47
 
APA-formatted 8-10 page research paper which examines the potential .docx
APA-formatted 8-10 page research paper which examines the potential .docxAPA-formatted 8-10 page research paper which examines the potential .docx
APA-formatted 8-10 page research paper which examines the potential .docxamrit47
 
APA    STYLE 1.Define the terms multiple disabilities and .docx
APA    STYLE 1.Define the terms multiple disabilities and .docxAPA    STYLE 1.Define the terms multiple disabilities and .docx
APA    STYLE 1.Define the terms multiple disabilities and .docxamrit47
 
APA STYLE  follow this textbook answer should be summarize for t.docx
APA STYLE  follow this textbook answer should be summarize for t.docxAPA STYLE  follow this textbook answer should be summarize for t.docx
APA STYLE  follow this textbook answer should be summarize for t.docxamrit47
 
APA7Page length 3-4, including Title Page and Reference Pag.docx
APA7Page length 3-4, including Title Page and Reference Pag.docxAPA7Page length 3-4, including Title Page and Reference Pag.docx
APA7Page length 3-4, including Title Page and Reference Pag.docxamrit47
 
APA format, 2 pagesThree general sections 1. an article s.docx
APA format, 2 pagesThree general sections 1. an article s.docxAPA format, 2 pagesThree general sections 1. an article s.docx
APA format, 2 pagesThree general sections 1. an article s.docxamrit47
 
APA Style with minimum of 450 words, with annotations, quotation.docx
APA Style with minimum of 450 words, with annotations, quotation.docxAPA Style with minimum of 450 words, with annotations, quotation.docx
APA Style with minimum of 450 words, with annotations, quotation.docxamrit47
 
APA FORMAT1.  What are the three most important takeawayslesson.docx
APA FORMAT1.  What are the three most important takeawayslesson.docxAPA FORMAT1.  What are the three most important takeawayslesson.docx
APA FORMAT1.  What are the three most important takeawayslesson.docxamrit47
 

Plus de amrit47 (20)

APA, The assignment require a contemporary approach addressing Race,.docx
APA, The assignment require a contemporary approach addressing Race,.docxAPA, The assignment require a contemporary approach addressing Race,.docx
APA, The assignment require a contemporary approach addressing Race,.docx
 
APA style and all questions answered ( no min page requirements) .docx
APA style and all questions answered ( no min page requirements) .docxAPA style and all questions answered ( no min page requirements) .docx
APA style and all questions answered ( no min page requirements) .docx
 
Apa format1-2 paragraphsreferences It is often said th.docx
Apa format1-2 paragraphsreferences It is often said th.docxApa format1-2 paragraphsreferences It is often said th.docx
Apa format1-2 paragraphsreferences It is often said th.docx
 
APA format2-3 pages, double-spaced1. Choose a speech to review. It.docx
APA format2-3 pages, double-spaced1. Choose a speech to review. It.docxAPA format2-3 pages, double-spaced1. Choose a speech to review. It.docx
APA format2-3 pages, double-spaced1. Choose a speech to review. It.docx
 
APA format  httpsapastyle.apa.orghttpsowl.purd.docx
APA format     httpsapastyle.apa.orghttpsowl.purd.docxAPA format     httpsapastyle.apa.orghttpsowl.purd.docx
APA format  httpsapastyle.apa.orghttpsowl.purd.docx
 
APA format2-3 pages, double-spaced1. Choose a speech to review. .docx
APA format2-3 pages, double-spaced1. Choose a speech to review. .docxAPA format2-3 pages, double-spaced1. Choose a speech to review. .docx
APA format2-3 pages, double-spaced1. Choose a speech to review. .docx
 
APA Formatting AssignmentUse the information below to create.docx
APA Formatting AssignmentUse the information below to create.docxAPA Formatting AssignmentUse the information below to create.docx
APA Formatting AssignmentUse the information below to create.docx
 
APA style300 words10 maximum plagiarism  Mrs. Smith was.docx
APA style300 words10 maximum plagiarism  Mrs. Smith was.docxAPA style300 words10 maximum plagiarism  Mrs. Smith was.docx
APA style300 words10 maximum plagiarism  Mrs. Smith was.docx
 
APA format1. What are the three most important takeawayslessons.docx
APA format1. What are the three most important takeawayslessons.docxAPA format1. What are the three most important takeawayslessons.docx
APA format1. What are the three most important takeawayslessons.docx
 
APA General Format Summary APA (American Psychological.docx
APA General Format Summary APA (American Psychological.docxAPA General Format Summary APA (American Psychological.docx
APA General Format Summary APA (American Psychological.docx
 
Appearance When I watched the video of myself, I felt that my b.docx
Appearance When I watched the video of myself, I felt that my b.docxAppearance When I watched the video of myself, I felt that my b.docx
Appearance When I watched the video of myself, I felt that my b.docx
 
apa format1-2 paragraphsreferencesFor this week’s .docx
apa format1-2 paragraphsreferencesFor this week’s .docxapa format1-2 paragraphsreferencesFor this week’s .docx
apa format1-2 paragraphsreferencesFor this week’s .docx
 
APA Format, with 2 references for each question and an assignment..docx
APA Format, with 2 references for each question and an assignment..docxAPA Format, with 2 references for each question and an assignment..docx
APA Format, with 2 references for each question and an assignment..docx
 
APA-formatted 8-10 page research paper which examines the potential .docx
APA-formatted 8-10 page research paper which examines the potential .docxAPA-formatted 8-10 page research paper which examines the potential .docx
APA-formatted 8-10 page research paper which examines the potential .docx
 
APA    STYLE 1.Define the terms multiple disabilities and .docx
APA    STYLE 1.Define the terms multiple disabilities and .docxAPA    STYLE 1.Define the terms multiple disabilities and .docx
APA    STYLE 1.Define the terms multiple disabilities and .docx
 
APA STYLE  follow this textbook answer should be summarize for t.docx
APA STYLE  follow this textbook answer should be summarize for t.docxAPA STYLE  follow this textbook answer should be summarize for t.docx
APA STYLE  follow this textbook answer should be summarize for t.docx
 
APA7Page length 3-4, including Title Page and Reference Pag.docx
APA7Page length 3-4, including Title Page and Reference Pag.docxAPA7Page length 3-4, including Title Page and Reference Pag.docx
APA7Page length 3-4, including Title Page and Reference Pag.docx
 
APA format, 2 pagesThree general sections 1. an article s.docx
APA format, 2 pagesThree general sections 1. an article s.docxAPA format, 2 pagesThree general sections 1. an article s.docx
APA format, 2 pagesThree general sections 1. an article s.docx
 
APA Style with minimum of 450 words, with annotations, quotation.docx
APA Style with minimum of 450 words, with annotations, quotation.docxAPA Style with minimum of 450 words, with annotations, quotation.docx
APA Style with minimum of 450 words, with annotations, quotation.docx
 
APA FORMAT1.  What are the three most important takeawayslesson.docx
APA FORMAT1.  What are the three most important takeawayslesson.docxAPA FORMAT1.  What are the three most important takeawayslesson.docx
APA FORMAT1.  What are the three most important takeawayslesson.docx
 

Dernier

Russian Escort Service in Delhi 11k Hotel Foreigner Russian Call Girls in Delhi
Russian Escort Service in Delhi 11k Hotel Foreigner Russian Call Girls in DelhiRussian Escort Service in Delhi 11k Hotel Foreigner Russian Call Girls in Delhi
Russian Escort Service in Delhi 11k Hotel Foreigner Russian Call Girls in Delhikauryashika82
 
Grant Readiness 101 TechSoup and Remy Consulting
Grant Readiness 101 TechSoup and Remy ConsultingGrant Readiness 101 TechSoup and Remy Consulting
Grant Readiness 101 TechSoup and Remy ConsultingTechSoup
 
Measures of Central Tendency: Mean, Median and Mode
Measures of Central Tendency: Mean, Median and ModeMeasures of Central Tendency: Mean, Median and Mode
Measures of Central Tendency: Mean, Median and ModeThiyagu K
 
Mixin Classes in Odoo 17 How to Extend Models Using Mixin Classes
Mixin Classes in Odoo 17  How to Extend Models Using Mixin ClassesMixin Classes in Odoo 17  How to Extend Models Using Mixin Classes
Mixin Classes in Odoo 17 How to Extend Models Using Mixin ClassesCeline George
 
Unit-IV; Professional Sales Representative (PSR).pptx
Unit-IV; Professional Sales Representative (PSR).pptxUnit-IV; Professional Sales Representative (PSR).pptx
Unit-IV; Professional Sales Representative (PSR).pptxVishalSingh1417
 
Activity 01 - Artificial Culture (1).pdf
Activity 01 - Artificial Culture (1).pdfActivity 01 - Artificial Culture (1).pdf
Activity 01 - Artificial Culture (1).pdfciinovamais
 
Python Notes for mca i year students osmania university.docx
Python Notes for mca i year students osmania university.docxPython Notes for mca i year students osmania university.docx
Python Notes for mca i year students osmania university.docxRamakrishna Reddy Bijjam
 
Holdier Curriculum Vitae (April 2024).pdf
Holdier Curriculum Vitae (April 2024).pdfHoldier Curriculum Vitae (April 2024).pdf
Holdier Curriculum Vitae (April 2024).pdfagholdier
 
ComPTIA Overview | Comptia Security+ Book SY0-701
ComPTIA Overview | Comptia Security+ Book SY0-701ComPTIA Overview | Comptia Security+ Book SY0-701
ComPTIA Overview | Comptia Security+ Book SY0-701bronxfugly43
 
ICT role in 21st century education and it's challenges.
ICT role in 21st century education and it's challenges.ICT role in 21st century education and it's challenges.
ICT role in 21st century education and it's challenges.MaryamAhmad92
 
Class 11th Physics NEET formula sheet pdf
Class 11th Physics NEET formula sheet pdfClass 11th Physics NEET formula sheet pdf
Class 11th Physics NEET formula sheet pdfAyushMahapatra5
 
How to Give a Domain for a Field in Odoo 17
How to Give a Domain for a Field in Odoo 17How to Give a Domain for a Field in Odoo 17
How to Give a Domain for a Field in Odoo 17Celine George
 
Advanced Views - Calendar View in Odoo 17
Advanced Views - Calendar View in Odoo 17Advanced Views - Calendar View in Odoo 17
Advanced Views - Calendar View in Odoo 17Celine George
 
This PowerPoint helps students to consider the concept of infinity.
This PowerPoint helps students to consider the concept of infinity.This PowerPoint helps students to consider the concept of infinity.
This PowerPoint helps students to consider the concept of infinity.christianmathematics
 
Application orientated numerical on hev.ppt
Application orientated numerical on hev.pptApplication orientated numerical on hev.ppt
Application orientated numerical on hev.pptRamjanShidvankar
 
Introduction to Nonprofit Accounting: The Basics
Introduction to Nonprofit Accounting: The BasicsIntroduction to Nonprofit Accounting: The Basics
Introduction to Nonprofit Accounting: The BasicsTechSoup
 
Nutritional Needs Presentation - HLTH 104
Nutritional Needs Presentation - HLTH 104Nutritional Needs Presentation - HLTH 104
Nutritional Needs Presentation - HLTH 104misteraugie
 
2024-NATIONAL-LEARNING-CAMP-AND-OTHER.pptx
2024-NATIONAL-LEARNING-CAMP-AND-OTHER.pptx2024-NATIONAL-LEARNING-CAMP-AND-OTHER.pptx
2024-NATIONAL-LEARNING-CAMP-AND-OTHER.pptxMaritesTamaniVerdade
 
General Principles of Intellectual Property: Concepts of Intellectual Proper...
General Principles of Intellectual Property: Concepts of Intellectual  Proper...General Principles of Intellectual Property: Concepts of Intellectual  Proper...
General Principles of Intellectual Property: Concepts of Intellectual Proper...Poonam Aher Patil
 

Dernier (20)

Russian Escort Service in Delhi 11k Hotel Foreigner Russian Call Girls in Delhi
Russian Escort Service in Delhi 11k Hotel Foreigner Russian Call Girls in DelhiRussian Escort Service in Delhi 11k Hotel Foreigner Russian Call Girls in Delhi
Russian Escort Service in Delhi 11k Hotel Foreigner Russian Call Girls in Delhi
 
Grant Readiness 101 TechSoup and Remy Consulting
Grant Readiness 101 TechSoup and Remy ConsultingGrant Readiness 101 TechSoup and Remy Consulting
Grant Readiness 101 TechSoup and Remy Consulting
 
Measures of Central Tendency: Mean, Median and Mode
Measures of Central Tendency: Mean, Median and ModeMeasures of Central Tendency: Mean, Median and Mode
Measures of Central Tendency: Mean, Median and Mode
 
Mixin Classes in Odoo 17 How to Extend Models Using Mixin Classes
Mixin Classes in Odoo 17  How to Extend Models Using Mixin ClassesMixin Classes in Odoo 17  How to Extend Models Using Mixin Classes
Mixin Classes in Odoo 17 How to Extend Models Using Mixin Classes
 
Unit-IV; Professional Sales Representative (PSR).pptx
Unit-IV; Professional Sales Representative (PSR).pptxUnit-IV; Professional Sales Representative (PSR).pptx
Unit-IV; Professional Sales Representative (PSR).pptx
 
Activity 01 - Artificial Culture (1).pdf
Activity 01 - Artificial Culture (1).pdfActivity 01 - Artificial Culture (1).pdf
Activity 01 - Artificial Culture (1).pdf
 
Python Notes for mca i year students osmania university.docx
Python Notes for mca i year students osmania university.docxPython Notes for mca i year students osmania university.docx
Python Notes for mca i year students osmania university.docx
 
Holdier Curriculum Vitae (April 2024).pdf
Holdier Curriculum Vitae (April 2024).pdfHoldier Curriculum Vitae (April 2024).pdf
Holdier Curriculum Vitae (April 2024).pdf
 
ComPTIA Overview | Comptia Security+ Book SY0-701
ComPTIA Overview | Comptia Security+ Book SY0-701ComPTIA Overview | Comptia Security+ Book SY0-701
ComPTIA Overview | Comptia Security+ Book SY0-701
 
ICT role in 21st century education and it's challenges.
ICT role in 21st century education and it's challenges.ICT role in 21st century education and it's challenges.
ICT role in 21st century education and it's challenges.
 
Class 11th Physics NEET formula sheet pdf
Class 11th Physics NEET formula sheet pdfClass 11th Physics NEET formula sheet pdf
Class 11th Physics NEET formula sheet pdf
 
How to Give a Domain for a Field in Odoo 17
How to Give a Domain for a Field in Odoo 17How to Give a Domain for a Field in Odoo 17
How to Give a Domain for a Field in Odoo 17
 
Mehran University Newsletter Vol-X, Issue-I, 2024
Mehran University Newsletter Vol-X, Issue-I, 2024Mehran University Newsletter Vol-X, Issue-I, 2024
Mehran University Newsletter Vol-X, Issue-I, 2024
 
Advanced Views - Calendar View in Odoo 17
Advanced Views - Calendar View in Odoo 17Advanced Views - Calendar View in Odoo 17
Advanced Views - Calendar View in Odoo 17
 
This PowerPoint helps students to consider the concept of infinity.
This PowerPoint helps students to consider the concept of infinity.This PowerPoint helps students to consider the concept of infinity.
This PowerPoint helps students to consider the concept of infinity.
 
Application orientated numerical on hev.ppt
Application orientated numerical on hev.pptApplication orientated numerical on hev.ppt
Application orientated numerical on hev.ppt
 
Introduction to Nonprofit Accounting: The Basics
Introduction to Nonprofit Accounting: The BasicsIntroduction to Nonprofit Accounting: The Basics
Introduction to Nonprofit Accounting: The Basics
 
Nutritional Needs Presentation - HLTH 104
Nutritional Needs Presentation - HLTH 104Nutritional Needs Presentation - HLTH 104
Nutritional Needs Presentation - HLTH 104
 
2024-NATIONAL-LEARNING-CAMP-AND-OTHER.pptx
2024-NATIONAL-LEARNING-CAMP-AND-OTHER.pptx2024-NATIONAL-LEARNING-CAMP-AND-OTHER.pptx
2024-NATIONAL-LEARNING-CAMP-AND-OTHER.pptx
 
General Principles of Intellectual Property: Concepts of Intellectual Proper...
General Principles of Intellectual Property: Concepts of Intellectual  Proper...General Principles of Intellectual Property: Concepts of Intellectual  Proper...
General Principles of Intellectual Property: Concepts of Intellectual Proper...
 

Quality of Life Among Asian American YouthChris Fradkin an.docx

  • 1. Quality of Life Among Asian American Youth Chris Fradkin and Jan L. Wallander University of California, Merced Yoshimi Yamakawa National Center for Chronic Disease Prevention and Health Promotion, Centers for Disease Control and Prevention, Atlanta, Georgia David C. Schwebel University of Alabama at Birmingham Alyna Chien Harvard Medical School Yen-Chi L. Le and Dennis H. Li University of Texas, School of Public Health, Houston Marc Elliott RAND Corporation, Santa Monica, California Mark Schuster Harvard Medical School and RAND Corporation, Santa Monica, California The aims of the present study were to examine whether Asian American youth experience disparities in quality of life (QL) compared with Hispanic, African American, and white youth in the general population and to what extent socioeconomic status (SES)
  • 2. mediates any disparities among these racial/ethnic groups. Data were obtained from the Healthy Passages study, in which 4,972 Asian American (148; 3%), Hispanic (1,813; 36%), African American (1,755; 35%), and white (1,256; 25%) fifth-graders were enrolled in a population-based, cross- sectional survey conducted in three U.S. metropolitan areas. Youth reported their own QL using the PedsQL and supplemental scales. Parents reported youth’s overall health status as well as parent’s education and household income level. Asian American youth experienced worse status than white youth for three of 10 QL and well-being measures, better status than Hispanic youth on six measures, and better status than African American youth on three measures. However, the observed advantages for Asian American youth over Hispanic and African American youth disappeared when the marked SES differences that are also present among these racial/ethnic groups were taken into account. In contrast, the differences between Asian American and white youth remained after adjusting for SES. These findings suggest that the disparities in QL that favor white youth over Asian American youth exist independent of SES and warrant further examination. In contrast, the QL differences that favor Asian American over Hispanic and African American youth may be partly explained by SES. Interpretations are limited by the heterogeneity existing among Asian Americans. Keywords: Asian American, youth, disparities, quality of life, socioeconomic status This article was published Online First October 8, 2012. Chris Fradkin and Jan L. Wallander, Psychological Sciences,
  • 3. Center of Excellence on Health Disparities, and Health Sciences Research Institute, University of California, Merced; Yoshimi Yamakawa, National Center for Chronic Disease Prevention and Health Promotion, Centers for Disease Control and Prevention, Atlanta, GA; David C. Schwebel, Department of Psychology, University of Alabama at Birmingham; Alyna Chien, Division of General Pediatrics, Children’s Hospital Boston and Department of Pediatrics, Harvard Medical School; Yen-Chi L. Le and Dennis H. Li, University of Texas School of Public Health, Houston; Marc Elliott, RAND Corporation, Santa Monica, CA; Mark Schuster, Division of Gen- eral Pediatrics, Children’s Hospital Boston, Department of Pediatrics, Harvard Medical School, and RAND Corporation. The contributions made to this research by study participants in the Birmingham, Houston, and Los Angeles areas, other Healthy Passages investigators, field teams at each site, and the CDC Division of Ado- lescent and School Health are gratefully acknowledged. The Healthy Passages study is funded by the Centers for Disease Control (CDC) and Prevention, Prevention Research Centers (Cooperative
  • 4. Agreements U19DP002663, U19DP002664, and U19DP002665). The findings and conclusions in this report are those of the authors and do not necessarily represent the official position of the CDC. Dr. Yen-Chi Le is supported by a National Cancer Institute (NCI) postdoctoral research fellowship at the University of Texas School of Public Health Cancer Education and Career Development Program (NCI R25 CA57712). The authors have no conflict of interest to disclose. No author received any form of payment to produce this paper. Correspondence concerning this article should be addressed to Jan L. Wallander, UC Merced, 5200 North Lake Road, Merced, CA 95343. E-mail: [email protected] T hi s do cu m en t is co
  • 8. du al us er an d is no t to be di ss em in at ed br oa dl y. Asian American Journal of Psychology © 2012 American Psychological Association 2014, Vol. 5, No. 1, 13–21 1948-1985/14/$12.00 DOI:
  • 9. 10.1037/a0029822 13 In the United States, Asian American children and adolescents are frequently referred to as the model minority (Ishii-Kuntz, Gomel, Tinsley, & Parke, 2010; Wong & Halgin, 2006; Yoo, Burrola, & Steger, 2010). However, this characterization may primarily reflect Asian Americans’ educational achievements and physical health, which are better on average than other racial/ ethnic groups (e.g., Bloom, Dey, & Freeman, 2006; Caplan, Choy, & Whitmore, 1991; Hsia, 1988; Yu & Vyas, 2009; Zhou, Peverly, Xin, Huang, & Wang, 2003). In terms of psychosocial health and well-being, Asian American youth, as a group, may not appear to be a model. Indeed, in many areas Asian American youth’s psy- chosocial functioning is well below that of non-Hispanic white youth’s and is in the range of Hispanic and non-Hispanic African American youth (Yeh et al., 2002). Whereas studies have provided insights into specific aspects of Asian American youth’s health (e.g., depression, social well- being, anxiety), there is no study we are aware of that informs about broadly construed health and well-being in the youth of this growing population group, which currently constitutes 5% of the U.S. population (Humes, Jones, & Ramirez, 2011). The World Health Organization (1948) defines health as “a complete state
  • 10. of physical, mental, and social well-being, not merely the absence of disease.” Quality of life (QL) is an organizing concept that matches well this broad perspective on health and well-being. As applied to children and adolescents, it reflects an individual’s wellness across multiple domains of life, including at a minimum physical, emotional, and social (Koot & Wallander, 2001). QL may also include information about their role functioning, for example in school and with family (Koot and Wallander (2001). Current Knowledge on Quality of Life in Asian American Youth QL has been used to examine the well-being of various groups of youth and adolescents in the population. To date, in the United States, QL research with children and adolescents that examines racial/ethnic disparities has focused on differences across the three largest racial/ethnic groups in the country (Olson, Lara, & Frintner, 2004), non-Hispanic Whites (63.7%), non-Hispanic African Amer- ican (12.6%), and Hispanics (16.3%) (Humes et al., 2011). Al- though some QL studies have included Asian American youth in their samples (e.g., Cremeens, Eiser, & Blades, 2006; Varni, Limbers, & Burwinkle, 2007), there is no study we are aware of that has reported on the QL of this group specifically or disparities that may exist between Asian American youth and other groups. Research has been conducted, however, reporting differences be- tween Asian American children adolescents and other
  • 11. racial/ethnic groups in specific dimensions of the physical, emotional, and social domains usually constituting QL. In the area of physical health, studies find Asian American youth generally healthier than their non-Asian peers in almost every measurement. For example, Asian American youth have lower morbidity rates than non-Hispanic whites (Yu & Vyas, 2009). They also have the highest rates of “no missed school days” in comparison with other racial/ethnic groups (Bloom et al., 2006). Asian American youth have lower rates of chronic and congenital diseases than non-Hispanic white youth (Yu & Vyas, 2009). In addition, data from the 2005 National Health Interview Survey indicate that parents of Asian American youth rate their health higher, with only 0.4% describing them as being of “fair or poor” health, in contrast to parents of non-Hispanic white (1.5%), non- Hispanic African American (3.3%), and Hispanic (3.2%) children (Bloom et al., 2006). In terms of weight class, Asian American adolescent girls report less than half the rates of obesity than non-Hispanic White girls (4% and 10%, respectively) (Wang & Beydoun, 2007). In contrast to these positive findings in the physical domain for Asian American children and adolescents, other studies show that they experience substandard psychosocial health in comparison with other racial/ethnic groups (Chang, Morrissey, & Koplewicz, 1995; Onoda, 1977; Pang, 1991; Rhee, Chang, & Rhee, 2003).
  • 12. Higher rates have been reported among Asian American youth in depression (Centers for Disease Control & Prevention, 1995, 1997; Chang et al., 1995) and anxiety (Onoda, 1977; Pang, 1991), as well as lower self-esteem (Greene, Way, & Pahl, 2006; Rhee et al., 2003). High prevalences of fighting and suicidal ideation have also been reported among Asian American/Pacific Islander high school students (Grunbaum, Lowry, Kann, & Pateman, 2000). The liter- ature finds high rates of anxiety, depression, and social stress among Chinese American adolescents in contrast to their non- Asian American peers (Zhou et al., 2003). In terms of social well-being, Asian American high school students report high rates of on-campus discrimination and harassment from their non- Hispanic African American and Hispanic peers (Rosenbloom & Way, 2004). Most of this research, however, has focused on adolescents (about 12–18 of age). There has been a dearth of research on younger children, especially just prior to the transition to adolescence. Although the literature on Asian American youth presents find- ings suggestive of better physical and poorer psychosocial health, it also reports considerable variation in health within this group (Gong-Guy, 1987; Yu, Huang, & Singh, 2004). Asian Americans, although often treated as such, are not a homogeneous ethnic group. Most obvious is that their heritage is rooted in quite different regions and cultures, ranging from India and Pakistan to
  • 13. Korea and Japan and many different locations in between. In addition, Asian American youth may have very different levels of acculturation, ranging from those who were born and partially raised in their country of origin and who are still closely immersed in their home culture, to those whose families have resided in the United States for five generations or more and who are very much integrated into the majority U.S. culture. For these reasons, the diversity of Asian Americans challenges research. Even a large sample study would have to significantly oversample Asian Amer- icans to be able to make even gross differentiations within this group. Current Study We acknowledge that the present study, like most others pre- ceding it, is unable to make finer discriminations within the Asian American group, as desirable as that would be. Yet this study provides a distinct opportunity to examine QL broadly in a sizable sample of Asian American youth at an important specific point in development, in fifth grade toward the end of elementary school and prior to the transition to middle school. Therefore, this infor- mation can provide a baseline against which to illuminate changes that may occur during adolescence. We take advantage of the T hi
  • 18. ed br oa dl y. 14 FRADKIN ET AL. Healthy Passages project for this purpose, which is a prospective longitudinal cohort study tracking health risk indicators and their correlates in youth from 5th grade through 10th grade. This project was designed to examine disparities among Hispanic, non- Hispanic African American, and non-Hispanic white youth but did not exclude members of other ethnic groups in the catchment areas from enrolling. Thus this study enrolled Asian American youth in sufficient numbers to enable comparison of them to age peers from the other three major racial/ethnic groups. The rationale and meth- ods of Healthy Passages are detailed elsewhere (Windle et al., 2004). This study will thus examine Asian American youth’s QL within the three core domains of wellness—physical, emotional, and social—plus the school domain. Wellness in the school do-
  • 19. main is important because within this environment occur important interactions with both peers and nonfamilial figures of authority (teachers) as well as preparation for future productivity. To sup- plement information about QL and in light of previous findings on Asian American youth’s psychosocial and physical functioning, we also examine youth’s self-concept, social integration, and stan- dard overall health status. We also examine possible race/ ethnicity-by-gender interactions and adjust comparisons for socio- economic differences that may exist among racial/ethnic groups. Thus with the specific aim to examine differences that may exist in QL between Asian American youth and their non-Asian peers, based on existing literature we expect that the Asian American youth will report physical QL in the range of the non-Hispanic white majority population. We further expect that this group will report psychosocial QL (emotional, social, and school domains) in the range of the Hispanic and non-Hispanic African American minority populations. Method Sample and Procedures Data for the analysis are available at this time from Wave I of the Healthy Passages study (Windle et al., 2004), collected in 2004 –2006. Recruitment into Healthy Passages was designed to enroll about equal representation of the three largest racial/ethnic groups in the U.S: Hispanic, non-Hispanic African American, and
  • 20. non-Hispanic white. Thus, participants were recruited from public schools in (1) 10 contiguous public school districts in and around Birmingham, Alabama, (2) 25 contiguous public school districts in Los Angeles County, California, and (3) the largest public school district in Houston, Texas. Eligible schools had an enrollment of at least 25 fifth-graders, representing more than 99% of students enrolled in regular classrooms in the three areas. Information was disseminated to the 5th grade students in the 118 selected schools, with 11,532 students, to bring to their parents (or caregivers). Permission to be contacted was returned by 6,663, of which 5,147 (77%) completed both a parent and a child interview. However, enrollment was not limited to Hispanic, African American, and White children, resulting in 6% belonging to an “other” racial/ ethnic group (see below for racial/ethnic classification). Among this group, 46% were classified as Asian American. Excluding all others resulted in 4,972 in the analysis sample, with an unweighted distribution based on Census-style classification of: Asian Amer- ican � 3% (n � 148), Hispanic � 36% (1,813), non-Hispanic African American � 35% (1,755), and non-Hispanic white � 25% (1,256). Child age M � 11.12 (SD � .56), and 51% were boys. The Asian American group had an unweighted geographic distri- bution of Los Angeles � 49% (n � 72), Houston � 35% (n �
  • 21. 52), and Birmingham � 16% (n � 24) and included 12 youth identified as Native Hawaiian or Pacific Islander (NH/PI). Additional demo- graphics appear in Table 1. Procedures This research was conducted in compliance with APA ethical standards in the treatment of participants and was approved by the Institutional Review Boards at the three study sites and the Centers for Disease Control and Prevention. Two trained interviewers administered the full Healthy Passages assessment protocol with the child and parent separated in private spaces at their home or a research facility using both computer-assisted personal interview and self-interview methods. The parent could choose whether material would be presented in English or Spanish. The following variables were used in this study. Measures Quality of life (QL) was measured with the self-report form of the Pediatric Quality of Life Inventory Version 4.0 (PedsQL; Varni, Seid, & Kurtin, 2001), a widely used, well-validated mea- sure of QL in children and adolescents. For example, in a study involving 10,241 children and adolescents, including 1.204 Asian/ Pacific Islanders (Varni, Burwinkle, Seid, & Skarr, 2003), the PedsQL demonstrated high construct validity, with healthy
  • 22. youth reporting significantly higher QL in all domains than chronically ill peers. After translation and validation, the PedsQL has been used to measure QL in at least 63 cultures outside the U.S, including more than 10 in South and East Asia. Results from these applications have yielded results consistent with theoretical expec- tations, thus supporting the construct validity of the instrument in a variety of cultures. The PedsQL provides six scores, including subscale scores for Physical (8 items, � .72 [all �s are reported for the current study sample]), Emotional (5 items, � � .71), Social (5 items, � � .76), and School (5 items, � � .66) QL as well as a composite Psychosocial QL (15 items, � � .84) score based on the last three subscales and a Total QL (23 items, � � .87) score based on all items. This hierarchical scale structure has been replicated across racial/ethnic groups, including 1,106 Asian American chil- dren and adolescents (Limbers, Newman, & Varni, 2009). Each item posits a certain behavior being a problem in the past month (e.g., Physical subscale: “it is hard for you to do sports activity or exercise”; Emotional subscale: “you feel afraid or scared”; Social subscale: “you have trouble getting along with other kids”; School subscale: “it is hard to pay attention in class”). Answers are reported on a five-point scale (0 � never a problem, 4 � almost always a problem), but scale scores are calculated such that a
  • 23. higher score indicates better QL. These traditional QL measures were complemented by mea- sures of subjective well-being. Personal well-being was mea- sured with two subscales of the Self-Perception Profile (SPP) (Harter, 1983). The Global Self-Worth subscale (six items, � � .70) is a measure of general self-perception. Construct validity is supported by substantial differences in scores between T hi s do cu m en t is co py ri gh te d by th e
  • 27. t to be di ss em in at ed br oa dl y. 15QUALITY OF LIFE AMONG ASIAN AMERICAN YOUTH healthy youth and those with depression and anxiety problems (Muris, Meesters, & Fijen, 2003). The Physical Appearance subscale (6 items, � � .65) is used to measure the child’s satisfaction with his or her physical appearance, in contrast to the PedsQL Physical subscale, which is used to measure phys- ical challenges and discomforts the child may be experiencing. Construct validity for the Physical Appearance subscale is supported for example by finding expected differences among obese, overweight, and normal weight youth (Wallander et al., 2009). These validity studies did not make any references to including Asian American youth. For both subscales, youth are asked for each item to identify which contrasting description
  • 28. best fits them (e.g., Global Self-Worth subscale; “some kids like the kind of person they are, other kids often wish they were someone else”; Physical Appearance subscale: “some kids wish their body was different, other kids like their body the way it is”) and how much (sort of true, really true). Higher scores indicate better personal well-being. Social well-being was measured with the Social Anxiety Scale for Children-Revised Fear of Negative Evaluation subscale (six items, � � .88), which focuses on issues of interpersonal sensi- tivity (e.g., “you worry about being teased”), using a five-point scale (1 � not true at all, 5 � always true) (La Greca & Lopez, 1998). This subscale has demonstrated convergent validity, with children with negative peer interactions reporting higher scores than their more confident and better socialized peers (Ginsburg, LA Greca, & Silverman, 1998). Although the larger U.S. ethnic groups were included, the sample did not include Asian American youth. We reversed the subscale score, such that a higher score indicated better social well-being. Overall health status (OHS) was reported by the parent using the single item: “In general, would you say your child’s health is . . ..” with a five-point response scale (excellent, very good, good, fair, poor). An association has been demonstrated between parents’ perception of their child’s health status and actual health status (National Center for Health Statistics, 1972). Findings from the use of this item in numerous child health surveys with ethnically diverse samples, including Asian American youth, have been consistent with theoretical expectations and support its validity as
  • 29. a measure of OHS (Bauman, Silver, & Stein, 2006; Bramlett & Blumberg, 2007; Kohen et al., 2007). Herein higher scores indicate better health status. Table 1 Sample Demographics Total analysis sample (n � 4,972) Asian American (n � 148) African American (n � 1,755) Hispanic (n � 1,813) White (n � 1,256) Raw n Wtd % Wtd % Wtd % Wtd % Wtd % Highest education by parent �9th grade 678 18 0 2 39 0 Some high school 538 13 1 12 18 4 High school graduate 956 21 14 31 19 11 Some college or 2-yr. degree 1,298 24 20 37 17 23 Bachelor degree 800 14 30 13 5 35
  • 30. �Bachelor degree 589 10 35 6 2 27 Household income as % FPL �100% 1,559 38 15 47 50 7 100–199% 999 23 27 25 28 11 200–299% 616 13 10 14 12 13 300–399% 354 7 13 6 4 15 400–499% 338 6 16 4 3 15 �500% 709 13 19 5 3 40 Youth’s generational status Born in United States 4,490 90 71 99 81 97 Born outside United States 450 10 29 1 19 3 Caregiver’s generational status Born in United States 3,262 60 18 96 22 93 Born outside United States 1,677 40 82 4 78 7 Household size (Mdn) — 4 4 4 5 4 Family structure Two biological parents 2,284 48 66 21 57 65 Other 2,652 52 35 79 43 35 English spoken in home (if no, self-rated proficiency level) Yes 3,000 54 18 96 10 91 No/Very well 526 11 32 3 17 5 No/Well 389 9 39 1 16 4 No/Not well 696 18 11 0 39 0 No/Not at all 321 9 0 0 20 0 Note. Sample constituted by Asian American, African American, Hispanic, or White participants in Healthy Passages Wave 1; n � 4,972 (unweighted
  • 31. cases); % is calculated with weights to reflect sampling. FPL � Federal Poverty Level. T hi s do cu m en t is co py ri gh te d by th e A m er ic
  • 35. ss em in at ed br oa dl y. 16 FRADKIN ET AL. For race/ethnicity, the parent was asked whether the child be- longs to any of the following categories: American Indian/Alaskan Native, Asian, African American, Hispanic/Latino, Native Hawai- ian/Pacific Islander, White, or other. Using Census categories, the child was classified as Hispanic if the parent indicated Hispanic ethnicity regardless of responses regarding race, and Asian and Native Hawaiian/Pacific Islanders were combined into the Asian American category. Youth not categorized as Hispanic were clas- sified as African American, white, Asian American, or other, with the latter group being excluded from the analysis. Because socioeconomic status (SES) is multifaceted (Chen, Martin, & Matthews, 2006), no single variable adequately
  • 36. captures this construct, especially for racial/ethnic minorities (Kauffman, Cooper, & McGee, 1997; Williams, 1999). An SES composite index was formed as the average of standardized parent reported highest level of education completed (six categories, treated lin- early) and standardized household income transformed as percent of federal poverty level (continuous). Data Analysis All 10 scale scores used to measure QL well-being, and health were retained for the primary analysis, but to reduce the likelihood of spurious results resulting from correlated measures, a Bonfer- roni corrected significance level of p � .005 (.05/10) was used. These outcome variables were measured on continuous scales, with the exception of the five-point ordinal OHS scale, which was analyzed as linear. While descriptive information is provided for the outcome variables in their original measurement scales, stan- dardized Z-scores (M � 0.00, SD � 1.00) were used for all analyses to enable comparisons across variables. All analyses were performed using SPSS Complex Sampling module with weighted data to adjust for the complex survey design, which included clustered sampling of schools with unequal probability to improve the ability to estimate racial/ethnic disparities. The distribution of all model residuals adequately conformed to the assumptions for the use of General Linear Model (GLM), which was applied to
  • 37. each outcome measure. Possible differences within the Asian American subgroup were addressed first. Because NH/PIs can be argued to be culturally distinct from other Asian American groups (e.g., Mau, Sinclair, Saito, Baumhofer, & Kaholokula, 2009), preliminary analyses were conducted to ascertain possible differences between the NH/PI (n � 12) and the remaining Asian American (n � 136) youth. Differences were found on only Global Self-Worth, with Asian American youth reporting significantly higher than their NH/PI peers. The absence of within group differences on the nine remaining measures suggested that the within groups variance would likely be smaller than the variance between the four main racial/ethnic groups. Thus, analysis proceeded on the aggregated subgroup (n � 148), thereby maximizing statistical power. In the first step, the model consisted of main effects for race/ ethnicity (four categories) and gender (two categories) and their interaction. However, because no interaction reached significance ( p � .005), the interaction term was dropped from the model and the analysis was repeated with just the main effects. The main effect for gender was retained in all models but is not of substan- tive interest and thus is not further addressed. In the second step, the GLM analysis included race/ethnicity and gender with adjust- ment for SES. Significant main effects for race/ethnicity were examined by comparing Asian Americans to each of the other three racial/ethnic groups, with Wald F tests with significance set
  • 38. at p � .005. Results Racial/Ethnic Disparities Table 2 reports unadjusted descriptive statistics for the 10 out- come variables, and Table 3 shows results from the unadjusted and adjusted GLM models, The standardized unadjusted means for all outcomes by race/ethnicity are graphed in Figure 1. As seen in Table 3, there were significant unadjusted differences between racial/ethnic groups for all 10 outcome measures, with eight being significant for the Asian American group. The finding of larger between groups differences (eight) overall than differences within the Asian American group (one) supported the earlier decision to include the NH/PI youth in the Asian American subgroup. Post hoc analysis indicated that Asian American youth had better self- Table 2 Unadjusted Means (SE) for Outcome Variables Outcome measure Score range Total analysis sample Asian American African American Hispanic White Quality of life Total 0–100 78.28 (.323) 79.35 (.844) 76.89 (.444) 75.88 (.447) 81.01 (.561) Physical 0–100 84.23 (.283) 83.56 (.748) 84.04 (.409) 81.95
  • 39. (.469) 87.39 (.400) Psychosocial 0–100 75.11 (.389) 77.11 (1.050) 73.08 (.528) 72.65 (.478) 77.60 (.700) Emotional 0–100 70.70 (.489) 71.23 (1.479) 70.37 (.626) 67.52 (.584) 73.67 (.805) Social 0–100 79.45 (.500) 82.61 (1.407) 76.64 (.656) 76.96 (.602) 81.59 (.824) School 0–100 75.18 (.432) 77.47 (1.137) 72.23 (.581) 73.47 (.518) 77.54 (.806) Personal well-being Global self worth 6–24 19.53 (.083) 19.70 (.246) 19.15 (.105) 18.61 (.144) 20.66 (.125) Physical appearance 6–24 17.80 (.119) 17.57 (.384) 18.08 (.104) 17.00 (.141) 18.56 (.196) Social well-being 6–30 22.61 (.140) 21.76 (.488) 23.77 (.164) 21.44 (.214) 23.46 (.162) Overall health status 1–5 4.07 (.027) 4.21 (.098) 3.97 (.029) 3.59 (.037) 4.51 (.033) Note. Sample constituted by Asian American, African American, Hispanic, or White participants in Healthy Passages Wave 1; n � 4,972 (unweighted cases). Higher values indicate better outcome on all variables. T hi s do cu m en t
  • 44. 17QUALITY OF LIFE AMONG ASIAN AMERICAN YOUTH reported outcomes than Hispanic youth on six of the 10 outcome measures, with ES ranging from small to medium. Also, Asian American youth had better outcomes than African American youth on physical, social and school QL, with ES ranging from small to medium. Asian Americans had worse physical QL, global self- worth, and social well-being compared to white youth. Asian American youth also had worse social well-being than non- Hispanic African American youth. Adjusting for SES Differences Table 1 shows there are differences in SES among the racial/ ethnic groups. As presented in Table 3, when adjusting for SES, four of the 10 statistically significant racial/ethnic disparities in the outcome measures identified in the unadjusted analysis disap- peared. Of the eight measures that were significantly different among the Asian American group in the unadjusted analysis, all but three disappeared when adjusting for SES. Previous instances of Asian American youth having better outcomes than Hispanic and/or African American youth disappeared when adjusting for SES differences. However, Asian American youth continued to have worse physical QL, global self-worth, and social well- being than white youth and poorer social well-being than African Amer- ican youth. The standardized SES-adjusted means for all outcomes by race/ethnicity are graphed in Figure 1.
  • 45. Discussion This study demonstrates that there are substantial racial/ethnic disparities in youth’s QL. Asian American youth experienced worse status compared with white youth across three quite differ- ent domains of well-being—physical QL, global self-worth, social well-being—and experienced better status compared with His- panic youth on six measures and African American youth on three measures. However the advantages for Asian American youth over Hispanic and African American youth disappeared when the marked socioeconomic differences that are also present among the racial/ethnic groups were taken into account. Thus the observed advantages attributed to Asian American youth may be largely attributable to their advantageous, on average, SES compared with other racial/ethnic minority groups. In contrast, the differences between Asian American and white youth remained after taking into account these socioeconomic differences. In sum, these find- ings suggest that the disparities that favor white youth over Asian American youth exist independent of SES, in contrast to those that favor Asian American over Hispanic and African American youth, which may be explained by SES. A theoretical rationale for the observed advantages attributed to Asian American youth can be found in the social gradient theory (Marmot, Rose, Shipley, & Hamilton, 1978). Foundational to
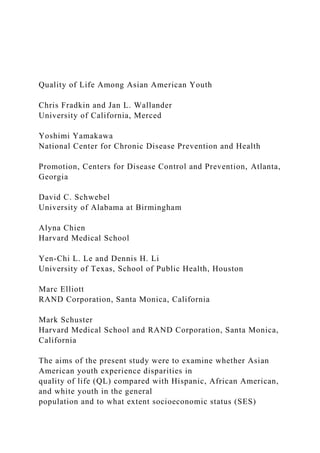
  • 46. much of disparities research, this theory articulates the positive and significant relationship between health and SES. Framed within this theory, the rationale for the observed advantages of Asian American youth over Hispanic and African American youth may be directly attributed to the socioeconomic differences between the groups, as evidenced by those advantages disappearing when SES is introduced into the model. A rationale for why the disadvantages of Asian American youth compared with white youth did not disappear when the same differences between groups was taken into account poses a more complex question that requires further research focused on this question. One issue that may be considered is the universality of the QL construct (Koot & Wallander, 2001) and whether QL can be measured using the same instrument across cultures. We argue it is useful to do so for among other reasons to stimulate more focused research into QL of disparate groups of youth. For exam- ple, interesting research has followed the finding of cross- cultural differences in parent-reported behavior problems in children and adolescents (Verhulst & Achenbach, 1995). As noted in its de- scription previously, the PedsQL has considerable psychometric support for its applicability in a variety of cultures. Yet subtle differences in response style and reporting biases may exist that contribute to between group differences and should be examined. Our findings challenge findings from previous studies. We had expected Asian American youth to report physical QL in the range
  • 47. of the white youth. This was not the case, however, with the Asian American youth reporting poorer physical QL than the white youth in both the unadjusted and SES-adjusted models (d � �0.28 and �0.25, respectively). Unexpected, too, was that there was no disparity in emotional, social, or school QL between white and Asian American youth in either the unadjusted or SES-adjusted model. This was surprising because much of the literature (e.g., Rhee et al., 2003; Zhou et al., 2003) has suggested that Asian American youth experience deficits in both emotional and social areas. This discrepancy may be a result of our using a broad Table 3 Disparities in Quality of Life, Well-Being, and Health Associated With Race/Ethnicity Outcome measure Unadjusted main effects Race/Ethnicity Wald F SES adjusted main effects Race/Ethnicity Wald F Quality of life Total 20.02�� — AS � H Physical 27.96�� 6.54��
  • 48. W � AS W � AS Psychosocial 15.66�� — AS � AA, H Emotional 12.97�� — (n.s.) Social 12.21�� — AS � H, AA School 15.02�� 5.97� AS � H, AA (n.s.) Personal well-being Global self worth 45.59�� 9.21�� W � AS � H W � AS Physical appearance 17.66�� 7.96�� (n.s.) (n.s.) Social well-being 35.30�� 28.67�� AA, W � AS AA, W � AS Overall health status 128.84�� 38.68�� AS � H (n.s.) Note. Only significant results are reported; significant ( p � .005) post hoc group differences are reported in reference to Asian American group; n.s., post hoc difference not significant as referenced to Asian American group; � indicates better outcome; W � White (non-Hispanic);
  • 49. AS � Asian American; AA � African American (non-Hispanic); H � Hispanic. � p � .005. �� p � .001. T hi s do cu m en t is co py ri gh te d by th e A m er
  • 53. di ss em in at ed br oa dl y. 18 FRADKIN ET AL. measure of functioning in these domains, whereas previous re- search has used more specific and focused measurements. We did find, however, a disparity in some of our adjunct psychosocial measures that favored white over Asian American youth (global self-worth, social well-being) and African American over Asian American youth (social well-being) in both our unad- justed and SES-adjusted models. These findings are consistent with the current literature that reports deficits in psychosocial well-being among Asian American youth and adolescents. Future research might explore the relationship between these adjunct measures (global self-worth, social well-being) and our psychos-
  • 54. ocial QL measures among Asian American and non-Asian Amer- ican youth. Future research might also explore the influence of parent– child relationship—and more specifically, parental expectation— on Asian American youth’s QL. While the literature suggests that parental expectation of Asian American children can be over- whelming (Kibria, 1993) and is tied to increased risk of anxiety, depression, and low self-esteem (Park & Kim, 2006), there is no study that we know of that examines its influence on children’s QL. Future research might explore this relationship both inside and outside the home. In light of this study’s finding of low social well-being among Asian American youth, future research might explore the quality of friends and social circles among Asian American youth inside the school environment. Are there notice- able differences across racial/ethnic groups regarding social sup- port for youth in the school environment? This could be especially pertinent in light of the high rates of on-campus harassment Asian American students report from their African American and His- panic peers (Rosenbloom & Way, 2004). Among limitations in this research, first is the relatively small size of the sample of Asian Americans here. Findings from this study are therefore best viewed as preliminary and stimulation for further research. Moreover, as with the 2003–2004 National Sur- vey of Children’s Health (Kogan & Newacheck, 2007) and the 2001–2004 National Health and Nutrition Examination Survey
  • 55. (Braun et al., 2008), our study had no survey materials for non- English or non-Spanish speaking families. Hence, the least accul- -0.6 -0.4 -0.2 0.0 0.2 0.4 0.6 Q L- To ta l Q L- P h ys Q L-
  • 60. -B O H S Z Asian-Amer Afr-Amer Hispanic White Figure 1. Z-score transformed means for outcome measures across race/ethnicity. Upper panel, Unadjusted means; Lower panel, Adjusted means. Higher values indicate better outcome on all variables; SES used as a covariate in adjusted model. QL, quality of life; Psych, Psychosocial; Emo, Emotional; SPP, Self-Perception Profile; GSW, Global-Self-Worth; PA, Physical Appearance; W- B, Well-being; OHS, overall health status. T hi s do cu m en
  • 65. 19QUALITY OF LIFE AMONG ASIAN AMERICAN YOUTH turated families of the pool were likely excluded from participation based on low proficiency of English. Another limitation of the study is its aggregation of ethnically and culturally diverse groups into the entity we call “Asian American.” Studies (e.g., Barnes, Adams, & Powell-Griner, 2008) show that there is sizable varia- tion in many aspects of health among Chinese, Filipino, Asian Indian, Japanese, Vietnamese, and Korean groups, yet like most survey studies we were unable to disaggregate this group. Another possible influence on QL and health not examined in our study is acculturation. As a moderating and mediating variable, accultura- tion is influential in affecting children’s health. An example is the inverse relationship between acculturation and healthy weight class among children and adolescents, with each successive gen- eration more at risk for obesity (Popkin & Udry, 1998). It should be valuable to examine QL in relation to acculturation in future research. Finally, whereas considerable support for the validity of the PedsQL and equivalence of the measurement structure in different cultures exist already, future research would do well to continue to examine the use of this and related measures across cultures. This study is the first we know of to examine differences between Asian American and non-Asian youth in broadly
  • 66. concep- tualized QL, while accounting for socioeconomic contextual fac- tors. These types of measures may describe the health and well- being of children and adolescents in the general population more comprehensively than conventional mortality and morbidity mea- sures and provide better identification of unrecognized conditions, social and emotional problems, and poor functioning (Koot & Wallander, 2001; Szilagyi & Schor, 1998). The March 2011 U.S. Census Brief (Humes et al., 2011) reports that in the decade between 2000 and 2010 the Asian population in the United States “experienced the fastest rate of growth” of any racial/ethnic group. In light of these statistics, it will serve the children of this group and our population as a whole to better understand the challenges of health and well-being of Asian Amer- ican children. References Barnes, P. M., Adams, P. F., & Powell-Griner, E. (2008). Health charac- teristics of the Asian adult population: United States, 2004 – 2006. Hyattsville, MD: National Center for Health Statistics, 1–24. Bauman, L. J., Silver, E. J., & Stein, R. E. (2006). Cumulative social disadvantage and child health. Pediatrics, 117, 1321–1328. doi:10.1542/
  • 67. peds.2005-1647 Bloom, B., Dey, A. N., & Freeman, G. (2006). Summary health statistics for U.S. children: National health interview survey, National Center for Health Statistics. Washington, DC: National Center for Health Statistics. Bramlett, M. D., & Blumberg, S. J. (2007). Family structure and children’s physical and mental health. Health Affairs, 26, 549 –558. doi:10.1377/ hlthaff.26.2.549 Braun, J. M., Froehlich, T. E., Daniels, J. L., Dietrich, K. N., Hornung, R., Auinger, P., & Lanphear, B. P. (2008). Association of environmental toxicants and conduct disorder in U.S. children: NHANES 2001–2004. Environmental Health Perspectives, 116, 956 –962. doi:10.1289/ ehp.11177 Caplan, N., Choy, M. H., & Whitmore, J. K. (1991). Children of the boat people: A study of educational success. Ann Arbor, MI: University of Michigan Press. Centers for Disease Control and Prevention/National Council for Health Statistics. (1995). Health, United States 1994. Hyattsville, MD: U.S. Public Health Service.
  • 68. Centers for Disease Control and Prevention/National Council for Health Statistics. (1997). Monthly vital statistics report (Vol. 46). Hyattsville, MD: U.S. Public Health Service. Chang, L., Morrissey, R. F., & Koplewicz, H. S. (1995). Prevalence of psychiatric symptoms and their relation to adjustment among Chinese- American youth. Journal of the American Academy of Child & Adoles- cent Psychiatry, 34, 91–99. doi:10.1097/00004583-199501000- 00019 Chen, E., Martin, A. D., & Matthews, K. A. (2006). Understanding health disparities: The role of race and socioeconomic status in children’s health. American Journal of Public Health, 96, 702–708. doi:10.2105/ AJPH.2004.048124 Cremeens, J., Eiser, C., & Blades, M. (2006). Characteristics of health- related self-report measures for children aged three to eight years: A review of the literature. Quality of Life Research: An International Journal of Quality of Life Aspects of Treatment, Care & Rehabilitation, 15, 739 –754. doi:10.1007/s11136-005-4184-x Ginsburg, G. S., La Greca, A. M., & Silverman, W. K. (1998). Social
  • 69. anxiety in children with anxiety disorders: Relation with social and emotional functioning. Journal of Abnormal Child Psychology, 26, 175–185. doi:10.1023/A:1022668101048 Gong-Guy, E. (1987). Report on the California Southeast Asian Mental Health Needs Assessment (Contract No. 85-76282A-2). Sacramento, CA: California Department of Mental Health. Greene, M. L., Way, N., & Pahl, K. (2006). Trajectories of perceived adult and peer discrimination among Black, Latino, and Asian American adolescents: Patterns and psychological correlates. Developmental Psy- chology, 42, 218 –238. doi:10.1037/0012-1649.42.2.218 Grunbaum, J. A., Lowry, R., Kann, L., & Pateman, B. (2000). Prevalence of health risk behaviors among Asian American/Pacific Islander high school students. Journal of Adolescent Health, 27, 322–330. doi: 10.1016/S1054-139X(00)00093-8 Harter, S. (1983). Developmental perspectives on self-system. In E. M. Hetherington (Ed.), Handbook of child psychology: Vol 4. Social, emo- tional, and personality development (4th ed., pp. 275–283). New York, NY: Wiley.
  • 70. Hsia, J. (1988). Asian Americans in higher education and at work. Hills- dale, NJ: Lawrence Erlbaum. Humes, K. R., Jones, N. A., & Ramirez, R. R. (2011). Overview of race and Hispanic origin: 2010. 2010 census briefs. Retrieved from U.S. Census Bureau website: Http://www.census.gov/prod/cen2010/briefs/ c2010br-02.pdf Ishii-Kuntz, M., Gomel, J. N., Tinsley, B. J., & Parke, R. D. (2010). Economic hardship and adaptation among Asian American families. Journal of Family Issues, 31, 407– 420. doi:10.1177/ 0192513X09351271 Kauffman, J. S., Cooper, R. S., & McGee, D. L. (1997). Socioeconomic status and health in blacks and whites: The problem of residual con- founding and the resiliency of race. Epidemiology, 8, 621– 628. Kibria, N. (1993). Family tightrope: The changing lives of Vietnamese Americans. Princeton, NJ: Princeton University Press. Kogan, M. D., & Newacheck, P. W. (2007). Introduction to the volume on articles from the National Survey of Children’s Health. Pediatrics, 119, S1–S3. doi:10.1542/peds.2006-2089B Kohen, D. E., Brehaut, J. C., Garner, R. E., Miller, A. R., Lach,
  • 71. L. M., Klassen, A. F., & Rosenbaum, P. I. (2007). Conceptualizing childhood health problems using survey data: A comparison of key indicators. BMC Pediatrics, 7, 40. doi:10.1186/1471-2431-7-40 Koot, H. M., & Wallander, J. L. (Eds.). (2001). Quality of life in child and adolescent illness: Concepts, methods and findings. East Sussex, UK: Brunner-Routledge. La Greca, A. M., & Lopez, N. (1998). Social anxiety among adolescents: T hi s do cu m en t is co py ri gh te
  • 75. an d is no t to be di ss em in at ed br oa dl y. 20 FRADKIN ET AL. http://dx.doi.org/10.1542/peds.2005-1647 http://dx.doi.org/10.1542/peds.2005-1647 http://dx.doi.org/10.1377/hlthaff.26.2.549 http://dx.doi.org/10.1377/hlthaff.26.2.549 http://dx.doi.org/10.1289/ehp.11177 http://dx.doi.org/10.1289/ehp.11177 http://dx.doi.org/10.1097/00004583-199501000-00019
  • 76. http://dx.doi.org/10.2105/AJPH.2004.048124 http://dx.doi.org/10.2105/AJPH.2004.048124 http://dx.doi.org/10.1007/s11136-005-4184-x http://dx.doi.org/10.1023/A:1022668101048 http://dx.doi.org/10.1037/0012-1649.42.2.218 http://dx.doi.org/10.1016/S1054-139X%2800%2900093-8 http://dx.doi.org/10.1016/S1054-139X%2800%2900093-8 www.census.gov/prod/cen2010/briefs/c2010br-02.pdf www.census.gov/prod/cen2010/briefs/c2010br-02.pdf http://dx.doi.org/10.1177/0192513X09351271 http://dx.doi.org/10.1177/0192513X09351271 http://dx.doi.org/10.1542/peds.2006-2089B http://dx.doi.org/10.1186/1471-2431-7-40 Linkages with peer relations and friendships. Journal of Abnormal Child Psychology, 26, 83–94. doi:10.1023/A:1022684520514 Limbers, C. A., Newman, D. A., & Varni, J. W. (2009). Factorial invari- ance of child self-report across race/ethnicity groups: A multigroup confirmatory factor analysis approach utilizing the PedsQL 4.0 Generic Core Scales. Annals of Epidemiology, 19, 575–581. doi:10.1016/ j.annepidem.2009.04.004 Marmot, M. G., Rose, G., Shipley, M., & Hamilton, P. J. (1978). Employ- ment grade and coronary heart disease in British civil servants. Journal of Epidemiology and Community Health, 32, 244 –249. doi:10.1136/ jech.32.4.244
  • 77. Mau, M. K., Sinclair, K., Saito, E. P., Baumhofer, K. N., & Kaholokula, J. K. (2009). Cardiometabolic health disparities in native Hawaiians and other Pacific Islanders. Epidemiologic Reviews, 31, 113–129. doi: 10.1093/ajerev/mxp004 Muris, P., Meesters, C., & Fijen, P. (2003). The self-perception profile for children: Further evidence for its factor structure, reliability, and valid- ity. Personality and Individual Differences, 35, 1791–1802. doi: 10.1016/S0191-8869(03)00004-7 National Center for Health Statistics. (1972). Examination and health history findings among children and youth 6 –17 years. Vital and Health Statistics, 2, 1A. Olson, L. M., Lara, M., & Frintner, M. P. (2004). Measuring health status and quality of life for US children: Relationship to race, ethnicity, and income status. Ambulatory Pediatrics, 4, 377–386. doi:10.1367/A03- 156.1 Onoda, L. (1977). Neurotic-stable tendencies among Japanese American sanseis and Caucasian students. Journal of Non-White Concerns in Personnel & Guidance, 5, 180 –185. doi:10.1002/j.2164- 4950.1977.tb00065.x
  • 78. Pang, V. O. (1991). The relationship of test anxiety and math achievement to parental values in Asian-American and European-American middle school students. Journal of Research & Development in Education, 24, 1–10. Park, Y., & Kim, U. (2006). Family, parent– child relationship and aca- demic achievement in Korea. In K. Uichol, K. Yang, & K. Hwang (Eds.), Indigenous and cultural psychology: Understanding people in context (pp. 421– 443). New York, NY: Springer. Popkin, B. M., & Udry, J. R. (1998). Adolescent obesity increases signif- icantly in second and third generation U.S. immigrants: The national longitudinal study of adolescent health. The Journal of Nutrition, 128, 701–706. Rhee, S., Chang, J., & Rhee, J. (2003). Acculturation, communication patterns, and self-esteem among Asian and Caucasian American adoles- cents. Adolescence, 38, 749 –768. Rosenbloom, S. R., & Way, N. (2004). Experiences of discrimination among African American, Asian American, and Latino adolescents in an urban high school. Youth & Society, 35, 420 – 451.
  • 79. doi:10.1177/ 0044118X03261479 Szilagyi, P. G., & Schor, E. L. (1998). The health of children. HSR: Health Services Research, 33, 1001–1039. Varni, J. W., Burwinkle, T. M., Seid, M., & Skarr, D. (2003). The PedsQL 4.0 as a pediatric population health measure: Feasibility, reliability, and validity. Ambulatory Pediatrics, 3, 329 –341. doi:10.1367/1539- 4409(2003)003�0329:TPAAPP�2.0.CO;2 Varni, J. W., Limbers, C. A., & Burwinkle, T. M. (2007). Parent proxy- report of their children’s health-related quality of life: An analysis of 13,878 parents’ reliability and validity across age subgroups using the PedsQL 4.0 Generic Core Scales. Health and Quality of Life Outcomes, 5, 1–10. doi:10.1186/1477-7525-5-1 Varni, J. W., Seid, M., & Kurtin, P. S. (2001). The PedsQL 4.0: Reliability and validity of the Pediatric Quality of Life Inventory Version 4.0 Generic Core Scales in healthy and patient populations. Medical Care, 39, 800 – 812. doi:10.1097/00005650-200108000-00006 Verhulst, F. C., & Achenbach, T. M. (1995). Empirically based assessment and taxonomy of psychopathology. Cross-cultural applications:
  • 80. A re- view. European Child & Adolescent Psychiatry, 4, 61–76. doi:10.1007/ BF01977734 Wallander, J. L., Taylor, W. C., Grunbaum, J. A., Franklin, F. A., Harrison, G. G., Kelder, S. H., & Schuster, M. A. (2009). Weight status, quality of life, and self-concept in African American, Hispanic, and white fifth- grade children. Obesity, 17, 1363–1368. Wang, Y., & Beydoun, M. A. (2007). The obesity epidemic in the United States—Gender, age, socioeconomic, racial/ethnic, and geographic char- acteristics: A systematic review and meta-regression analysis. Epidemi- ologic Reviews, 29, 6 –28. doi:10.1093/epirev/mxm007 Williams, D. R. (1999). Race, socioeconomic status, and health: The added effects of racism and discrimination. Annals of the New York Academy of Sciences, 896, 173–188. doi:10.1111/j.1749- 6632.1999.tb08114.x Windle, M., Grunbaum, J. A., Elliott, M., Tortolero, S. R., Berry, S., Gilliland, J., . . . Shuster, M. (2004). Healthy passages. A multilevel, multimethod longitudinal study of adolescent health. American Journal of Preventive Medicine, 27, 164 –172. doi:10.1016/ j.amepre.2004.04.007
  • 81. Wong, F., & Halgin, R. (2006). The “Model Minority”, bane or blessing for Asian Americans? Journal of Multicultural Counseling and Develop- ment, 34, 38 – 49. doi:10.1002/j.2161-1912.2006.tb00025.x World Health Organization. (1948). Basic documents. Geneva, Switzer- land: World Health Organization. Retrieved from World Health Orga- nization site: http://apps.who.int/gb/bd/PDF/bd47/EN/constitution- en.pdf Yeh, M., McCabe, K., Hurlburt, M., Hough, R., Hazen, A., Culver, S., . . . Landsverk, J. (2002). Referral sources, diagnoses, and service types of youth in public outpatient mental health care: A focus on ethnic minor- ities. The Journal of Behavioral Health Services & Research, 29, 45– 60. doi:10.1007/BF02287831 Yoo, H. C., Burrola, K. S., & Steger, M. F. (2010). A preliminary report on a new measure: Internalization of the Model Minority Myth Measure (IM-4) and its psychological correlates among Asian American college students. Journal of Counseling Psychology, 57, 114 –127. doi:10.1037/ a0017871 Yu, S. M., Huang, Z. J., & Singh, G. K. (2004). Health status
  • 82. and health services utilization among US Chinese, Asian Indian, Filipino, and other Asian/Pacific islander children. Pediatrics, 113, 101–107. doi:10.1542/ peds.113.1.101 Yu, S. M., & Vyas, A. N. (2009). The Health of Children and Adolescents. In C. Trinh-Shevrin, N. S. Islam, & M. J. Rey (Eds.), Asian American communities and health: Context, research, policy, and action (pp. 107–131). San Francisco, CA: Jossey-Bass. Zhou, Z., Peverly, S. T., Xin, T., Huang, A. S., & Wang, W. (2003). School adjustment of first-generation Chinese-American adolescents. Psychol- ogy in the Schools, 40, 71– 84. doi:10.1002/pits.10070 Received September 28, 2011 Revision received May 17, 2012 Accepted June 4, 2012 � T hi s do cu m en
  • 87. 21QUALITY OF LIFE AMONG ASIAN AMERICAN YOUTH http://dx.doi.org/10.1023/A:1022684520514 http://dx.doi.org/10.1016/j.annepidem.2009.04.004 http://dx.doi.org/10.1016/j.annepidem.2009.04.004 http://dx.doi.org/10.1136/jech.32.4.244 http://dx.doi.org/10.1136/jech.32.4.244 http://dx.doi.org/10.1093/ajerev/mxp004 http://dx.doi.org/10.1093/ajerev/mxp004 http://dx.doi.org/10.1016/S0191-8869%2803%2900004-7 http://dx.doi.org/10.1016/S0191-8869%2803%2900004-7 http://dx.doi.org/10.1367/A03-156.1 http://dx.doi.org/10.1367/A03-156.1 http://dx.doi.org/10.1002/j.2164-4950.1977.tb00065.x http://dx.doi.org/10.1002/j.2164-4950.1977.tb00065.x http://dx.doi.org/10.1177/0044118X03261479 http://dx.doi.org/10.1177/0044118X03261479 http://dx.doi.org/10.1367/1539- 4409%282003%29003%3C0329:TPAAPP%3E2.0.CO;2 http://dx.doi.org/10.1367/1539- 4409%282003%29003%3C0329:TPAAPP%3E2.0.CO;2 http://dx.doi.org/10.1186/1477-7525-5-1 http://dx.doi.org/10.1097/00005650-200108000-00006 http://dx.doi.org/10.1007/BF01977734 http://dx.doi.org/10.1007/BF01977734 http://dx.doi.org/10.1093/epirev/mxm007 http://dx.doi.org/10.1111/j.1749-6632.1999.tb08114.x http://dx.doi.org/10.1016/j.amepre.2004.04.007 http://dx.doi.org/10.1016/j.amepre.2004.04.007 http://dx.doi.org/10.1002/j.2161-1912.2006.tb00025.x http://dx.doi.org/10.1007/BF02287831 http://dx.doi.org/10.1037/a0017871 http://dx.doi.org/10.1037/a0017871 http://dx.doi.org/10.1542/peds.113.1.101