SlideShare une entreprise Scribd logo
1  sur  104
By: Anand Bobade (nmbobade@gmail.com)
Plan Cost
management
Estimate Cost Determine Budget Control cost
PMBOK Chapter 7 :
Project Cost Management
(Part 2)
Learn Project Management & prepare for PMP exam:
• Learn visually
• Detailed coverage of all PMP concepts
• Sample Questions
Monitoring &
Controlling
Planning
By: Anand Bobade (nmbobade@gmail.com)By: Anand Bobade (nmbobade@gmail.com)
7.1 Plan Cost Management:
Establishes the Policies, procedures, and documentation for
planning, managing, expending, controlling project costs.
7.2 Estimate Cost:
Developing an APPROXIMATION of the monetary resources needed
to complete project activities.
7.3: Determine Budget:
AGGREGATING the estimated costs of individual activities or WP to
establish cost baseline.
7.4 Control Cost:
MONITORING the status to update costs and managing changes to
the cost baseline
7. Project Cost Management Processes
By: Anand Bobade (nmbobade@gmail.com)
Aggregating the estimated costs of individual
activities or work packages to establish an
authorized cost baseline.
Determines the cost baseline against which project
performance can be monitored and controlled.
7.3 Determine Budget -> Definition
Cost Baseline
Aggregation
Activity cost estimates Contingency Reserve
By: Anand Bobade (nmbobade@gmail.com)By: Anand Bobade (nmbobade@gmail.com)
Input (9)
• Cost management
plan
• Scope baseline
• Activity cost
estimates
• Basis of estimates
• Project schedule
• Resource calendars
• Risk register
• Agreements
• OPA
Tools &
Techniques (5)
• Cost aggregation
• Reserve analysis
• Expert judgment
• Historical
relationships
• Funding limit
reconciliation
Outputs (3)
• Cost baseline
• Project funding
requirements
• Project documents
updates
7.3 Determine Budget
By: Anand Bobade (nmbobade@gmail.com)
Cost
Management
Plan
Scope Baseline
Activity cost
estimates
Basis of
estimates
Project
schedule
Resource
calendars
Risk Register Agreements OPA
7.3 Determine Budget -> Inputs
By: Anand Bobade (nmbobade@gmail.com)
Cost
Management
Plan
Define how project costs will be planned, structured, and
controlled.
Provide information about how to execute determine Budget
Process.
Specify preferred method or techniques to be used.
Provides below key details.
Units of
Measure
Level of
Precision
Level of
Accuracy
Process
Description
Control account
7.3 Determine Budget->Input->Cost Management Plan
By: Anand Bobade (nmbobade@gmail.com)
Scope Baseline
• Project Scope (Inclusion & exclusions)
• Assumptions and constraints.
Scope
Statement
• Activity grouped into deliverables or
work packages.
• WBS provide framework for cost
management.
WBS
• Control account
• List of Deliverables
• Resources
WBS
Dictionary
7.3 Determine Budget->Input->Scope Baseline
By: Anand Bobade (nmbobade@gmail.com)
Activity Cost
Estimates
Cost estimate
for each
activity
Activity
Grouping
Cost estimate
for each Work
package
Direct Cost Indirect Cost Variable cost Fixed Cost
Estimation of the probable costs required to
complete project work. (summary form or in detail)
7.3 Determine Budget->Input->Activity Cost Estimate
By: Anand Bobade (nmbobade@gmail.com)
Basis of
Estimates
Documentation consist of :
Method of
estimations
All
assumptions
Any known
constraints
Scope of
Work
The supporting documentation that provide a
clear & complete understanding of how cost
estimate was derived.
7.3 Determine Budget-> Input-> Basis of Estimate
Estimate Cost Determine Budget
Basis of
Estimates
Activity Cost
Estimates
By: Anand Bobade (nmbobade@gmail.com)
Project Schedule
Schedule provide overall timeline with milestones.
Cost is always time bound, hence its important to know
when these activities are scheduled.
Information can be used to determine aggregated cost
for specific period & payment milestones.
7.3 Determine Budget->Input->Project schedule
By: Anand Bobade (nmbobade@gmail.com)
Risk Register
Examine cost & schedule related risks.
Reserve should be planned to mitigate & inspect Risks.
Potential benefits from the positive risk should be
considered.
7.3 Determine Budget-> Input->Risk Register
By: Anand Bobade (nmbobade@gmail.com)
Resource
Calendars
Identifies the working days and shifts on which each
specific resource is available.
Provides details about when & how long identified
project resource will be available.
Helps to determine resource cost.
7.3 Determine Budget->Input->Resource Calendar
By: Anand Bobade (nmbobade@gmail.com)
Agreements
Provide information about contracted resource costs
like Human resource cost, equipment costs etc
Provide payment milestone of each contractual
agreements.
Project can have one or more agreements.
7.3 Determine Budget ->Inputs->Agreement
By: Anand Bobade (nmbobade@gmail.com)
OPA
Existing cost policies, procedures, and guidelines (e.g.,
Budget approval process)
Financial controls procedures.
Cost Budgeting tools.
Financial reporting methods/templates.
7.3 Determine Budget->Input->OPA
By: Anand Bobade (nmbobade@gmail.com)By: Anand Bobade (nmbobade@gmail.com)
How project costs will be managed and controlled
Project scope statement , WBS & WBS dictionary
Cost estimates for each activity within a work package are
aggregated
Any basic assumptions dealing with the inclusion or exclusion
of indirect or other costs in the project budget
Information can be used to aggregate costs to the calendar
periods in which the costs are planned to be incurred.
7.3 Determine Budget -> Inputs overview
By: Anand Bobade (nmbobade@gmail.com)By: Anand Bobade (nmbobade@gmail.com)
Provide information on which resources are assigned to the
project and when they are assigned
To consider how to aggregate the risk response costs
Applicable agreement information and costs relating to
products purchase
Existing policies, procedures, and guidelines; Cost budgeting
tools, Reporting methods
7.3 Determine Budget -> Inputs overview
By: Anand Bobade (nmbobade@gmail.com)
Cost
Aggregation
Reserve
Analysis
Expert
Judgment
Historical
Relationships
Funding limit
Reconciliation
7.3 Determine Budget-> Tools & Techniques
By: Anand Bobade (nmbobade@gmail.com)
Cost
Aggregation
Accumulation of costs based on WBS structure.
Considers distribution of payments w.r.t schedule
base line.
7.3 Determine Budget->T&T->Cost Aggregation
Cost estimates are aggregated by:
Work packages Control accounts Entire project.
Activity (Level1)
Work Package (Level2)
Component/control Account
(Level3)
Project (Level4) 500 K
200 K
100 100
300K
100 150
100 50
50
By: Anand Bobade (nmbobade@gmail.com)
Cost
Aggregation
It is placed at the selected management points in the WBS.
It has unique code , which can be linked to accounting system.
CRM Project –
Cost Baseline
(850 K)
Call Center
upgrade
(100 K)
Installations
(40K)
Call center
software
Customization
(60 K)
Contact Center
setup
(250K)
Infrastructure
setup
(200 K)
Software
implementation
(50 K)
CRM system
implementation
(500K)
CRM System Cost
(400 K)
Software
Customization &
implementation
(100 K)
Control Account (CA) : It is a management control
point where scope, cost and schedule are integrated
7.3 Determine Budget->T&T->Cost Aggregation
CA01 CA02 CA03
By: Anand Bobade (nmbobade@gmail.com)
Reserve Analysis
Management Reserve:
• Project budget withheld for management
control purposes.
• Reserved for unforeseen work that is within
scope of the project (unknown unknowns).
• Not included in the cost baseline
• Part of overall project budget & funding
requirements.
Contingency Reserve:
• Budget within cost baseline
• Allocated for identified & accepted risks
(known-unknowns)
• Contingency should be clearly documented.
• Part of the cost baseline & overall funding
requirements.
7.3 Determine Budget->T&T->Reserve Analysis
By: Anand Bobade (nmbobade@gmail.com)
Reserve Analysis
Activity contingency reserve
+ Activity Estimate
+ Work Package Estimates
Control Accounts
+COST BASELINE
PROJECT BUDGET 400
70 330
330
20 110
10010
200
18020
7.3 Determine Budget->T&T->Reserve Analysis
No
reserves
By: Anand Bobade (nmbobade@gmail.com)
Expert
Judgment
Guided by experience in an application area,
Knowledge Area, discipline, industry, or similar project
PM may apply experience & information from prior
similar projects.
Consultants, SME or financial experts can provide
budgeting expertise.
7.3 Determine Budget->T&T->Expert Judgment
By: Anand Bobade (nmbobade@gmail.com)
Historical
Relationships
• Home construction -> Cost per square meterSimple
• Software development Model
• Multiple adjustment factors, each of which has
numerous points within it.
• E.g., Code, integrations, function point, data migration
Complex
• Accurate Historical information is available
• Quantifiable parameters
• Scalable models (Can work with Large, small or phases of the projects)
Reliable
when:
Any historical relationships that result in parametric
estimates or analogous estimates.
It uses project characteristics (parameters) to develop
mathematical models to predict total project costs.
7.3 Determine Budget->T&T->Historical Relationship
By: Anand Bobade (nmbobade@gmail.com)
Funding limit
Reconciliation
The expenditure should be reconciled with any funding limits
on the commitment of funds for the project.
A variance between funding limits and planned expenditures
will sometimes necessitate rescheduling of work.
This is accomplished by placing imposed date constraints for
activities.
Q1 Q2 Q3 Q4
Project planned expenditure 100K 100K 100K 100K
Actual project cost 110K 115K
7.3 Determine Budget->T&T->Funding limit reconciliation
Project is moving fast ahead of schedule & hence spending more than planned.
However, management has Imposed Quarterly Funds limit on project.
Hence project has to re-schedule & slow down.
re-schedule & slow down
By: Anand Bobade (nmbobade@gmail.com)
Cost baseline Project funding
requirements
Project doc.
updates
7.3 Determine Budget -> Outputs
By: Anand Bobade (nmbobade@gmail.com)
Cost baseline
Approved version of time-phased project budget,
excluding any management reserves.
It is used as a basis for comparison to actual expenditure.
7.3 Determine Budget -> Outputs->Cost Baseline
0
500
1,000
1,500
2,000
2,500
3,000
Jan Feb Mar Apr May Jun Jul Aug Sep Oct Nov Dec
Thousands
Monthly Budget Cummulative Budget
By: Anand Bobade (nmbobade@gmail.com)
Project funding
requirements
The total funds required:
Cost baseline
•Projected expenditures
•Contingency Reserves
Management reserves (if any).
Total funding requirements derived from cost baseline.
Funding often occurs in incremental amounts that are not
continuous, and may not be evenly distributed.
7.3 Determine Budget->Outputs->Project funding Req.
It may also refer to source(s) of the funding.
By: Anand Bobade (nmbobade@gmail.com)By: Anand Bobade (nmbobade@gmail.com)
Approved version of the time-phased project budget,
excluding any management reserves, used as a basis for
comparison to actual results
Total funding requirements & periodic funding
requirements are derived from the cost baseline.
Risk Register, Activity register & Project schedule
7.3 Determine Budget -> Outputs
By: Anand Bobade (nmbobade@gmail.com)By: Anand Bobade (nmbobade@gmail.com)
7.3 Determine Budget->Data Flow Diagram
By: Anand Bobade (nmbobade@gmail.com)
7.3 Determine Budget -> Question1
Which of the following output of Determine Budget process
is used as an input in the Control Costs Process?
A. Project Funding Requirements
B. Cost Baseline
C. Project Document
D. None
A– Project Funding Requirements
Refer to ITTO of Determine Budget & Control cost processes
By: Anand Bobade (nmbobade@gmail.com)By: Anand Bobade (nmbobade@gmail.com)
To Learn Project Management, Contact Anand Bobade (055 5932004)
•nmbobade@gmail.com
•https://ae.linkedin.com/in/anandbobade
•http://www.slideshare.net/anandbobade
•Conduct Online training, Corporate Training, evening & weekend workshops.
By: Anand Bobade (nmbobade@gmail.com)By: Anand Bobade (nmbobade@gmail.com)
7.1 Plan Cost Management:
Establishes the Policies, procedures, and documentation for
planning, managing, expending, controlling project costs.
7.2 Estimate Cost:
Developing an APPROXIMATION of the monetary resources needed
to complete project activities.
7.3: Determine Budget:
AGGREGATING the estimated costs of individual activities or WP to
establish cost baseline.
7.4 Control Cost:
MONITORING the status to update costs and managing changes to
the cost baseline
7. Project Cost Management Processes
By: Anand Bobade (nmbobade@gmail.com)By: Anand Bobade (nmbobade@gmail.com)
0
100
200
300
400
500
600
Jan Feb Mar Apr May Jun Jul Aug Sep Oct Nov Dec
Thousands
Planned Actuals
Frequency of
measurement
Activity cost
WBS
components
(Control
accounts)
Total project
cost
7.4 Control Cost -> Introduction
Don’t include unapproved
change cost
Influence factor affecting cost
baselines
Manage changes & cost
overrun
Measure
Monitor
Control
Report
By: Anand Bobade (nmbobade@gmail.com)By: Anand Bobade (nmbobade@gmail.com)
• The factors that create changes to baselineInfluencing
• All change requests are acted on in a timely mannerEnsuring
• The actual changes when and as they occurManaging
• That cost expenditures do not exceed the authorized
funding by period, WBS ,activity, in totalEnsuring
• Cost performance to isolate and understand variancesMonitoring
• Work performance against funds expendedMonitoring
• Unapproved changes reported or resource usage;Preventing
• Appropriate stakeholders of all approved changes and
associated cost;Informing
• Expected cost overruns within acceptable limitsBringing
7.4 Control Cost
By: Anand Bobade (nmbobade@gmail.com)
Monitoring the status of the project to update the
project costs & managing changes to the cost baseline.
Provides the means to recognize variance from the plan
in order to take corrective action and minimize risk.
7.4 Control Cost
Monitoring Project
status
Update project
Cost
Manage cost
baseline changes
By: Anand Bobade (nmbobade@gmail.com)By: Anand Bobade (nmbobade@gmail.com)
Input (4)
• Project
Management
Plan
• Project
Funding
Requirements
• Work
Performance
Data
• OPA
Tools & Techniques (6)
• Earned value
management
• Forecasting
• To-complete
performance index
(TCPI)
• Performance reviews
• PM Software
• Reserve analysis
Outputs (6)
• Work
performance
information
• Cost forecasts
• Change
requests
• PMP updates
• Project
documents
updates
• OPA updates
7.4 Control Cost
By: Anand Bobade (nmbobade@gmail.com)
PMP Project funding
requirements
Work
performance data
OPA
7.4 Control Cost -> Input
By: Anand Bobade (nmbobade@gmail.com)By: Anand Bobade (nmbobade@gmail.com)
Cost baseline & Cost management plan.
Include projected expenditures plus anticipated liabilities (Cost
baseline with management reserves)
It includes progress information (started/ finished activities, their
progress) ,costs authorized and incurred.
Existing policies, procedures, and guidelines; Cost control tools;
Monitoring and reporting methods.
7.4 Control Cost -> Input
By: Anand Bobade (nmbobade@gmail.com)
Earned value
management
Forecasting To-complete
performance
index (TCPI)
Performance
reviews
Project
management
software
Reserve analysis
7.4 Control Cost -> Tools & Techniques
By: Anand Bobade (nmbobade@gmail.com)
Earned value
management
It combines SCOPE, SCHEDULE, & RESOURCE measurements to
assess project performance and progress.
It integrates the scope ,cost & schedule baselines, to form the
performance baseline
• It is authorized budget planned for work
to be accomplished.
Planned
Value (PV)
• Realized cost incurred for the work
performed on an activity during a
specific time period.
Actual cost
(AC)
• A measure of work performed
expressed in terms of the budget
authorized.
Earned
value (EV)
7.4 Control Cost -> T&T -> EVM
By: Anand Bobade (nmbobade@gmail.com)
Earned value Calculation based on the Percentage completion
• 100% of work completed
• EV = 100% of 10,000
• EV = 10,000
Day1
• Only 80% of work completed
• EV = 80% of 10,000
• EV = 8,000
Day2
• EV = EV of Day1 + EV of Day2
• EV = 10,000 + 8,000
• EV = 18,000
Combined EV
Schedule Planned Value (PV) Percentage Complete Actual Cost (AC)
Earn Value
(EV)
Day1 10,000 100% 10,000
Day2 10,000 80% 10,000
7.4 Control Cost -> T&T -> EVM
10,000
8,000
18,000
By: Anand Bobade (nmbobade@gmail.com)
EV Calculation based on planned vs actual work done.
7.4 Control Cost -> T&T -> EVM
Schedule
Planned
Work
Planned Value
(PV)
Actual
work
Actual Cost
(AC)
Earn Value (EV)
Day1 10 computer 10,000 9 computers 10,000
Day2 10 computer 10,000 10 computers 10,000
Plan : Install 10 computers each day costing 10,00 per day.
• Only 9 computer installed on Day1
• Hence, EV of spending 10,000 is only 9,000
Day1
• 10 computer installed on Day 2
• Hence, EV of spending 10,000 is 10,000
Day2
10,000
9,000
By: Anand Bobade (nmbobade@gmail.com)By: Anand Bobade (nmbobade@gmail.com)
7.4 Control Cost ->T&T-> EVM
Task/Days Day1 Day2 Day3 Day4 Day5 Day6 Day7
Setup Setup
Installation 10 comp 10 comp 10 comp 10 comp 10 comp
Training & Handover Handover
Project : Install 50 computers for school Lab.
• Assumption:
• Resource cost is 1000/day. One resource first & last day.
• Two resources during execution (Day 2 to Day6)
Planned cost(Cumulative) 1,000 3,000 5,000 7,000 9,000 11,000 12,000
Planned cost 1,000 2,000 2,000 2,000 2,000 2,000 1,000
We could not get resource with 1,000/per day, hence hired resource with 1100 per day
Actual cost (Cumulative) 1,100 3,300 5,500 7,700
Actual cost 1,100 2,200 2,200 2,200
Earn Value 1,000 1,600 1,600 1,600
Earn Value (Cumulative) 1,000 2,600 4,200 5,800
Only 8 computer installed
on each day, so 80% earn
value
8 / 10 8 / 10 8 / 10
By: Anand Bobade (nmbobade@gmail.com)By: Anand Bobade (nmbobade@gmail.com)
7.4 Control Cost -> T&T -> EVM
PV: 7,000
BAC: 12,000
AC: 7,700
EV: 5,800
-
2,000
4,000
6,000
8,000
10,000
12,000
14,000
Day1 Day2 Day3 Day4 Day5 Day6 Day7
Cost Variance
Schedule Variance
Hints about Formula:
Always start with “EV”
Variance uses “-”
Index uses “/”
Only AC is used for Cost
• SPI = EV/PV
Schedule
performance
index
• CPI = EV/ACCost performance
index
• SV = EV –PV
Schedule
variance
• CV= EV − ACCost variance
By: Anand Bobade (nmbobade@gmail.com)By: Anand Bobade (nmbobade@gmail.com)
7.4 Control Cost -> T&T -> EVM
• = 5,800 –7,000
• = -1,200
Schedule variance
SV = EV – PV
• = 5,800− 7,700
• = -1,900
Cost variance
CV = EV − AC
• = 5,800 / 7,000
• = 0.82
Schedule performance
Index
SPI = EV / PV
• = 5,800 / 7,700
• = 0.75
Cost performance Index
CPI = EV / AC
Indexes
CPI
SPI
> 1
Under
budget
Ahead of
schedule
< 1
Over
Budget
Behind
schedule
= 1
On Budget
(planned
cost)
On
Schedule
Project is over
budget & behind
Schedule
By: Anand Bobade (nmbobade@gmail.com)By: Anand Bobade (nmbobade@gmail.com)
Indexes
CPI
SPI
> 1
You are earning
more than the
spending. In other
words, you are
under budget.
More work has
been completed
than the planned
work. In other
words, you are
ahead of schedule.
< 1
You are earning
less than the
spending. In other
words, you’re over
budget
Less work is
completed than
the planned work.
In other words, you
are behind
schedule.
= 1
Earning &
spending are equal.
Or proceeding
exactly as per
planned budget
spending
On Schedule
7.4 Control Cost -> T&T -> EVM
By: Anand Bobade (nmbobade@gmail.com)By: Anand Bobade (nmbobade@gmail.com)
7.4 Control Cost -> T&T -> EVM
• Slowdown
with spending
to try to reach
optimal level
• Try to move
to optimal
otherwise re-
baseline.
• Continue as it
is
• Spend more
to catch up
Under Budget
but behind
schedule
Optimal –
Under Budget
& ahead of
Schedule
Over Budget
but ahead of
schedule
Worst case:
Over Budget
& behind
schedule
CPI >1
[Ahead of
Schedule]
CPI < 1
CPI >1
[Behind
Schedule]
CPI < 1
SPI < 1 [Under Budget] SPI >1
SPI < 1 [Over Budget] SPI >1
By: Anand Bobade (nmbobade@gmail.com)By: Anand Bobade (nmbobade@gmail.com)
• SV is a measure of schedule performance on a project.
Schedule
variance (SV)
• It measure of cost performance on a project.
• It indicates relationship of performance to costs spent.
Cost variance
(CV)
• SPI is a measure of progress achieved compared to progress
planned.
Schedule
performance
index (SPI)
• CPI is a measure of value of work completed compared to
actual cost.
Cost
performance
index (CPI)
7.4 Control Cost -> T&T -> EVM
By: Anand Bobade (nmbobade@gmail.com)
7.4 Control Cost -> T&T -> EVM -> Exercise
Your earned value analysis shows the following values. Which of the following is true?
- PV = 110,000,
- AC = 90,000
- EV = 90,000,
- BAC = 200,000
A) The project is ahead of schedule and on budget
B) The project is on schedule and below budget
C) The EAC is incorrect
D) The project is behind schedule and on budget
Answer : The project is behind schedule because as PV is 110,000 & EV is only 90,000. We are 20,000 behind
schedule.
We are on budget because both our Actual Cost and Earned Value are 90,000. Hence answer is D) The
project is behind schedule and on budget
By: Anand Bobade (nmbobade@gmail.com)
7.4 Control Cost -> T&T -> EVM -> Exercise
Task Duration Planned
Value
Actual Jan Feb Mar Apr May Jun
Analysis 20 1,000 1,400
Design 40 2,000 1,000
Development 60 10,000 4,000
Testing 10 2,000 -
Go-live 10 1,000 -
closure 0 - -
Below graph shows the Project schedule & current performance of the IT project managed by
Anand. What is the current SPI of the project.
A: -1
B: 0.58
C: 1.21
D: 1
100%
75%
50%
By: Anand Bobade (nmbobade@gmail.com)
7.4 Control Cost -> T&T -> EVM -> Exercise
Calculate PV of completed or in progress activities
• = Activity1(PV)+ Activity2(PV)+ Activity3(PV)
• = 1,000+2,000+10,000
• = 13,000
Calculate EV of completed or in progress activities
• = Activity1(PV * % complete)+ Activity2(PV * % complete)+ Activity3(PV * % complete)
• = (1,000* 100%) + (2,000 * 75%) + (10,000 * 50%)
• = 1,000+1,500+5,000
• = 7,500
SPI = EV / PV
• = 7,500 /13,000
• = 0.5769
• (SPI <1 means project is behind schedule)
Answer- B: 0.58
By: Anand Bobade (nmbobade@gmail.com)
Forecasting
Prediction of conditions & events in project's future based on
information & knowledge available during forecast.
7.4 Control Cost ->T&T-> Forecasting
ETC - Estimate to complete:
• Expected cost to finish all remaining
project work.
EAC - Estimate at completion:
• Expected total cost of completing all work
expressed as “sum of actual cost to date” &
“estimate to complete”.
• Forecasted estimate for total cost of the
Project.
By: Anand Bobade (nmbobade@gmail.com)
7.4 Control Cost ->T&T-> Forecasting
ETC - Estimate to
complete
EAC - Estimate at
completion
Remaining
Cost
Total Cost
at end
By: Anand Bobade (nmbobade@gmail.com)
EAC - Estimate at
completion
ETC - Estimate to
complete
The information is derived from:
Project's past performance
Information that could impact project in future
Expected future performance
7.4 Control Cost ->T&T-> Forecasting
By: Anand Bobade (nmbobade@gmail.com)
EAC - Estimate at completion
• Expected total cost of completing all work expressed
as “sum of actual cost to date” & “estimate to
complete”.
Consider forecasted EAC, If BAC is no longer viable.
EAC involves projections of project’s future based on
current performance.
Key input is work performance data.
7.4 Control Cost ->T&T-> Forecasting
By: Anand Bobade (nmbobade@gmail.com)
EAC - Estimate at completion
• Expected total cost of completing all work expressed
as “sum of actual cost to date” & “estimate to
complete”.
EAC based on Budgeted Rate:
• Absorb the Variance (originally planed budgeted
rate)
EAC based on Current Progress:
• Take the ongoing project trend (CPI & SPI or only
CPI)
EAC - Erroneous scenario:
• Re-estimate the remaining portion
• Original estimates were fundamentally flowed.
7.4 Control Cost ->T&T-> Forecasting
By: Anand Bobade (nmbobade@gmail.com)
EAC based on
Budgeted Rate:
EAC based on Current
Progress:
EAC - Erroneous
scenario:
• EAC = AC + (BAC –EV)Based on Budgeted rate
• EAC = BAC / CPI
Based on CPI.
• EAC = AC + [(BAC –EV) / (CPI ×SPI)]Based on SPI & CPI
• EAC = AC + re-estimateErroneous scenario:
7.4 Control Cost ->T&T-> Forecasting
By: Anand Bobade (nmbobade@gmail.com)
There are many ways to calculate EAC based on project progress.
Questions about the EAC will always contain some information about the
current “health” (or progression) of the project.
There are certain keywords that you can look for to pick correct formula.
7.4 Control Cost ->T&T-> Forecasting
• EAC = AC + (BAC –EV)
• Current variances are
thought to be
atypical in the
future.
• Note: atypical means
unusual or abnormal.
EAC based on Budgeted
Rate:
• EAC = BAC / CPI
• No variances from
the BAC have
occurred or are
expected to
continue at the
same rate of
spending.
•This is most often
required on the exam.
EAC based on Current
Cost Progress
• EAC = AC + [(BAC –
EV) / (CPI ×SPI)]
• Current variances
are thought to be
typical in the
future.
EAC based on Current
cost & schedule Progress
• EAC = AC+ETC
• Original estimate
was fundamentally
flawed or conditions
have changed and
invalidated original
estimating
assumptions
EAC - Erroneous
scenario:
By: Anand Bobade (nmbobade@gmail.com)By: Anand Bobade (nmbobade@gmail.com)
EAC based on Budgeted Rate:
• EAC = AC + (BAC –EV)
7.4 Control Cost ->T&T-> Forecasting
Bridge construction Project:
• Duration : 12 months
• Cost of the Project: 10,000,000
• Current status at end of month 3:
• The pillar was collapsed & hence progress was
slowed.
• Work completed: only 20% of complete project
• Actual cost: 3,000,000
BAC = 10,000,000
AC = 3,000,000
EV = 20% of 10,,000,000 = 2,000,000 (0nly 20% work done)
EAC = AC + (BAC – EV)
EAC = 3,000,000 + (10,000,000 – 2,000,000) = 11,000,000
EAC = 11 Million
Considering this as rare incident. Project will continues as
originally planned then it will need 11 Million to complete.
By: Anand Bobade (nmbobade@gmail.com)By: Anand Bobade (nmbobade@gmail.com)
EAC based on Current Progress (Based on CPI):
EAC = BAC / CPI
7.4 Control Cost ->T&T-> Forecasting
Bridge construction Project:
• Duration : 12 months
• Cost of the Project: 10,000,000
• Current status at end of month 6:
• Work completed: only 40% of complete
project
• Actual cost: 6,000,000
BAC = 10,000,000
AC = 6,000,000
EV = 40% of 10,000,000 = 4,000,000 (0nly 40% work done)
CPI = EV / AC = 4,000,000 / 6,000,000 = 0.66
EAC = BAC/CPI = 10,000,000/0.66 = 15,151,515
EAC = 15,151,515
If project continues to progress CPI 0.66 until end, you have
to spend 15.15 Million to complete project.
By: Anand Bobade (nmbobade@gmail.com)By: Anand Bobade (nmbobade@gmail.com)
EAC based on Current Progress (Based on CPI & SPI):
EAC = AC + [(BAC –EV) / (CPI ×SPI)]
7.4 Control Cost ->T&T-> Forecasting
Bridge construction Project:
Duration : 12 months
Cost of the Project: 10,000,000
Current status at end of month 6:
Work completed: only 40% of complete project
Actual cost: 6,000,000
BAC = 10,000,000 & AC = 6,000,000
PV = 50% of 10,000,000 = 5,000,000 (six months completed)
EV = 40% of 10,000,000 = 4,000,000 (0nly 40% work done)
CPI = EV / AC = 4,000,000 / 6,000,000 = 0.66
SPI = EV / PV = 4,000,000 / 5,000,000 = 0.8
EAC = 6,000,000 + [ (10,000,000 – 4,000,000)/ (0.66 * 0.8) ]
EAC = 6,000,000 + [6,000,000 / 0.528 ] = 17,363,636
If project continues with similar CPI & SPI, you have to spend 17.36
Million to complete project.
By: Anand Bobade (nmbobade@gmail.com)
Bridge construction Project:
Duration : 12 months, Cost of the Project: 10,000,000
Current status at end of month 6:
Work completed: only 55% of complete project
Actual cost: 5,000,000
EAC based on Budgeted Rate:
• EAC = AC + (BAC –EV)
• BAC = 10,000,000
• AC = 5,000,000
• EV = 55%10,000,000 = 5,500,000
• EAC = 5,000,000 + ( 10,000,000 –
5,500,000)
• EAC = 5,000,000 + 4,500,000
• EAC = 9,500,000
EAC based on Current Progress (Based
on CPI):
• EAC = BAC / CPI
• BAC = 10,000,000
• AC = 5,000,000
• EV= 55%10,000,000
• EV =5,500,000
• CPI = EV / AC
• CPI = 5,500,000 / 5,000,00= 1.1
• EAC = 10,000,000 / 1.1
• EAC = 9,090,909
EAC based on Current Progress (Based
on CPI & SPI):
• EAC = AC + [(BAC –EV) / (CPI ×SPI)]
• PV = 50% of 10,000,000 = 5,000,000
(six months completed)
• EV & CPI calculation is same.
• SPI = EV / PV
• SPI = 5,500,000 / 5,000,000 = 1.1
• EAC = 5,000,000 + [(10,000,000 –
5,500,000) / (1.1 * 1.1)]
• EAC = 5,000,000 +( 4,500,000 / 1.21)
• EAC = 5,000,000 + 3,719,008.26
• EAC = 8,719,008.26
7.4 Control Cost ->T&T-> Exercise
By: Anand Bobade (nmbobade@gmail.com)
7.4 Control Cost -> T&T -> Exercise
You presenting project status to Steering committee at the end of first Quarter in one
year project. The project is progressing as planned and you expect no major problems
in the foreseeable future.
Your PMIS is showing following data:
BAC = 500,000, SPI = 1.1, CPI = 1.05, EV = 173,000, AC = 164,761.
What you should report about EAC in the meeting?
A) 491,761
B) 454,545
C) 189,761
D) 476,190
Answer: Highlighted information indicates there were no variances after atypical situation & expect to
continue at same rate.
Hence, we will use second formula EAC= BAC/CPI =500,00/1.05 = 476,190; Hence, answer is D) 476,190
By: Anand Bobade (nmbobade@gmail.com)
7.4 Control Cost -> T&T -> Exercise
Task Duration Planned
Value
Actual Jan Feb Mar Apr May Jun
Analysis 20 1,000 1,400
Design 40 2,000 2,000
Development 60 10,000 -
Testing 10 2,000 -
Go-live 10 1,000 -
closure 0 - -
Below schedule depicts the CRM Project schedule managed by Project managed Anand. As of
today first two activities should have been 100% completed and third 50%. However PM
reported 100% completion of first two, and remaining activities are not yet started.
Assuming projects future performance will be at budgeted rate, what will be the projects EAC
(Estimate at completion)?
100%
100%
A: 3,400 B: 16,000 C: 16,400 D: 3,000
By: Anand Bobade (nmbobade@gmail.com)
Even though project is not performing as expected, we expect project to performed at
the planned rate (budgeted rate). The formula used in this scenario is EAC = AC +
(BAC – EV)
7.4 Control Cost -> T&T -> Exercise
Calculate Actual Cost (AC) of completed or in progress activities.
• = Activity1(AC)+ Activity2(AC) = 1,400+2,000 = 3,400
Calculate BAC (Total of all the activities)
• BAC = 1,000 + 2,000 + 10,000 + 2,000 + 1,000 = 16,000
Calculate EV of completed or in progress activities
• = Activity1(PV * % complete)+ Activity2(PV * % complete)
• = (1,000* 100%) + (2,000 * 100%) = 1,000+2,000 = 3,000
EAC=AC+(BAC-EV)
• =3,400 + (16,000 – 3,000) = 3,400 + 13,000 = 16,400
Answer – C: 16,400
By: Anand Bobade (nmbobade@gmail.com)By: Anand Bobade (nmbobade@gmail.com)
EAC - Estimate at completion (Re-estimate)
• EAC = AC + ETC (or Re-estimate)
7.4 Control Cost ->T&T-> Forecasting
Software Project:
•Project is to implement CRM Software for
government department for 5,000,000.
•To date project has spent 1,100,000.
•However, during execution, it was noticed
that present cost estimation were
fundamentally flawed & need to re-calculate
budget for remaining part of the project.
You discuss with your team & re-estimate the cost
of the remaining work.
Your new estimates: Design = 1,000,000,
Development=3,00,000, testing=1,500,500
Re-estimated cost = Design + Development +
testing
Re-estimated cost = 1,000,000 + 3,000,000 +
1,500,500 = 5,500,500
EAC = AC + Re-estimate
EAC = 1,100,000 + 5,500,500 = 6,500,500
By: Anand Bobade (nmbobade@gmail.com)
7.4 Control Cost -> T&T -> Exercise
Your Team Lead, who was leading the estimation team, tells you that he had missed
several key project components in estimation. So, his original cost estimations were
completely wrong. At the end of this meeting, he assured to provide new estimate in 2
days. Based on the new estimates, your PMIS shows below:
BAC: 5,000,000. AC= 1,100,000, CPI = 1.05, SPI = 1.05, EV = 1,000,000.
How much project will cost, if the new estimate to complete that you received from
your Team Lead is 5,500,500?
A) 5,500,500
B) 6,500,500
C) 6,600,500
D) 6,100,000
Answer: Highlighted information indicates there were fundamental flows in the estimates.
Hence, we will use fourth formula EAC= AC + ETC = 1,100,000 +5,500,500 = 6,600,500;
Hence, answer is C) 6,600,500
By: Anand Bobade (nmbobade@gmail.com)By: Anand Bobade (nmbobade@gmail.com)
ETC - Estimate to complete
• ETC = EAC- AC or (Re-estimate remaining work)
7.4 Control Cost ->T&T-> Forecasting
House construction Project:
• You have a construction project to be
completed in 12 months with cost of
1,000,000.
• Six months passed & project have spent
600,000.
• In meeting PM reported that only 40% of
work is completed & project is expected to
perform with same cost performance.
• Management is interested to know what is
Estimate to complete?
BAC = 1,000,000, AC = 600,000
PV= 50% of 1,000,000 = 500,000 (six months completed)
EV= 40% of 1,000,000 = 400,000 (0nly 40% work done)
CPI= EV / AC = 400,000 / 600,000 = 0.66
EAC = BAC/CPI = 1,000,000/0.66 = 1,515,151
ETC = EAC- AC
ETC = 1,515,151 – 600,000
ETC = 915, 151
By: Anand Bobade (nmbobade@gmail.com)By: Anand Bobade (nmbobade@gmail.com)
VAC (Variance at completion)
• Projection of budget difference between BAC & EAC.
7.4 Control Cost ->T&T-> Forecasting
VAC shows whether project is forecasted to finish under or over budget.
VAC = BAC – EAC
VAC % = EAC / BAC
By: Anand Bobade (nmbobade@gmail.com)
To-complete
performance index
(TCPI)
TCPI calculation
Same Budget Use BAC
Revised Budget
Use Forecasted
EAC
If BAC is no longer viable, then forecasted EAC should be approved to
use in the TCPI calculation.
TCPI is measure of Cost Performance that is required to be
achieved in order to meet a specified management goal.
Ratio of “cost to finish outstanding work”, to “remaining
budget”.
7.4 Control Cost ->T&T-> TCPI
By: Anand Bobade (nmbobade@gmail.com)
To-complete
performance index
(TCPI)
To-complete performance
index (TCPI)
Work Remaining
----------------------
Fund Remaining
Ratio of “cost to finish outstanding work” to
“remaining budget”.
7.4 Control Cost ->T&T-> TCPI
TCPI
(based on the BAC):
( BAC – EV )
----------------
( BAC – AC )
TCPI
(based on the EAC):
( BAC – EV )
----------------
( EAC – AC )
By: Anand Bobade (nmbobade@gmail.com)By: Anand Bobade (nmbobade@gmail.com)
7.4 Control Cost ->T&T-> TCPI->Same Budget
300,000
BAC:600,000
315,000
270,000
-
100,000
200,000
300,000
400,000
500,000
600,000
700,000
Month1 Month2 Month3 Month4 Month5 Month6
Planned Budget (PV) Actual Cost (AC) Earned Value (EV)
Fund Remaining
= BAC-AC
= 600,000-315,000
= 285,000
Work Remaining
= BAC-EV
= 600,000-270,000
= 330,000
Case1: Same
Budget
Project with current status BAC=600,000 PV=300,000 AC=315,000 EV=270,000
By: Anand Bobade (nmbobade@gmail.com)By: Anand Bobade (nmbobade@gmail.com)
TCPI (based on BAC)
Work Remaining = BAC-EV = 600,000-270,000 =
330,000
Fund Remaining = BAC-AC = 600,000-315,000 =
285,000
TCPI = Work Remaining / Fund Remaining
= 330,000 / 285,000
= 1.15
You have to get output of 1.15 AED of every 1
AED spent.
7.4 Control Cost ->T&T-> TCPI
By: Anand Bobade (nmbobade@gmail.com)By: Anand Bobade (nmbobade@gmail.com)
7.4 Control Cost ->T&T-> TCPI->Same Budget
300,000
BAC:600,000
315,000
270,000
-
100,000
200,000
300,000
400,000
500,000
600,000
700,000
Month1 Month2 Month3 Month4 Month5 Month6
Planned Budget (PV) Actual Cost (AC) Earned Value (EV)
Fund Remaining
= EAC-AC
= 650,000-315,000
= 335,000
Work Remaining
= BAC-EV
= 600,000-270,000
= 330,000
Case1:
Revised
Budget
Project with current status BAC=600,000 PV=300,000 AC=315,000 EV=270,000
EAC = 650,000
By: Anand Bobade (nmbobade@gmail.com)By: Anand Bobade (nmbobade@gmail.com)
TCPI (based on BAC)
Work Remaining = BAC-EV = 600,000-270,000
= 330,000
Fund Remaining = BAC-AC = 600,000-315,000
= 285,000
TCPI = Work Remaining / Fund Remaining
= 330,000 / 285,000
= 1.15
You have to get output of 1.15 AED of every 1
AED spent.
TCPI (Based on EAC)
Work Remaining = BAC-EV = 600,000-270,000
= 330,000
Fund Remaining = EAC-AC = 650,000-315,000
= 335,000
TCPI = Work Remaining / Fund Remaining
= 330,000/335,000
=0.98
You have to get output of 0.98 AED of every 1
AED spent.
7.4 Control Cost ->T&T-> TCPI
By: Anand Bobade (nmbobade@gmail.com)
• Project is in a comfortable position.If TCPI < 1
• Project have to perform with better cost performance than past.If TCPI > 1
• Project can continue with same cost performance.if TCPI = 1
7.4 Control Cost ->T&T-> TCPI
By: Anand Bobade (nmbobade@gmail.com)
Performance
reviews
A technique used to measure, compare, & analyse
actual performance of work in progress against
baseline.
Variance Analysis:
• A technique for determining cause & degree of
difference between baseline & actual performance.
Trend Analysis
• An analytical technique that uses mathematical
models to forecast future outcomes based on
historical results.
Earned value management:
• A methodology that combines scope, schedule, and
resource measurements to assess project
performance and progress.
7.4 Control Cost ->T&T->Performance review
By: Anand Bobade (nmbobade@gmail.com)
Performance
reviews
Compare cost performance of activities overrunning &
under running budget.
Determining cause & degree of variance relative to cost
baseline.
Variance Analysis:
• Determining cause & degree of difference
between baseline & actual performance.
7.4 Control Cost ->T&T->Performance review
• CV = EV –ACCost Variance
• SV = EV –PVSchedule Variance
• VAC = BAC –EAC
Variance at
completion
By: Anand Bobade (nmbobade@gmail.com)
Performance
reviews
Uses past performance (historical results) with
variance over time
Compare future performance goals in the form of
BAC versus EAC and completion dates.
Examines performance over time is improving or
deteriorating.
Trend Analysis
• Uses mathematical models to forecast
future outcomes based on historical data.
7.4 Control Cost ->T&T->Performance review
By: Anand Bobade (nmbobade@gmail.com)
Performance
reviews
Compares the performance measurement baseline to actual
schedule and cost performance.
If not being used, then the analysis of the cost baseline
against actual costs for the work performed is used .
Earned value management:
• It combines scope, schedule & resource to
assess project performance & progress.
7.4 Control Cost ->T&T->Performance review
By: Anand Bobade (nmbobade@gmail.com)
Project
management
software
Calculate earn value
Display graphical trends & calculate SPI & CPI
Show variances
Forecast a range of possible final project results
7.4 Control Cost ->Tools & Techniques->PM software
By: Anand Bobade (nmbobade@gmail.com)
Reserve analysis
Monitor status of contingency & management reserves.
Determine, if these reserves are still needed or not.
If not then free up the reserves.
Determine, if additional reserves need to be requested.
7.4 Control Cost->Tools & Techniques->Reserve Analysis
By: Anand Bobade (nmbobade@gmail.com)
Work Performance
Information
Cost Forecasts Change Requests
PMP Updates Project
Documents
Updates
OPA updates
7.4 Control Cost -> Outputs
By: Anand Bobade (nmbobade@gmail.com)
Work Performance
Information
From results of Earn value calculation
Variances (CV, SV & VAC)
Performance indicators (SPI, CPI)
All information to be documented & communicated
to stakeholders.
The performance data collected from various
controlling processes, analysed in context &
integrated based on relationships across areas.
7.4 Control Cost->Outputs->Work Performance Information
By: Anand Bobade (nmbobade@gmail.com)
Cost Forecasts
Calculated EAC value & ETC value is documented and
communicated to stakeholders
7.4 Control Cost->Outputs->Cost Forecasts
EAC - Estimate at
completion
ETC - Estimate to
complete
Total Cost
at end
Remaining
Cost
By: Anand Bobade (nmbobade@gmail.com)
7.4 Control Cost->Outputs->Change Requests
• To improve future performancePreventive CR:
• Re-alignment of performanceCorrective CR:
Change Requests
A formal proposal to modify any document,
deliverable, or baseline.
Analysis of project performance may result in a CR
to cost baseline or other components of PMP.
Cost b baseline changes are mainly due to:
Behind
schedule or
Over budget
Activity
Resource
change
Change in
Cost
estimate
Risk
realization or
new risks
By: Anand Bobade (nmbobade@gmail.com)By: Anand Bobade (nmbobade@gmail.com)
Cost baseline. :in response to approved changes in
scope, activity resources, or cost estimates. Cost
management plan. changes to control thresholds or
specified levels of accuracy required
Cost estimates, and Basis of estimates.
Causes of variances, Corrective action chosen and the
reasons, Financial databases, and Other types of
lessons learned from project cost control.
7.4 Control Cost -> Outputs
By: Anand Bobade (nmbobade@gmail.com)By: Anand Bobade (nmbobade@gmail.com)
7. Project Cost Management -> Additional Concepts
Money – value depends on time
• Receiving AED 100 today has different meaning than receiving
it after 1 year.
Money
Value as of Today (PV) Future value (FV)
By: Anand Bobade (nmbobade@gmail.com)By: Anand Bobade (nmbobade@gmail.com)
7. Project Cost Management -> Additional Concepts
Money – value depends on time
• Receiving AED 100 today has different meaning than receiving
it after 1 year.
Money
Value as of Today (PV) Future value (FV)
By: Anand Bobade (nmbobade@gmail.com)
7. Project Cost Management -> Additional Concepts
• Present Value (PV) =
1,000
• Years : 2 years
• Interest: 5% (0.05)
• Future Value (FV) = ??
The future value ( FV )
• It refers to a method of calculating how much present value (PV)
of an asset or cash will be worth at a specific time in the future
FV = PV (1 + R)^N
• FV: Future value
• PV: Present value
• N: time of years
• R: Interest rate
Above example, FV=??
• = 1,000 (1 + 0.05)^2 )
• = 1,000 * (1.05^2)
• = 1,000 * 1.1025
• = 1,102.5
By: Anand Bobade (nmbobade@gmail.com)
7. Project Cost Management -> Additional Concepts
Present Value:
• The value of an expected income(as of date of valuation)
• PV <= FV because money has interest-earning potential
• To calculate PV, discount FV by interest rate
•Present Value (PV) = ?? •Years : 2 years
•Interest: 5% (0.05)
•Future Value (FV) = 1,000
PV = FV/ (1 + R)^N
• PV: Present value
• FV: Future value
• N: time of years
• R: Interest rate
Above example, what is PV??
• PV = 1,000 / (1 + 0.05)^2 )
• PV = 1,000 / (1.05^2)
• PV = 1,000 / 1.1025
• PV = 907
By: Anand Bobade (nmbobade@gmail.com)
7. Project Cost Management -> Additional Concepts
Net present value (NPV):
• The total present value (PV) of a time series of cash flows.
• It allows calculating the accurate value of the project.
• If NPV > 0; then accept the project otherwise reject it.
Initial investment
( Express as negative number) All Present values (PV’s)
Example: If project costs 100,000 & generates income as below with discounted rate of 10%
Year 1 = 50,000 ; Year 1 = 37,000 ; Year 1 = 43,000
PV1 = 50,000 / (1 + 0.1) ^1 = 45455.54
PV2 = 37,000 / (1 + 0.1) ^2 = 30578.50
PV3 = 43,000 / (1 + 0.1) ^3 = 32306.53
NPV = (-100,000) + 45455.54
+ 30578.50 + 32306.53
= 8,339.57
By: Anand Bobade (nmbobade@gmail.com)
7. Project Cost Management -> Questions
The project selection board was presented with following project opportunities:
Project A has a duration of 5 years and an NPV of 90,000,
Project B has a duration of 4 years and an NPV of 80,000,
Project C has a duration of 3 years and an NPV of 70,000
Project D has a duration of 2 years and an NPV of 60,000.
Which project will be selected by board based on above information?
A) Project A
B) Project B
C) Project C
D) Project D
Answer : When calculating the NPV of a project, the duration (no. of years) is already factored in the result.
So, you can simply select the one with the highest NPV. Hence, answer is A) Project A
By: Anand Bobade (nmbobade@gmail.com)By: Anand Bobade (nmbobade@gmail.com)
7.4 Control Cost -> T&T -> Examples & Scenarios
Scenarios
By: Anand Bobade (nmbobade@gmail.com)By: Anand Bobade (nmbobade@gmail.com)
7.4 Control Cost ->T&T-> Examples
• = 2,000PV
• = 2,000EV
• = 2,000AC
This is the ideal situation,
where everything goes
according to plan
• = 2,000PV
• = 1,500EV
• = 1,700AC
• = EV – AC = - 200Cost Variance
Without Earned Value
measurements, it appears
project is in good shape.
Expenditures are less than
planned.
Case 1
Case 2
Observation1
By: Anand Bobade (nmbobade@gmail.com)By: Anand Bobade (nmbobade@gmail.com)
7.4 Control Cost ->T&T-> Examples
• = 2,000PV
• = 1,500EV
• = 1,700AC
With EV measurements, we
see 500 worth of work is
behind schedule;
i.e., We are 25% behind our
planed work
Case 2
Observation 2
• = EV – PV = - 500SV
• = (SV / PV) x 100 = -25%SV %
By: Anand Bobade (nmbobade@gmail.com)By: Anand Bobade (nmbobade@gmail.com)
7.4 Control Cost ->T&T-> Examples
• = 2,000PV
• = 1,500EV
• = 1,700AC
We can see “Actuals” exceed “Earned
Value” (EV)
i.e., 1,500 worth of work was
accomplished but money spent was
1,700.
We have a 200 cost overrun (13.3% over
budget)
Case 2
Observation 3
• = EV – AC = - 200CV
• = (CV / EV) x 100 = -13.3%CV %
By: Anand Bobade (nmbobade@gmail.com)By: Anand Bobade (nmbobade@gmail.com)
7.4 Control Cost ->T&T-> Examples
• = 2,000PV
• = 1,500EV
• = 1,700AC
This means only 75 cents of work
was done for each
$1 worth of work planned.
Only 88 cents worth of work was
actually done for each $1 spent
All performance indicators are
Negative
Case 2
Observation 4
• = EV/PV = 0.75SPI
• = EV/AC = 0.88CPI
• = EV-PV = -500SV
• = EV-AC = -200CV
By: Anand Bobade (nmbobade@gmail.com)By: Anand Bobade (nmbobade@gmail.com)
7.4 Control Cost ->T&T-> Examples
• = 2,500PV
• = 2,300EV
• = 2,100AC
Case 3
Bad News:
Project work efficiency is a bit low,
we are getting only 92 cents of work
done on $1 spent.
As a result, we are behind schedule.
• = EV-PV = -200SV
• = SV / PV x 100 = -8%SV%
• = EV/PV = 0.92SPI
• = EV-AC = 200CV
• = CV/PV X 100 = 8%CV%
• = EV/AC = 1.095CPI
Good news:
Project is running under budget.
We’re getting $1.095 worth of work
done for each $1 spent.
By: Anand Bobade (nmbobade@gmail.com)By: Anand Bobade (nmbobade@gmail.com)
7.4 Control Cost ->T&T-> Examples
• = 2,000PV
• = 1,800EV
• = 1,800AC
Case 4
Bad News:
Project work is not accomplished on
Schedule
• = EV-PV = -200SV
• = SV / PV x 100 = -10%SV%
• = EV/PV = 0.9SPI
• = EV-AC = 0CV
• = CV/PV X 100 = 0%CV%
• = EV/AC = 1CPI
Good news:
Project is running as per our budget.
The cost of the work accomplished is
as we budgeted.
By: Anand Bobade (nmbobade@gmail.com)By: Anand Bobade (nmbobade@gmail.com)
7.4 Control Cost ->T&T-> Examples
• = 2,000PV
• = 2,200EV
• = 2,000AC
SPI & CPI =1.1
Project work is getting done at 1.1%
efficiency
Case 5
• = EV-AC = 200CV
• = CV/PV X 100 = 10%CV%
• = EV/AC = 1.1CPI
• = EV-PV = 200SV
• = SV / PV x 100 = 10%SV%
• = EV/PV = 1.1SPI
Ahead or Schedule & under-running
cost:
Work is ahead of schedule by 10% &
under-running cost by 10%.
Management View:
Too much
Pessimistic planning
By: Anand Bobade (nmbobade@gmail.com)By: Anand Bobade (nmbobade@gmail.com)
7.4 Control Cost -> Data Flow Diagram
By: Anand Bobade (nmbobade@gmail.com)By: Anand Bobade (nmbobade@gmail.com)
To Learn Project Management, Contact Anand Bobade (055 5932004)
•nmbobade@gmail.com
•https://ae.linkedin.com/in/anandbobade
•http://www.slideshare.net/anandbobade
•Conduct Online training, Corporate Training, evening & weekend workshops.
By: Anand Bobade (nmbobade@gmail.com)
Thank You!
To Learn Project Management, Contact Anand Bobade (055 5932004)
•nmbobade@gmail.com
•https://ae.linkedin.com/in/anandbobade
•http://www.slideshare.net/anandbobade
•Conduct Online training, Corporate Training, evening & weekend workshops.
Free learning resources
on slide share

Contenu connexe

Tendances

PMP Chap 2- Org. Influence and Project Life Cycle
PMP Chap 2- Org. Influence and Project Life CyclePMP Chap 2- Org. Influence and Project Life Cycle
PMP Chap 2- Org. Influence and Project Life CycleAnand Bobade
 
Chap 7.2 Estimate Cost
Chap 7.2 Estimate CostChap 7.2 Estimate Cost
Chap 7.2 Estimate CostAnand Bobade
 
Chap 10.2 Manage Communication
Chap 10.2  Manage CommunicationChap 10.2  Manage Communication
Chap 10.2 Manage CommunicationAnand Bobade
 
Pmp chap 11 - project risk management v0.1
Pmp   chap 11 - project risk management v0.1Pmp   chap 11 - project risk management v0.1
Pmp chap 11 - project risk management v0.1Anand Bobade
 
PMP Chap 4 - Project Integration Management - Part1
PMP Chap 4 - Project Integration Management - Part1PMP Chap 4 - Project Integration Management - Part1
PMP Chap 4 - Project Integration Management - Part1Anand Bobade
 
Pmp chap 11 - project risk management - Part 2
Pmp   chap 11 - project risk management - Part 2Pmp   chap 11 - project risk management - Part 2
Pmp chap 11 - project risk management - Part 2Anand Bobade
 
PMP Chap4-Project Integration Management Details: Part-2
PMP Chap4-Project Integration Management Details: Part-2PMP Chap4-Project Integration Management Details: Part-2
PMP Chap4-Project Integration Management Details: Part-2Anand Bobade
 
Chap 10.1 Plan Communication Management
Chap 10.1  Plan Communication ManagementChap 10.1  Plan Communication Management
Chap 10.1 Plan Communication ManagementAnand Bobade
 
PMP Chap 6 - Project Time management - Part1
PMP Chap 6 - Project Time management - Part1PMP Chap 6 - Project Time management - Part1
PMP Chap 6 - Project Time management - Part1Anand Bobade
 
PMP Chap 10 - Project Communication Management Details
PMP  Chap 10 - Project Communication Management DetailsPMP  Chap 10 - Project Communication Management Details
PMP Chap 10 - Project Communication Management DetailsAnand Bobade
 
Chap 11.2 Identify Risks
Chap 11.2 Identify RisksChap 11.2 Identify Risks
Chap 11.2 Identify RisksAnand Bobade
 
Chap 6.0 Schedule Management Overview
Chap 6.0 Schedule Management OverviewChap 6.0 Schedule Management Overview
Chap 6.0 Schedule Management OverviewAnand Bobade
 
PMP Chap 8 - Project Quality Management
PMP Chap 8 - Project Quality ManagementPMP Chap 8 - Project Quality Management
PMP Chap 8 - Project Quality ManagementAnand Bobade
 
PMP Chap 6 - Project Time management - Part2
PMP Chap 6 - Project Time management - Part2PMP Chap 6 - Project Time management - Part2
PMP Chap 6 - Project Time management - Part2Anand Bobade
 
PMP Chap 5 - Project Scope Management - Part 2
PMP Chap 5 - Project Scope Management - Part 2PMP Chap 5 - Project Scope Management - Part 2
PMP Chap 5 - Project Scope Management - Part 2Anand Bobade
 
Chap 9.6 Control Resources
Chap 9.6  Control ResourcesChap 9.6  Control Resources
Chap 9.6 Control ResourcesAnand Bobade
 
Project Schedule Management - PMBOK6
Project Schedule Management - PMBOK6Project Schedule Management - PMBOK6
Project Schedule Management - PMBOK6Agus Suhanto
 
Chap 9.4 Develop Team
Chap 9.4  Develop TeamChap 9.4  Develop Team
Chap 9.4 Develop TeamAnand Bobade
 
Chap 9.5 Manage Team
Chap 9.5  Manage TeamChap 9.5  Manage Team
Chap 9.5 Manage TeamAnand Bobade
 

Tendances (20)

PMP Chap 2- Org. Influence and Project Life Cycle
PMP Chap 2- Org. Influence and Project Life CyclePMP Chap 2- Org. Influence and Project Life Cycle
PMP Chap 2- Org. Influence and Project Life Cycle
 
Chap 7.2 Estimate Cost
Chap 7.2 Estimate CostChap 7.2 Estimate Cost
Chap 7.2 Estimate Cost
 
Chap 10.2 Manage Communication
Chap 10.2  Manage CommunicationChap 10.2  Manage Communication
Chap 10.2 Manage Communication
 
Pmp chap 11 - project risk management v0.1
Pmp   chap 11 - project risk management v0.1Pmp   chap 11 - project risk management v0.1
Pmp chap 11 - project risk management v0.1
 
PMP Chap 4 - Project Integration Management - Part1
PMP Chap 4 - Project Integration Management - Part1PMP Chap 4 - Project Integration Management - Part1
PMP Chap 4 - Project Integration Management - Part1
 
Pmp chap 11 - project risk management - Part 2
Pmp   chap 11 - project risk management - Part 2Pmp   chap 11 - project risk management - Part 2
Pmp chap 11 - project risk management - Part 2
 
PMP Chap4-Project Integration Management Details: Part-2
PMP Chap4-Project Integration Management Details: Part-2PMP Chap4-Project Integration Management Details: Part-2
PMP Chap4-Project Integration Management Details: Part-2
 
Chap 10.1 Plan Communication Management
Chap 10.1  Plan Communication ManagementChap 10.1  Plan Communication Management
Chap 10.1 Plan Communication Management
 
PMP Chap 6 - Project Time management - Part1
PMP Chap 6 - Project Time management - Part1PMP Chap 6 - Project Time management - Part1
PMP Chap 6 - Project Time management - Part1
 
PMP Chap 10 - Project Communication Management Details
PMP  Chap 10 - Project Communication Management DetailsPMP  Chap 10 - Project Communication Management Details
PMP Chap 10 - Project Communication Management Details
 
Chap 11.2 Identify Risks
Chap 11.2 Identify RisksChap 11.2 Identify Risks
Chap 11.2 Identify Risks
 
Chap 6.0 Schedule Management Overview
Chap 6.0 Schedule Management OverviewChap 6.0 Schedule Management Overview
Chap 6.0 Schedule Management Overview
 
PMP Chap 8 - Project Quality Management
PMP Chap 8 - Project Quality ManagementPMP Chap 8 - Project Quality Management
PMP Chap 8 - Project Quality Management
 
PMP Chap 6 - Project Time management - Part2
PMP Chap 6 - Project Time management - Part2PMP Chap 6 - Project Time management - Part2
PMP Chap 6 - Project Time management - Part2
 
PMP Chap 5 - Project Scope Management - Part 2
PMP Chap 5 - Project Scope Management - Part 2PMP Chap 5 - Project Scope Management - Part 2
PMP Chap 5 - Project Scope Management - Part 2
 
07 project cost management
07 project cost management07 project cost management
07 project cost management
 
Chap 9.6 Control Resources
Chap 9.6  Control ResourcesChap 9.6  Control Resources
Chap 9.6 Control Resources
 
Project Schedule Management - PMBOK6
Project Schedule Management - PMBOK6Project Schedule Management - PMBOK6
Project Schedule Management - PMBOK6
 
Chap 9.4 Develop Team
Chap 9.4  Develop TeamChap 9.4  Develop Team
Chap 9.4 Develop Team
 
Chap 9.5 Manage Team
Chap 9.5  Manage TeamChap 9.5  Manage Team
Chap 9.5 Manage Team
 

En vedette (20)

8.project cost management
8.project cost management8.project cost management
8.project cost management
 
PMBOK 5th Edition - Chapter 6 PROJECT TIME MANAGEMENT Summary
PMBOK 5th Edition - Chapter 6 PROJECT TIME MANAGEMENT SummaryPMBOK 5th Edition - Chapter 6 PROJECT TIME MANAGEMENT Summary
PMBOK 5th Edition - Chapter 6 PROJECT TIME MANAGEMENT Summary
 
Types of Cost in Projects
Types of Cost in ProjectsTypes of Cost in Projects
Types of Cost in Projects
 
Types of cost ppt @ mba 2009
Types of cost ppt @ mba 2009Types of cost ppt @ mba 2009
Types of cost ppt @ mba 2009
 
Project Cost Management
Project Cost ManagementProject Cost Management
Project Cost Management
 
Soumya Resume
Soumya ResumeSoumya Resume
Soumya Resume
 
Vb.net ide
Vb.net ideVb.net ide
Vb.net ide
 
Wipro resume
Wipro resumeWipro resume
Wipro resume
 
JnanaPrakash
JnanaPrakashJnanaPrakash
JnanaPrakash
 
Sabyasachi MBA CV
Sabyasachi MBA CVSabyasachi MBA CV
Sabyasachi MBA CV
 
Apoorve - Resume
Apoorve - ResumeApoorve - Resume
Apoorve - Resume
 
anusha resume
anusha resumeanusha resume
anusha resume
 
kamalCv 2016
kamalCv 2016kamalCv 2016
kamalCv 2016
 
Anjan CV
Anjan CVAnjan CV
Anjan CV
 
Amit Kumar Architect with Web and Angular JS
Amit Kumar Architect with Web and Angular JSAmit Kumar Architect with Web and Angular JS
Amit Kumar Architect with Web and Angular JS
 
Curriculum_Vitae
Curriculum_VitaeCurriculum_Vitae
Curriculum_Vitae
 
Resume
ResumeResume
Resume
 
Pallavi-resume-UPDATED-2
Pallavi-resume-UPDATED-2Pallavi-resume-UPDATED-2
Pallavi-resume-UPDATED-2
 
Rizwana-Shaikh_Angular JS Profile
Rizwana-Shaikh_Angular JS ProfileRizwana-Shaikh_Angular JS Profile
Rizwana-Shaikh_Angular JS Profile
 
Shilpa Resume
Shilpa ResumeShilpa Resume
Shilpa Resume
 

Similaire à PMP Chap 7 - Project Cost Management - Part 2

Module 4 - IDP.pptx
Module 4 - IDP.pptxModule 4 - IDP.pptx
Module 4 - IDP.pptxRAJESH S
 
PMP Key Exam Concepts WPD, WPI & WPR
PMP Key Exam Concepts WPD, WPI & WPRPMP Key Exam Concepts WPD, WPI & WPR
PMP Key Exam Concepts WPD, WPI & WPRAnand Bobade
 
7.project costmanagement
7.project costmanagement7.project costmanagement
7.project costmanagementNiranjana K.R.
 
Chap 5.3 define scope
Chap 5.3 define scopeChap 5.3 define scope
Chap 5.3 define scopeAnand Bobade
 
PMP Chap 3 - Project Management Processes
PMP Chap 3 - Project Management ProcessesPMP Chap 3 - Project Management Processes
PMP Chap 3 - Project Management ProcessesAnand Bobade
 
PMP Key Exam Concepts - Formulas
PMP Key Exam Concepts - FormulasPMP Key Exam Concepts - Formulas
PMP Key Exam Concepts - FormulasAnand Bobade
 
Gonzales.matthew
Gonzales.matthewGonzales.matthew
Gonzales.matthewNASAPMC
 
L06 cost management
L06 cost managementL06 cost management
L06 cost managementAsa Chan
 
2.07 cost management 1
2.07 cost management 12.07 cost management 1
2.07 cost management 1reddvise
 
Lecture 06 project_cost_management
Lecture 06 project_cost_managementLecture 06 project_cost_management
Lecture 06 project_cost_managementSayed Ahmed
 
Rethink cost estimation with core processes that drive 5D BIM
Rethink cost estimation with core processes that drive 5D  BIM Rethink cost estimation with core processes that drive 5D  BIM
Rethink cost estimation with core processes that drive 5D BIM BIMEngus1
 

Similaire à PMP Chap 7 - Project Cost Management - Part 2 (20)

Chapter 07
Chapter 07Chapter 07
Chapter 07
 
Module 4 - IDP.pptx
Module 4 - IDP.pptxModule 4 - IDP.pptx
Module 4 - IDP.pptx
 
PMP Key Exam Concepts WPD, WPI & WPR
PMP Key Exam Concepts WPD, WPI & WPRPMP Key Exam Concepts WPD, WPI & WPR
PMP Key Exam Concepts WPD, WPI & WPR
 
7.project costmanagement
7.project costmanagement7.project costmanagement
7.project costmanagement
 
Chap 5.3 define scope
Chap 5.3 define scopeChap 5.3 define scope
Chap 5.3 define scope
 
Project Cost Management for IEM talk on 13 January 2018.
Project Cost Management  for IEM talk on 13 January 2018.Project Cost Management  for IEM talk on 13 January 2018.
Project Cost Management for IEM talk on 13 January 2018.
 
PMP Chap 3 - Project Management Processes
PMP Chap 3 - Project Management ProcessesPMP Chap 3 - Project Management Processes
PMP Chap 3 - Project Management Processes
 
PMP Key Exam Concepts - Formulas
PMP Key Exam Concepts - FormulasPMP Key Exam Concepts - Formulas
PMP Key Exam Concepts - Formulas
 
EstimatesPresentation.pptx
EstimatesPresentation.pptxEstimatesPresentation.pptx
EstimatesPresentation.pptx
 
Gonzales.matthew
Gonzales.matthewGonzales.matthew
Gonzales.matthew
 
7.3 Determine Budget
7.3 Determine Budget7.3 Determine Budget
7.3 Determine Budget
 
7.2 Estimate Cost
7.2 Estimate Cost7.2 Estimate Cost
7.2 Estimate Cost
 
Project cost management
Project cost managementProject cost management
Project cost management
 
Session 9 4th edition PMP
Session 9 4th edition PMPSession 9 4th edition PMP
Session 9 4th edition PMP
 
L06 cost management
L06 cost managementL06 cost management
L06 cost management
 
2.07 cost management 1
2.07 cost management 12.07 cost management 1
2.07 cost management 1
 
Lecture 06 project_cost_management
Lecture 06 project_cost_managementLecture 06 project_cost_management
Lecture 06 project_cost_management
 
ACH 216 Lecture 07 (Project Funding)
ACH 216 Lecture 07 (Project Funding)ACH 216 Lecture 07 (Project Funding)
ACH 216 Lecture 07 (Project Funding)
 
Rethink cost estimation with core processes that drive 5D BIM
Rethink cost estimation with core processes that drive 5D  BIM Rethink cost estimation with core processes that drive 5D  BIM
Rethink cost estimation with core processes that drive 5D BIM
 
PMP-Cost Management area
PMP-Cost Management areaPMP-Cost Management area
PMP-Cost Management area
 

Plus de Anand Bobade

PMP - Download 49 Processes Chart | PMBOK6 | Links to all Slides | Link to Yo...
PMP - Download 49 Processes Chart | PMBOK6 | Links to all Slides | Link to Yo...PMP - Download 49 Processes Chart | PMBOK6 | Links to all Slides | Link to Yo...
PMP - Download 49 Processes Chart | PMBOK6 | Links to all Slides | Link to Yo...Anand Bobade
 
Chap 12.3 Control Procurement
Chap 12.3 Control ProcurementChap 12.3 Control Procurement
Chap 12.3 Control ProcurementAnand Bobade
 
Chap 12.2 Conduct Procurement
Chap 12.2 Conduct ProcurementChap 12.2 Conduct Procurement
Chap 12.2 Conduct ProcurementAnand Bobade
 
Chap 12.1 Plan Procurement Management
Chap 12.1 Plan Procurement ManagementChap 12.1 Plan Procurement Management
Chap 12.1 Plan Procurement ManagementAnand Bobade
 
Chap 12.0 Procurement Management overview
Chap 12.0   Procurement Management overviewChap 12.0   Procurement Management overview
Chap 12.0 Procurement Management overviewAnand Bobade
 
Chap 11.7 Monitor Risks
Chap 11.7 Monitor RisksChap 11.7 Monitor Risks
Chap 11.7 Monitor RisksAnand Bobade
 
Chap 10.3 Monitor Communication
Chap 10.3 Monitor CommunicationChap 10.3 Monitor Communication
Chap 10.3 Monitor CommunicationAnand Bobade
 
Chap 9.3 Acquire Resources
Chap 9.3   Acquire ResourcesChap 9.3   Acquire Resources
Chap 9.3 Acquire ResourcesAnand Bobade
 
Chap 9.2 Estimate Activity Resource
Chap 9.2   Estimate Activity ResourceChap 9.2   Estimate Activity Resource
Chap 9.2 Estimate Activity ResourceAnand Bobade
 
Chap 9.0 Project Resource Management overview
Chap 9.0   Project Resource Management overviewChap 9.0   Project Resource Management overview
Chap 9.0 Project Resource Management overviewAnand Bobade
 
Chap 6.6 Control Schedule
Chap 6.6 Control ScheduleChap 6.6 Control Schedule
Chap 6.6 Control ScheduleAnand Bobade
 
Chap 6.5 Define Schedule
Chap 6.5 Define ScheduleChap 6.5 Define Schedule
Chap 6.5 Define ScheduleAnand Bobade
 
Chap 6.4 Estimate Activity Duration
Chap 6.4 Estimate Activity DurationChap 6.4 Estimate Activity Duration
Chap 6.4 Estimate Activity DurationAnand Bobade
 
Chap 6.3 Sequence Activity
Chap 6.3 Sequence ActivityChap 6.3 Sequence Activity
Chap 6.3 Sequence ActivityAnand Bobade
 
Chap 6.2 Define Activity
Chap 6.2 Define ActivityChap 6.2 Define Activity
Chap 6.2 Define ActivityAnand Bobade
 
Chap 6.1 Plan Schedule Management
Chap 6.1 Plan Schedule ManagementChap 6.1 Plan Schedule Management
Chap 6.1 Plan Schedule ManagementAnand Bobade
 
Chap 5.6 Control Scope
Chap 5.6 Control ScopeChap 5.6 Control Scope
Chap 5.6 Control ScopeAnand Bobade
 

Plus de Anand Bobade (17)

PMP - Download 49 Processes Chart | PMBOK6 | Links to all Slides | Link to Yo...
PMP - Download 49 Processes Chart | PMBOK6 | Links to all Slides | Link to Yo...PMP - Download 49 Processes Chart | PMBOK6 | Links to all Slides | Link to Yo...
PMP - Download 49 Processes Chart | PMBOK6 | Links to all Slides | Link to Yo...
 
Chap 12.3 Control Procurement
Chap 12.3 Control ProcurementChap 12.3 Control Procurement
Chap 12.3 Control Procurement
 
Chap 12.2 Conduct Procurement
Chap 12.2 Conduct ProcurementChap 12.2 Conduct Procurement
Chap 12.2 Conduct Procurement
 
Chap 12.1 Plan Procurement Management
Chap 12.1 Plan Procurement ManagementChap 12.1 Plan Procurement Management
Chap 12.1 Plan Procurement Management
 
Chap 12.0 Procurement Management overview
Chap 12.0   Procurement Management overviewChap 12.0   Procurement Management overview
Chap 12.0 Procurement Management overview
 
Chap 11.7 Monitor Risks
Chap 11.7 Monitor RisksChap 11.7 Monitor Risks
Chap 11.7 Monitor Risks
 
Chap 10.3 Monitor Communication
Chap 10.3 Monitor CommunicationChap 10.3 Monitor Communication
Chap 10.3 Monitor Communication
 
Chap 9.3 Acquire Resources
Chap 9.3   Acquire ResourcesChap 9.3   Acquire Resources
Chap 9.3 Acquire Resources
 
Chap 9.2 Estimate Activity Resource
Chap 9.2   Estimate Activity ResourceChap 9.2   Estimate Activity Resource
Chap 9.2 Estimate Activity Resource
 
Chap 9.0 Project Resource Management overview
Chap 9.0   Project Resource Management overviewChap 9.0   Project Resource Management overview
Chap 9.0 Project Resource Management overview
 
Chap 6.6 Control Schedule
Chap 6.6 Control ScheduleChap 6.6 Control Schedule
Chap 6.6 Control Schedule
 
Chap 6.5 Define Schedule
Chap 6.5 Define ScheduleChap 6.5 Define Schedule
Chap 6.5 Define Schedule
 
Chap 6.4 Estimate Activity Duration
Chap 6.4 Estimate Activity DurationChap 6.4 Estimate Activity Duration
Chap 6.4 Estimate Activity Duration
 
Chap 6.3 Sequence Activity
Chap 6.3 Sequence ActivityChap 6.3 Sequence Activity
Chap 6.3 Sequence Activity
 
Chap 6.2 Define Activity
Chap 6.2 Define ActivityChap 6.2 Define Activity
Chap 6.2 Define Activity
 
Chap 6.1 Plan Schedule Management
Chap 6.1 Plan Schedule ManagementChap 6.1 Plan Schedule Management
Chap 6.1 Plan Schedule Management
 
Chap 5.6 Control Scope
Chap 5.6 Control ScopeChap 5.6 Control Scope
Chap 5.6 Control Scope
 

Dernier

How Software Developers Destroy Business Value.pptx
How Software Developers Destroy Business Value.pptxHow Software Developers Destroy Business Value.pptx
How Software Developers Destroy Business Value.pptxAaron Stannard
 
Beyond the Codes_Repositioning towards sustainable development
Beyond the Codes_Repositioning towards sustainable developmentBeyond the Codes_Repositioning towards sustainable development
Beyond the Codes_Repositioning towards sustainable developmentNimot Muili
 
Agile Coaching Change Management Framework.pptx
Agile Coaching Change Management Framework.pptxAgile Coaching Change Management Framework.pptx
Agile Coaching Change Management Framework.pptxalinstan901
 
Independent Escorts Vikaspuri / 9899900591 High Profile Escort Service in Delhi
Independent Escorts Vikaspuri  / 9899900591 High Profile Escort Service in DelhiIndependent Escorts Vikaspuri  / 9899900591 High Profile Escort Service in Delhi
Independent Escorts Vikaspuri / 9899900591 High Profile Escort Service in Delhiguptaswati8536
 
Reviewing and summarization of university ranking system to.pptx
Reviewing and summarization of university ranking system  to.pptxReviewing and summarization of university ranking system  to.pptx
Reviewing and summarization of university ranking system to.pptxAss.Prof. Dr. Mogeeb Mosleh
 
Marketing Management 16th edition by Philip Kotler test bank.docx
Marketing Management 16th edition by Philip Kotler test bank.docxMarketing Management 16th edition by Philip Kotler test bank.docx
Marketing Management 16th edition by Philip Kotler test bank.docxssuserf63bd7
 
Safety T fire missions army field Artillery
Safety T fire missions army field ArtillerySafety T fire missions army field Artillery
Safety T fire missions army field ArtilleryKennethSwanberg
 
Strategic Management, Vision Mission, Internal Analsysis
Strategic Management, Vision Mission, Internal AnalsysisStrategic Management, Vision Mission, Internal Analsysis
Strategic Management, Vision Mission, Internal Analsysistanmayarora45
 
Leaders enhance communication by actively listening, providing constructive f...
Leaders enhance communication by actively listening, providing constructive f...Leaders enhance communication by actively listening, providing constructive f...
Leaders enhance communication by actively listening, providing constructive f...Ram V Chary
 
BDSM⚡Call Girls in Sector 99 Noida Escorts >༒8448380779 Escort Service
BDSM⚡Call Girls in Sector 99 Noida Escorts >༒8448380779 Escort ServiceBDSM⚡Call Girls in Sector 99 Noida Escorts >༒8448380779 Escort Service
BDSM⚡Call Girls in Sector 99 Noida Escorts >༒8448380779 Escort ServiceDelhi Call girls
 
International Ocean Transportation p.pdf
International Ocean Transportation p.pdfInternational Ocean Transportation p.pdf
International Ocean Transportation p.pdfAlejandromexEspino
 
internal analysis on strategic management
internal analysis on strategic managementinternal analysis on strategic management
internal analysis on strategic managementharfimakarim
 
Dealing with Poor Performance - get the full picture from 3C Performance Mana...
Dealing with Poor Performance - get the full picture from 3C Performance Mana...Dealing with Poor Performance - get the full picture from 3C Performance Mana...
Dealing with Poor Performance - get the full picture from 3C Performance Mana...Hedda Bird
 

Dernier (15)

How Software Developers Destroy Business Value.pptx
How Software Developers Destroy Business Value.pptxHow Software Developers Destroy Business Value.pptx
How Software Developers Destroy Business Value.pptx
 
Beyond the Codes_Repositioning towards sustainable development
Beyond the Codes_Repositioning towards sustainable developmentBeyond the Codes_Repositioning towards sustainable development
Beyond the Codes_Repositioning towards sustainable development
 
Agile Coaching Change Management Framework.pptx
Agile Coaching Change Management Framework.pptxAgile Coaching Change Management Framework.pptx
Agile Coaching Change Management Framework.pptx
 
Abortion pills in Jeddah |• +966572737505 ] GET CYTOTEC
Abortion pills in Jeddah |• +966572737505 ] GET CYTOTECAbortion pills in Jeddah |• +966572737505 ] GET CYTOTEC
Abortion pills in Jeddah |• +966572737505 ] GET CYTOTEC
 
Independent Escorts Vikaspuri / 9899900591 High Profile Escort Service in Delhi
Independent Escorts Vikaspuri  / 9899900591 High Profile Escort Service in DelhiIndependent Escorts Vikaspuri  / 9899900591 High Profile Escort Service in Delhi
Independent Escorts Vikaspuri / 9899900591 High Profile Escort Service in Delhi
 
Reviewing and summarization of university ranking system to.pptx
Reviewing and summarization of university ranking system  to.pptxReviewing and summarization of university ranking system  to.pptx
Reviewing and summarization of university ranking system to.pptx
 
Marketing Management 16th edition by Philip Kotler test bank.docx
Marketing Management 16th edition by Philip Kotler test bank.docxMarketing Management 16th edition by Philip Kotler test bank.docx
Marketing Management 16th edition by Philip Kotler test bank.docx
 
Safety T fire missions army field Artillery
Safety T fire missions army field ArtillerySafety T fire missions army field Artillery
Safety T fire missions army field Artillery
 
Strategic Management, Vision Mission, Internal Analsysis
Strategic Management, Vision Mission, Internal AnalsysisStrategic Management, Vision Mission, Internal Analsysis
Strategic Management, Vision Mission, Internal Analsysis
 
Leaders enhance communication by actively listening, providing constructive f...
Leaders enhance communication by actively listening, providing constructive f...Leaders enhance communication by actively listening, providing constructive f...
Leaders enhance communication by actively listening, providing constructive f...
 
Intro_University_Ranking_Introduction.pptx
Intro_University_Ranking_Introduction.pptxIntro_University_Ranking_Introduction.pptx
Intro_University_Ranking_Introduction.pptx
 
BDSM⚡Call Girls in Sector 99 Noida Escorts >༒8448380779 Escort Service
BDSM⚡Call Girls in Sector 99 Noida Escorts >༒8448380779 Escort ServiceBDSM⚡Call Girls in Sector 99 Noida Escorts >༒8448380779 Escort Service
BDSM⚡Call Girls in Sector 99 Noida Escorts >༒8448380779 Escort Service
 
International Ocean Transportation p.pdf
International Ocean Transportation p.pdfInternational Ocean Transportation p.pdf
International Ocean Transportation p.pdf
 
internal analysis on strategic management
internal analysis on strategic managementinternal analysis on strategic management
internal analysis on strategic management
 
Dealing with Poor Performance - get the full picture from 3C Performance Mana...
Dealing with Poor Performance - get the full picture from 3C Performance Mana...Dealing with Poor Performance - get the full picture from 3C Performance Mana...
Dealing with Poor Performance - get the full picture from 3C Performance Mana...
 

PMP Chap 7 - Project Cost Management - Part 2

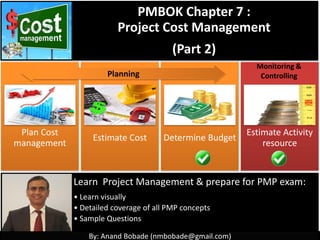
  • 1. By: Anand Bobade (nmbobade@gmail.com) Plan Cost management Estimate Cost Determine Budget Control cost PMBOK Chapter 7 : Project Cost Management (Part 2) Learn Project Management & prepare for PMP exam: • Learn visually • Detailed coverage of all PMP concepts • Sample Questions Monitoring & Controlling Planning
  • 2. By: Anand Bobade (nmbobade@gmail.com)By: Anand Bobade (nmbobade@gmail.com) 7.1 Plan Cost Management: Establishes the Policies, procedures, and documentation for planning, managing, expending, controlling project costs. 7.2 Estimate Cost: Developing an APPROXIMATION of the monetary resources needed to complete project activities. 7.3: Determine Budget: AGGREGATING the estimated costs of individual activities or WP to establish cost baseline. 7.4 Control Cost: MONITORING the status to update costs and managing changes to the cost baseline 7. Project Cost Management Processes
  • 3. By: Anand Bobade (nmbobade@gmail.com) Aggregating the estimated costs of individual activities or work packages to establish an authorized cost baseline. Determines the cost baseline against which project performance can be monitored and controlled. 7.3 Determine Budget -> Definition Cost Baseline Aggregation Activity cost estimates Contingency Reserve
  • 4. By: Anand Bobade (nmbobade@gmail.com)By: Anand Bobade (nmbobade@gmail.com) Input (9) • Cost management plan • Scope baseline • Activity cost estimates • Basis of estimates • Project schedule • Resource calendars • Risk register • Agreements • OPA Tools & Techniques (5) • Cost aggregation • Reserve analysis • Expert judgment • Historical relationships • Funding limit reconciliation Outputs (3) • Cost baseline • Project funding requirements • Project documents updates 7.3 Determine Budget
  • 5. By: Anand Bobade (nmbobade@gmail.com) Cost Management Plan Scope Baseline Activity cost estimates Basis of estimates Project schedule Resource calendars Risk Register Agreements OPA 7.3 Determine Budget -> Inputs
  • 6. By: Anand Bobade (nmbobade@gmail.com) Cost Management Plan Define how project costs will be planned, structured, and controlled. Provide information about how to execute determine Budget Process. Specify preferred method or techniques to be used. Provides below key details. Units of Measure Level of Precision Level of Accuracy Process Description Control account 7.3 Determine Budget->Input->Cost Management Plan
  • 7. By: Anand Bobade (nmbobade@gmail.com) Scope Baseline • Project Scope (Inclusion & exclusions) • Assumptions and constraints. Scope Statement • Activity grouped into deliverables or work packages. • WBS provide framework for cost management. WBS • Control account • List of Deliverables • Resources WBS Dictionary 7.3 Determine Budget->Input->Scope Baseline
  • 8. By: Anand Bobade (nmbobade@gmail.com) Activity Cost Estimates Cost estimate for each activity Activity Grouping Cost estimate for each Work package Direct Cost Indirect Cost Variable cost Fixed Cost Estimation of the probable costs required to complete project work. (summary form or in detail) 7.3 Determine Budget->Input->Activity Cost Estimate
  • 9. By: Anand Bobade (nmbobade@gmail.com) Basis of Estimates Documentation consist of : Method of estimations All assumptions Any known constraints Scope of Work The supporting documentation that provide a clear & complete understanding of how cost estimate was derived. 7.3 Determine Budget-> Input-> Basis of Estimate Estimate Cost Determine Budget Basis of Estimates Activity Cost Estimates
  • 10. By: Anand Bobade (nmbobade@gmail.com) Project Schedule Schedule provide overall timeline with milestones. Cost is always time bound, hence its important to know when these activities are scheduled. Information can be used to determine aggregated cost for specific period & payment milestones. 7.3 Determine Budget->Input->Project schedule
  • 11. By: Anand Bobade (nmbobade@gmail.com) Risk Register Examine cost & schedule related risks. Reserve should be planned to mitigate & inspect Risks. Potential benefits from the positive risk should be considered. 7.3 Determine Budget-> Input->Risk Register
  • 12. By: Anand Bobade (nmbobade@gmail.com) Resource Calendars Identifies the working days and shifts on which each specific resource is available. Provides details about when & how long identified project resource will be available. Helps to determine resource cost. 7.3 Determine Budget->Input->Resource Calendar
  • 13. By: Anand Bobade (nmbobade@gmail.com) Agreements Provide information about contracted resource costs like Human resource cost, equipment costs etc Provide payment milestone of each contractual agreements. Project can have one or more agreements. 7.3 Determine Budget ->Inputs->Agreement
  • 14. By: Anand Bobade (nmbobade@gmail.com) OPA Existing cost policies, procedures, and guidelines (e.g., Budget approval process) Financial controls procedures. Cost Budgeting tools. Financial reporting methods/templates. 7.3 Determine Budget->Input->OPA
  • 15. By: Anand Bobade (nmbobade@gmail.com)By: Anand Bobade (nmbobade@gmail.com) How project costs will be managed and controlled Project scope statement , WBS & WBS dictionary Cost estimates for each activity within a work package are aggregated Any basic assumptions dealing with the inclusion or exclusion of indirect or other costs in the project budget Information can be used to aggregate costs to the calendar periods in which the costs are planned to be incurred. 7.3 Determine Budget -> Inputs overview
  • 16. By: Anand Bobade (nmbobade@gmail.com)By: Anand Bobade (nmbobade@gmail.com) Provide information on which resources are assigned to the project and when they are assigned To consider how to aggregate the risk response costs Applicable agreement information and costs relating to products purchase Existing policies, procedures, and guidelines; Cost budgeting tools, Reporting methods 7.3 Determine Budget -> Inputs overview
  • 17. By: Anand Bobade (nmbobade@gmail.com) Cost Aggregation Reserve Analysis Expert Judgment Historical Relationships Funding limit Reconciliation 7.3 Determine Budget-> Tools & Techniques
  • 18. By: Anand Bobade (nmbobade@gmail.com) Cost Aggregation Accumulation of costs based on WBS structure. Considers distribution of payments w.r.t schedule base line. 7.3 Determine Budget->T&T->Cost Aggregation Cost estimates are aggregated by: Work packages Control accounts Entire project. Activity (Level1) Work Package (Level2) Component/control Account (Level3) Project (Level4) 500 K 200 K 100 100 300K 100 150 100 50 50
  • 19. By: Anand Bobade (nmbobade@gmail.com) Cost Aggregation It is placed at the selected management points in the WBS. It has unique code , which can be linked to accounting system. CRM Project – Cost Baseline (850 K) Call Center upgrade (100 K) Installations (40K) Call center software Customization (60 K) Contact Center setup (250K) Infrastructure setup (200 K) Software implementation (50 K) CRM system implementation (500K) CRM System Cost (400 K) Software Customization & implementation (100 K) Control Account (CA) : It is a management control point where scope, cost and schedule are integrated 7.3 Determine Budget->T&T->Cost Aggregation CA01 CA02 CA03
  • 20. By: Anand Bobade (nmbobade@gmail.com) Reserve Analysis Management Reserve: • Project budget withheld for management control purposes. • Reserved for unforeseen work that is within scope of the project (unknown unknowns). • Not included in the cost baseline • Part of overall project budget & funding requirements. Contingency Reserve: • Budget within cost baseline • Allocated for identified & accepted risks (known-unknowns) • Contingency should be clearly documented. • Part of the cost baseline & overall funding requirements. 7.3 Determine Budget->T&T->Reserve Analysis
  • 21. By: Anand Bobade (nmbobade@gmail.com) Reserve Analysis Activity contingency reserve + Activity Estimate + Work Package Estimates Control Accounts +COST BASELINE PROJECT BUDGET 400 70 330 330 20 110 10010 200 18020 7.3 Determine Budget->T&T->Reserve Analysis No reserves
  • 22. By: Anand Bobade (nmbobade@gmail.com) Expert Judgment Guided by experience in an application area, Knowledge Area, discipline, industry, or similar project PM may apply experience & information from prior similar projects. Consultants, SME or financial experts can provide budgeting expertise. 7.3 Determine Budget->T&T->Expert Judgment
  • 23. By: Anand Bobade (nmbobade@gmail.com) Historical Relationships • Home construction -> Cost per square meterSimple • Software development Model • Multiple adjustment factors, each of which has numerous points within it. • E.g., Code, integrations, function point, data migration Complex • Accurate Historical information is available • Quantifiable parameters • Scalable models (Can work with Large, small or phases of the projects) Reliable when: Any historical relationships that result in parametric estimates or analogous estimates. It uses project characteristics (parameters) to develop mathematical models to predict total project costs. 7.3 Determine Budget->T&T->Historical Relationship
  • 24. By: Anand Bobade (nmbobade@gmail.com) Funding limit Reconciliation The expenditure should be reconciled with any funding limits on the commitment of funds for the project. A variance between funding limits and planned expenditures will sometimes necessitate rescheduling of work. This is accomplished by placing imposed date constraints for activities. Q1 Q2 Q3 Q4 Project planned expenditure 100K 100K 100K 100K Actual project cost 110K 115K 7.3 Determine Budget->T&T->Funding limit reconciliation Project is moving fast ahead of schedule & hence spending more than planned. However, management has Imposed Quarterly Funds limit on project. Hence project has to re-schedule & slow down. re-schedule & slow down
  • 25. By: Anand Bobade (nmbobade@gmail.com) Cost baseline Project funding requirements Project doc. updates 7.3 Determine Budget -> Outputs
  • 26. By: Anand Bobade (nmbobade@gmail.com) Cost baseline Approved version of time-phased project budget, excluding any management reserves. It is used as a basis for comparison to actual expenditure. 7.3 Determine Budget -> Outputs->Cost Baseline 0 500 1,000 1,500 2,000 2,500 3,000 Jan Feb Mar Apr May Jun Jul Aug Sep Oct Nov Dec Thousands Monthly Budget Cummulative Budget
  • 27. By: Anand Bobade (nmbobade@gmail.com) Project funding requirements The total funds required: Cost baseline •Projected expenditures •Contingency Reserves Management reserves (if any). Total funding requirements derived from cost baseline. Funding often occurs in incremental amounts that are not continuous, and may not be evenly distributed. 7.3 Determine Budget->Outputs->Project funding Req. It may also refer to source(s) of the funding.
  • 28. By: Anand Bobade (nmbobade@gmail.com)By: Anand Bobade (nmbobade@gmail.com) Approved version of the time-phased project budget, excluding any management reserves, used as a basis for comparison to actual results Total funding requirements & periodic funding requirements are derived from the cost baseline. Risk Register, Activity register & Project schedule 7.3 Determine Budget -> Outputs
  • 29. By: Anand Bobade (nmbobade@gmail.com)By: Anand Bobade (nmbobade@gmail.com) 7.3 Determine Budget->Data Flow Diagram
  • 30. By: Anand Bobade (nmbobade@gmail.com) 7.3 Determine Budget -> Question1 Which of the following output of Determine Budget process is used as an input in the Control Costs Process? A. Project Funding Requirements B. Cost Baseline C. Project Document D. None A– Project Funding Requirements Refer to ITTO of Determine Budget & Control cost processes
  • 31. By: Anand Bobade (nmbobade@gmail.com)By: Anand Bobade (nmbobade@gmail.com) To Learn Project Management, Contact Anand Bobade (055 5932004) •nmbobade@gmail.com •https://ae.linkedin.com/in/anandbobade •http://www.slideshare.net/anandbobade •Conduct Online training, Corporate Training, evening & weekend workshops.
  • 32. By: Anand Bobade (nmbobade@gmail.com)By: Anand Bobade (nmbobade@gmail.com) 7.1 Plan Cost Management: Establishes the Policies, procedures, and documentation for planning, managing, expending, controlling project costs. 7.2 Estimate Cost: Developing an APPROXIMATION of the monetary resources needed to complete project activities. 7.3: Determine Budget: AGGREGATING the estimated costs of individual activities or WP to establish cost baseline. 7.4 Control Cost: MONITORING the status to update costs and managing changes to the cost baseline 7. Project Cost Management Processes
  • 33. By: Anand Bobade (nmbobade@gmail.com)By: Anand Bobade (nmbobade@gmail.com) 0 100 200 300 400 500 600 Jan Feb Mar Apr May Jun Jul Aug Sep Oct Nov Dec Thousands Planned Actuals Frequency of measurement Activity cost WBS components (Control accounts) Total project cost 7.4 Control Cost -> Introduction Don’t include unapproved change cost Influence factor affecting cost baselines Manage changes & cost overrun Measure Monitor Control Report
  • 34. By: Anand Bobade (nmbobade@gmail.com)By: Anand Bobade (nmbobade@gmail.com) • The factors that create changes to baselineInfluencing • All change requests are acted on in a timely mannerEnsuring • The actual changes when and as they occurManaging • That cost expenditures do not exceed the authorized funding by period, WBS ,activity, in totalEnsuring • Cost performance to isolate and understand variancesMonitoring • Work performance against funds expendedMonitoring • Unapproved changes reported or resource usage;Preventing • Appropriate stakeholders of all approved changes and associated cost;Informing • Expected cost overruns within acceptable limitsBringing 7.4 Control Cost
  • 35. By: Anand Bobade (nmbobade@gmail.com) Monitoring the status of the project to update the project costs & managing changes to the cost baseline. Provides the means to recognize variance from the plan in order to take corrective action and minimize risk. 7.4 Control Cost Monitoring Project status Update project Cost Manage cost baseline changes
  • 36. By: Anand Bobade (nmbobade@gmail.com)By: Anand Bobade (nmbobade@gmail.com) Input (4) • Project Management Plan • Project Funding Requirements • Work Performance Data • OPA Tools & Techniques (6) • Earned value management • Forecasting • To-complete performance index (TCPI) • Performance reviews • PM Software • Reserve analysis Outputs (6) • Work performance information • Cost forecasts • Change requests • PMP updates • Project documents updates • OPA updates 7.4 Control Cost
  • 37. By: Anand Bobade (nmbobade@gmail.com) PMP Project funding requirements Work performance data OPA 7.4 Control Cost -> Input
  • 38. By: Anand Bobade (nmbobade@gmail.com)By: Anand Bobade (nmbobade@gmail.com) Cost baseline & Cost management plan. Include projected expenditures plus anticipated liabilities (Cost baseline with management reserves) It includes progress information (started/ finished activities, their progress) ,costs authorized and incurred. Existing policies, procedures, and guidelines; Cost control tools; Monitoring and reporting methods. 7.4 Control Cost -> Input
  • 39. By: Anand Bobade (nmbobade@gmail.com) Earned value management Forecasting To-complete performance index (TCPI) Performance reviews Project management software Reserve analysis 7.4 Control Cost -> Tools & Techniques
  • 40. By: Anand Bobade (nmbobade@gmail.com) Earned value management It combines SCOPE, SCHEDULE, & RESOURCE measurements to assess project performance and progress. It integrates the scope ,cost & schedule baselines, to form the performance baseline • It is authorized budget planned for work to be accomplished. Planned Value (PV) • Realized cost incurred for the work performed on an activity during a specific time period. Actual cost (AC) • A measure of work performed expressed in terms of the budget authorized. Earned value (EV) 7.4 Control Cost -> T&T -> EVM
  • 41. By: Anand Bobade (nmbobade@gmail.com) Earned value Calculation based on the Percentage completion • 100% of work completed • EV = 100% of 10,000 • EV = 10,000 Day1 • Only 80% of work completed • EV = 80% of 10,000 • EV = 8,000 Day2 • EV = EV of Day1 + EV of Day2 • EV = 10,000 + 8,000 • EV = 18,000 Combined EV Schedule Planned Value (PV) Percentage Complete Actual Cost (AC) Earn Value (EV) Day1 10,000 100% 10,000 Day2 10,000 80% 10,000 7.4 Control Cost -> T&T -> EVM 10,000 8,000 18,000
  • 42. By: Anand Bobade (nmbobade@gmail.com) EV Calculation based on planned vs actual work done. 7.4 Control Cost -> T&T -> EVM Schedule Planned Work Planned Value (PV) Actual work Actual Cost (AC) Earn Value (EV) Day1 10 computer 10,000 9 computers 10,000 Day2 10 computer 10,000 10 computers 10,000 Plan : Install 10 computers each day costing 10,00 per day. • Only 9 computer installed on Day1 • Hence, EV of spending 10,000 is only 9,000 Day1 • 10 computer installed on Day 2 • Hence, EV of spending 10,000 is 10,000 Day2 10,000 9,000
  • 43. By: Anand Bobade (nmbobade@gmail.com)By: Anand Bobade (nmbobade@gmail.com) 7.4 Control Cost ->T&T-> EVM Task/Days Day1 Day2 Day3 Day4 Day5 Day6 Day7 Setup Setup Installation 10 comp 10 comp 10 comp 10 comp 10 comp Training & Handover Handover Project : Install 50 computers for school Lab. • Assumption: • Resource cost is 1000/day. One resource first & last day. • Two resources during execution (Day 2 to Day6) Planned cost(Cumulative) 1,000 3,000 5,000 7,000 9,000 11,000 12,000 Planned cost 1,000 2,000 2,000 2,000 2,000 2,000 1,000 We could not get resource with 1,000/per day, hence hired resource with 1100 per day Actual cost (Cumulative) 1,100 3,300 5,500 7,700 Actual cost 1,100 2,200 2,200 2,200 Earn Value 1,000 1,600 1,600 1,600 Earn Value (Cumulative) 1,000 2,600 4,200 5,800 Only 8 computer installed on each day, so 80% earn value 8 / 10 8 / 10 8 / 10
  • 44. By: Anand Bobade (nmbobade@gmail.com)By: Anand Bobade (nmbobade@gmail.com) 7.4 Control Cost -> T&T -> EVM PV: 7,000 BAC: 12,000 AC: 7,700 EV: 5,800 - 2,000 4,000 6,000 8,000 10,000 12,000 14,000 Day1 Day2 Day3 Day4 Day5 Day6 Day7 Cost Variance Schedule Variance Hints about Formula: Always start with “EV” Variance uses “-” Index uses “/” Only AC is used for Cost • SPI = EV/PV Schedule performance index • CPI = EV/ACCost performance index • SV = EV –PV Schedule variance • CV= EV − ACCost variance
  • 45. By: Anand Bobade (nmbobade@gmail.com)By: Anand Bobade (nmbobade@gmail.com) 7.4 Control Cost -> T&T -> EVM • = 5,800 –7,000 • = -1,200 Schedule variance SV = EV – PV • = 5,800− 7,700 • = -1,900 Cost variance CV = EV − AC • = 5,800 / 7,000 • = 0.82 Schedule performance Index SPI = EV / PV • = 5,800 / 7,700 • = 0.75 Cost performance Index CPI = EV / AC Indexes CPI SPI > 1 Under budget Ahead of schedule < 1 Over Budget Behind schedule = 1 On Budget (planned cost) On Schedule Project is over budget & behind Schedule
  • 46. By: Anand Bobade (nmbobade@gmail.com)By: Anand Bobade (nmbobade@gmail.com) Indexes CPI SPI > 1 You are earning more than the spending. In other words, you are under budget. More work has been completed than the planned work. In other words, you are ahead of schedule. < 1 You are earning less than the spending. In other words, you’re over budget Less work is completed than the planned work. In other words, you are behind schedule. = 1 Earning & spending are equal. Or proceeding exactly as per planned budget spending On Schedule 7.4 Control Cost -> T&T -> EVM
  • 47. By: Anand Bobade (nmbobade@gmail.com)By: Anand Bobade (nmbobade@gmail.com) 7.4 Control Cost -> T&T -> EVM • Slowdown with spending to try to reach optimal level • Try to move to optimal otherwise re- baseline. • Continue as it is • Spend more to catch up Under Budget but behind schedule Optimal – Under Budget & ahead of Schedule Over Budget but ahead of schedule Worst case: Over Budget & behind schedule CPI >1 [Ahead of Schedule] CPI < 1 CPI >1 [Behind Schedule] CPI < 1 SPI < 1 [Under Budget] SPI >1 SPI < 1 [Over Budget] SPI >1
  • 48. By: Anand Bobade (nmbobade@gmail.com)By: Anand Bobade (nmbobade@gmail.com) • SV is a measure of schedule performance on a project. Schedule variance (SV) • It measure of cost performance on a project. • It indicates relationship of performance to costs spent. Cost variance (CV) • SPI is a measure of progress achieved compared to progress planned. Schedule performance index (SPI) • CPI is a measure of value of work completed compared to actual cost. Cost performance index (CPI) 7.4 Control Cost -> T&T -> EVM
  • 49. By: Anand Bobade (nmbobade@gmail.com) 7.4 Control Cost -> T&T -> EVM -> Exercise Your earned value analysis shows the following values. Which of the following is true? - PV = 110,000, - AC = 90,000 - EV = 90,000, - BAC = 200,000 A) The project is ahead of schedule and on budget B) The project is on schedule and below budget C) The EAC is incorrect D) The project is behind schedule and on budget Answer : The project is behind schedule because as PV is 110,000 & EV is only 90,000. We are 20,000 behind schedule. We are on budget because both our Actual Cost and Earned Value are 90,000. Hence answer is D) The project is behind schedule and on budget
  • 50. By: Anand Bobade (nmbobade@gmail.com) 7.4 Control Cost -> T&T -> EVM -> Exercise Task Duration Planned Value Actual Jan Feb Mar Apr May Jun Analysis 20 1,000 1,400 Design 40 2,000 1,000 Development 60 10,000 4,000 Testing 10 2,000 - Go-live 10 1,000 - closure 0 - - Below graph shows the Project schedule & current performance of the IT project managed by Anand. What is the current SPI of the project. A: -1 B: 0.58 C: 1.21 D: 1 100% 75% 50%
  • 51. By: Anand Bobade (nmbobade@gmail.com) 7.4 Control Cost -> T&T -> EVM -> Exercise Calculate PV of completed or in progress activities • = Activity1(PV)+ Activity2(PV)+ Activity3(PV) • = 1,000+2,000+10,000 • = 13,000 Calculate EV of completed or in progress activities • = Activity1(PV * % complete)+ Activity2(PV * % complete)+ Activity3(PV * % complete) • = (1,000* 100%) + (2,000 * 75%) + (10,000 * 50%) • = 1,000+1,500+5,000 • = 7,500 SPI = EV / PV • = 7,500 /13,000 • = 0.5769 • (SPI <1 means project is behind schedule) Answer- B: 0.58
  • 52. By: Anand Bobade (nmbobade@gmail.com) Forecasting Prediction of conditions & events in project's future based on information & knowledge available during forecast. 7.4 Control Cost ->T&T-> Forecasting ETC - Estimate to complete: • Expected cost to finish all remaining project work. EAC - Estimate at completion: • Expected total cost of completing all work expressed as “sum of actual cost to date” & “estimate to complete”. • Forecasted estimate for total cost of the Project.
  • 53. By: Anand Bobade (nmbobade@gmail.com) 7.4 Control Cost ->T&T-> Forecasting ETC - Estimate to complete EAC - Estimate at completion Remaining Cost Total Cost at end
  • 54. By: Anand Bobade (nmbobade@gmail.com) EAC - Estimate at completion ETC - Estimate to complete The information is derived from: Project's past performance Information that could impact project in future Expected future performance 7.4 Control Cost ->T&T-> Forecasting
  • 55. By: Anand Bobade (nmbobade@gmail.com) EAC - Estimate at completion • Expected total cost of completing all work expressed as “sum of actual cost to date” & “estimate to complete”. Consider forecasted EAC, If BAC is no longer viable. EAC involves projections of project’s future based on current performance. Key input is work performance data. 7.4 Control Cost ->T&T-> Forecasting
  • 56. By: Anand Bobade (nmbobade@gmail.com) EAC - Estimate at completion • Expected total cost of completing all work expressed as “sum of actual cost to date” & “estimate to complete”. EAC based on Budgeted Rate: • Absorb the Variance (originally planed budgeted rate) EAC based on Current Progress: • Take the ongoing project trend (CPI & SPI or only CPI) EAC - Erroneous scenario: • Re-estimate the remaining portion • Original estimates were fundamentally flowed. 7.4 Control Cost ->T&T-> Forecasting
  • 57. By: Anand Bobade (nmbobade@gmail.com) EAC based on Budgeted Rate: EAC based on Current Progress: EAC - Erroneous scenario: • EAC = AC + (BAC –EV)Based on Budgeted rate • EAC = BAC / CPI Based on CPI. • EAC = AC + [(BAC –EV) / (CPI ×SPI)]Based on SPI & CPI • EAC = AC + re-estimateErroneous scenario: 7.4 Control Cost ->T&T-> Forecasting
  • 58. By: Anand Bobade (nmbobade@gmail.com) There are many ways to calculate EAC based on project progress. Questions about the EAC will always contain some information about the current “health” (or progression) of the project. There are certain keywords that you can look for to pick correct formula. 7.4 Control Cost ->T&T-> Forecasting • EAC = AC + (BAC –EV) • Current variances are thought to be atypical in the future. • Note: atypical means unusual or abnormal. EAC based on Budgeted Rate: • EAC = BAC / CPI • No variances from the BAC have occurred or are expected to continue at the same rate of spending. •This is most often required on the exam. EAC based on Current Cost Progress • EAC = AC + [(BAC – EV) / (CPI ×SPI)] • Current variances are thought to be typical in the future. EAC based on Current cost & schedule Progress • EAC = AC+ETC • Original estimate was fundamentally flawed or conditions have changed and invalidated original estimating assumptions EAC - Erroneous scenario:
  • 59. By: Anand Bobade (nmbobade@gmail.com)By: Anand Bobade (nmbobade@gmail.com) EAC based on Budgeted Rate: • EAC = AC + (BAC –EV) 7.4 Control Cost ->T&T-> Forecasting Bridge construction Project: • Duration : 12 months • Cost of the Project: 10,000,000 • Current status at end of month 3: • The pillar was collapsed & hence progress was slowed. • Work completed: only 20% of complete project • Actual cost: 3,000,000 BAC = 10,000,000 AC = 3,000,000 EV = 20% of 10,,000,000 = 2,000,000 (0nly 20% work done) EAC = AC + (BAC – EV) EAC = 3,000,000 + (10,000,000 – 2,000,000) = 11,000,000 EAC = 11 Million Considering this as rare incident. Project will continues as originally planned then it will need 11 Million to complete.
  • 60. By: Anand Bobade (nmbobade@gmail.com)By: Anand Bobade (nmbobade@gmail.com) EAC based on Current Progress (Based on CPI): EAC = BAC / CPI 7.4 Control Cost ->T&T-> Forecasting Bridge construction Project: • Duration : 12 months • Cost of the Project: 10,000,000 • Current status at end of month 6: • Work completed: only 40% of complete project • Actual cost: 6,000,000 BAC = 10,000,000 AC = 6,000,000 EV = 40% of 10,000,000 = 4,000,000 (0nly 40% work done) CPI = EV / AC = 4,000,000 / 6,000,000 = 0.66 EAC = BAC/CPI = 10,000,000/0.66 = 15,151,515 EAC = 15,151,515 If project continues to progress CPI 0.66 until end, you have to spend 15.15 Million to complete project.
  • 61. By: Anand Bobade (nmbobade@gmail.com)By: Anand Bobade (nmbobade@gmail.com) EAC based on Current Progress (Based on CPI & SPI): EAC = AC + [(BAC –EV) / (CPI ×SPI)] 7.4 Control Cost ->T&T-> Forecasting Bridge construction Project: Duration : 12 months Cost of the Project: 10,000,000 Current status at end of month 6: Work completed: only 40% of complete project Actual cost: 6,000,000 BAC = 10,000,000 & AC = 6,000,000 PV = 50% of 10,000,000 = 5,000,000 (six months completed) EV = 40% of 10,000,000 = 4,000,000 (0nly 40% work done) CPI = EV / AC = 4,000,000 / 6,000,000 = 0.66 SPI = EV / PV = 4,000,000 / 5,000,000 = 0.8 EAC = 6,000,000 + [ (10,000,000 – 4,000,000)/ (0.66 * 0.8) ] EAC = 6,000,000 + [6,000,000 / 0.528 ] = 17,363,636 If project continues with similar CPI & SPI, you have to spend 17.36 Million to complete project.
  • 62. By: Anand Bobade (nmbobade@gmail.com) Bridge construction Project: Duration : 12 months, Cost of the Project: 10,000,000 Current status at end of month 6: Work completed: only 55% of complete project Actual cost: 5,000,000 EAC based on Budgeted Rate: • EAC = AC + (BAC –EV) • BAC = 10,000,000 • AC = 5,000,000 • EV = 55%10,000,000 = 5,500,000 • EAC = 5,000,000 + ( 10,000,000 – 5,500,000) • EAC = 5,000,000 + 4,500,000 • EAC = 9,500,000 EAC based on Current Progress (Based on CPI): • EAC = BAC / CPI • BAC = 10,000,000 • AC = 5,000,000 • EV= 55%10,000,000 • EV =5,500,000 • CPI = EV / AC • CPI = 5,500,000 / 5,000,00= 1.1 • EAC = 10,000,000 / 1.1 • EAC = 9,090,909 EAC based on Current Progress (Based on CPI & SPI): • EAC = AC + [(BAC –EV) / (CPI ×SPI)] • PV = 50% of 10,000,000 = 5,000,000 (six months completed) • EV & CPI calculation is same. • SPI = EV / PV • SPI = 5,500,000 / 5,000,000 = 1.1 • EAC = 5,000,000 + [(10,000,000 – 5,500,000) / (1.1 * 1.1)] • EAC = 5,000,000 +( 4,500,000 / 1.21) • EAC = 5,000,000 + 3,719,008.26 • EAC = 8,719,008.26 7.4 Control Cost ->T&T-> Exercise
  • 63. By: Anand Bobade (nmbobade@gmail.com) 7.4 Control Cost -> T&T -> Exercise You presenting project status to Steering committee at the end of first Quarter in one year project. The project is progressing as planned and you expect no major problems in the foreseeable future. Your PMIS is showing following data: BAC = 500,000, SPI = 1.1, CPI = 1.05, EV = 173,000, AC = 164,761. What you should report about EAC in the meeting? A) 491,761 B) 454,545 C) 189,761 D) 476,190 Answer: Highlighted information indicates there were no variances after atypical situation & expect to continue at same rate. Hence, we will use second formula EAC= BAC/CPI =500,00/1.05 = 476,190; Hence, answer is D) 476,190
  • 64. By: Anand Bobade (nmbobade@gmail.com) 7.4 Control Cost -> T&T -> Exercise Task Duration Planned Value Actual Jan Feb Mar Apr May Jun Analysis 20 1,000 1,400 Design 40 2,000 2,000 Development 60 10,000 - Testing 10 2,000 - Go-live 10 1,000 - closure 0 - - Below schedule depicts the CRM Project schedule managed by Project managed Anand. As of today first two activities should have been 100% completed and third 50%. However PM reported 100% completion of first two, and remaining activities are not yet started. Assuming projects future performance will be at budgeted rate, what will be the projects EAC (Estimate at completion)? 100% 100% A: 3,400 B: 16,000 C: 16,400 D: 3,000
  • 65. By: Anand Bobade (nmbobade@gmail.com) Even though project is not performing as expected, we expect project to performed at the planned rate (budgeted rate). The formula used in this scenario is EAC = AC + (BAC – EV) 7.4 Control Cost -> T&T -> Exercise Calculate Actual Cost (AC) of completed or in progress activities. • = Activity1(AC)+ Activity2(AC) = 1,400+2,000 = 3,400 Calculate BAC (Total of all the activities) • BAC = 1,000 + 2,000 + 10,000 + 2,000 + 1,000 = 16,000 Calculate EV of completed or in progress activities • = Activity1(PV * % complete)+ Activity2(PV * % complete) • = (1,000* 100%) + (2,000 * 100%) = 1,000+2,000 = 3,000 EAC=AC+(BAC-EV) • =3,400 + (16,000 – 3,000) = 3,400 + 13,000 = 16,400 Answer – C: 16,400
  • 66. By: Anand Bobade (nmbobade@gmail.com)By: Anand Bobade (nmbobade@gmail.com) EAC - Estimate at completion (Re-estimate) • EAC = AC + ETC (or Re-estimate) 7.4 Control Cost ->T&T-> Forecasting Software Project: •Project is to implement CRM Software for government department for 5,000,000. •To date project has spent 1,100,000. •However, during execution, it was noticed that present cost estimation were fundamentally flawed & need to re-calculate budget for remaining part of the project. You discuss with your team & re-estimate the cost of the remaining work. Your new estimates: Design = 1,000,000, Development=3,00,000, testing=1,500,500 Re-estimated cost = Design + Development + testing Re-estimated cost = 1,000,000 + 3,000,000 + 1,500,500 = 5,500,500 EAC = AC + Re-estimate EAC = 1,100,000 + 5,500,500 = 6,500,500
  • 67. By: Anand Bobade (nmbobade@gmail.com) 7.4 Control Cost -> T&T -> Exercise Your Team Lead, who was leading the estimation team, tells you that he had missed several key project components in estimation. So, his original cost estimations were completely wrong. At the end of this meeting, he assured to provide new estimate in 2 days. Based on the new estimates, your PMIS shows below: BAC: 5,000,000. AC= 1,100,000, CPI = 1.05, SPI = 1.05, EV = 1,000,000. How much project will cost, if the new estimate to complete that you received from your Team Lead is 5,500,500? A) 5,500,500 B) 6,500,500 C) 6,600,500 D) 6,100,000 Answer: Highlighted information indicates there were fundamental flows in the estimates. Hence, we will use fourth formula EAC= AC + ETC = 1,100,000 +5,500,500 = 6,600,500; Hence, answer is C) 6,600,500
  • 68. By: Anand Bobade (nmbobade@gmail.com)By: Anand Bobade (nmbobade@gmail.com) ETC - Estimate to complete • ETC = EAC- AC or (Re-estimate remaining work) 7.4 Control Cost ->T&T-> Forecasting House construction Project: • You have a construction project to be completed in 12 months with cost of 1,000,000. • Six months passed & project have spent 600,000. • In meeting PM reported that only 40% of work is completed & project is expected to perform with same cost performance. • Management is interested to know what is Estimate to complete? BAC = 1,000,000, AC = 600,000 PV= 50% of 1,000,000 = 500,000 (six months completed) EV= 40% of 1,000,000 = 400,000 (0nly 40% work done) CPI= EV / AC = 400,000 / 600,000 = 0.66 EAC = BAC/CPI = 1,000,000/0.66 = 1,515,151 ETC = EAC- AC ETC = 1,515,151 – 600,000 ETC = 915, 151
  • 69. By: Anand Bobade (nmbobade@gmail.com)By: Anand Bobade (nmbobade@gmail.com) VAC (Variance at completion) • Projection of budget difference between BAC & EAC. 7.4 Control Cost ->T&T-> Forecasting VAC shows whether project is forecasted to finish under or over budget. VAC = BAC – EAC VAC % = EAC / BAC
  • 70. By: Anand Bobade (nmbobade@gmail.com) To-complete performance index (TCPI) TCPI calculation Same Budget Use BAC Revised Budget Use Forecasted EAC If BAC is no longer viable, then forecasted EAC should be approved to use in the TCPI calculation. TCPI is measure of Cost Performance that is required to be achieved in order to meet a specified management goal. Ratio of “cost to finish outstanding work”, to “remaining budget”. 7.4 Control Cost ->T&T-> TCPI
  • 71. By: Anand Bobade (nmbobade@gmail.com) To-complete performance index (TCPI) To-complete performance index (TCPI) Work Remaining ---------------------- Fund Remaining Ratio of “cost to finish outstanding work” to “remaining budget”. 7.4 Control Cost ->T&T-> TCPI TCPI (based on the BAC): ( BAC – EV ) ---------------- ( BAC – AC ) TCPI (based on the EAC): ( BAC – EV ) ---------------- ( EAC – AC )
  • 72. By: Anand Bobade (nmbobade@gmail.com)By: Anand Bobade (nmbobade@gmail.com) 7.4 Control Cost ->T&T-> TCPI->Same Budget 300,000 BAC:600,000 315,000 270,000 - 100,000 200,000 300,000 400,000 500,000 600,000 700,000 Month1 Month2 Month3 Month4 Month5 Month6 Planned Budget (PV) Actual Cost (AC) Earned Value (EV) Fund Remaining = BAC-AC = 600,000-315,000 = 285,000 Work Remaining = BAC-EV = 600,000-270,000 = 330,000 Case1: Same Budget Project with current status BAC=600,000 PV=300,000 AC=315,000 EV=270,000
  • 73. By: Anand Bobade (nmbobade@gmail.com)By: Anand Bobade (nmbobade@gmail.com) TCPI (based on BAC) Work Remaining = BAC-EV = 600,000-270,000 = 330,000 Fund Remaining = BAC-AC = 600,000-315,000 = 285,000 TCPI = Work Remaining / Fund Remaining = 330,000 / 285,000 = 1.15 You have to get output of 1.15 AED of every 1 AED spent. 7.4 Control Cost ->T&T-> TCPI
  • 74. By: Anand Bobade (nmbobade@gmail.com)By: Anand Bobade (nmbobade@gmail.com) 7.4 Control Cost ->T&T-> TCPI->Same Budget 300,000 BAC:600,000 315,000 270,000 - 100,000 200,000 300,000 400,000 500,000 600,000 700,000 Month1 Month2 Month3 Month4 Month5 Month6 Planned Budget (PV) Actual Cost (AC) Earned Value (EV) Fund Remaining = EAC-AC = 650,000-315,000 = 335,000 Work Remaining = BAC-EV = 600,000-270,000 = 330,000 Case1: Revised Budget Project with current status BAC=600,000 PV=300,000 AC=315,000 EV=270,000 EAC = 650,000
  • 75. By: Anand Bobade (nmbobade@gmail.com)By: Anand Bobade (nmbobade@gmail.com) TCPI (based on BAC) Work Remaining = BAC-EV = 600,000-270,000 = 330,000 Fund Remaining = BAC-AC = 600,000-315,000 = 285,000 TCPI = Work Remaining / Fund Remaining = 330,000 / 285,000 = 1.15 You have to get output of 1.15 AED of every 1 AED spent. TCPI (Based on EAC) Work Remaining = BAC-EV = 600,000-270,000 = 330,000 Fund Remaining = EAC-AC = 650,000-315,000 = 335,000 TCPI = Work Remaining / Fund Remaining = 330,000/335,000 =0.98 You have to get output of 0.98 AED of every 1 AED spent. 7.4 Control Cost ->T&T-> TCPI
  • 76. By: Anand Bobade (nmbobade@gmail.com) • Project is in a comfortable position.If TCPI < 1 • Project have to perform with better cost performance than past.If TCPI > 1 • Project can continue with same cost performance.if TCPI = 1 7.4 Control Cost ->T&T-> TCPI
  • 77. By: Anand Bobade (nmbobade@gmail.com) Performance reviews A technique used to measure, compare, & analyse actual performance of work in progress against baseline. Variance Analysis: • A technique for determining cause & degree of difference between baseline & actual performance. Trend Analysis • An analytical technique that uses mathematical models to forecast future outcomes based on historical results. Earned value management: • A methodology that combines scope, schedule, and resource measurements to assess project performance and progress. 7.4 Control Cost ->T&T->Performance review
  • 78. By: Anand Bobade (nmbobade@gmail.com) Performance reviews Compare cost performance of activities overrunning & under running budget. Determining cause & degree of variance relative to cost baseline. Variance Analysis: • Determining cause & degree of difference between baseline & actual performance. 7.4 Control Cost ->T&T->Performance review • CV = EV –ACCost Variance • SV = EV –PVSchedule Variance • VAC = BAC –EAC Variance at completion
  • 79. By: Anand Bobade (nmbobade@gmail.com) Performance reviews Uses past performance (historical results) with variance over time Compare future performance goals in the form of BAC versus EAC and completion dates. Examines performance over time is improving or deteriorating. Trend Analysis • Uses mathematical models to forecast future outcomes based on historical data. 7.4 Control Cost ->T&T->Performance review
  • 80. By: Anand Bobade (nmbobade@gmail.com) Performance reviews Compares the performance measurement baseline to actual schedule and cost performance. If not being used, then the analysis of the cost baseline against actual costs for the work performed is used . Earned value management: • It combines scope, schedule & resource to assess project performance & progress. 7.4 Control Cost ->T&T->Performance review
  • 81. By: Anand Bobade (nmbobade@gmail.com) Project management software Calculate earn value Display graphical trends & calculate SPI & CPI Show variances Forecast a range of possible final project results 7.4 Control Cost ->Tools & Techniques->PM software
  • 82. By: Anand Bobade (nmbobade@gmail.com) Reserve analysis Monitor status of contingency & management reserves. Determine, if these reserves are still needed or not. If not then free up the reserves. Determine, if additional reserves need to be requested. 7.4 Control Cost->Tools & Techniques->Reserve Analysis
  • 83. By: Anand Bobade (nmbobade@gmail.com) Work Performance Information Cost Forecasts Change Requests PMP Updates Project Documents Updates OPA updates 7.4 Control Cost -> Outputs
  • 84. By: Anand Bobade (nmbobade@gmail.com) Work Performance Information From results of Earn value calculation Variances (CV, SV & VAC) Performance indicators (SPI, CPI) All information to be documented & communicated to stakeholders. The performance data collected from various controlling processes, analysed in context & integrated based on relationships across areas. 7.4 Control Cost->Outputs->Work Performance Information
  • 85. By: Anand Bobade (nmbobade@gmail.com) Cost Forecasts Calculated EAC value & ETC value is documented and communicated to stakeholders 7.4 Control Cost->Outputs->Cost Forecasts EAC - Estimate at completion ETC - Estimate to complete Total Cost at end Remaining Cost
  • 86. By: Anand Bobade (nmbobade@gmail.com) 7.4 Control Cost->Outputs->Change Requests • To improve future performancePreventive CR: • Re-alignment of performanceCorrective CR: Change Requests A formal proposal to modify any document, deliverable, or baseline. Analysis of project performance may result in a CR to cost baseline or other components of PMP. Cost b baseline changes are mainly due to: Behind schedule or Over budget Activity Resource change Change in Cost estimate Risk realization or new risks
  • 87. By: Anand Bobade (nmbobade@gmail.com)By: Anand Bobade (nmbobade@gmail.com) Cost baseline. :in response to approved changes in scope, activity resources, or cost estimates. Cost management plan. changes to control thresholds or specified levels of accuracy required Cost estimates, and Basis of estimates. Causes of variances, Corrective action chosen and the reasons, Financial databases, and Other types of lessons learned from project cost control. 7.4 Control Cost -> Outputs
  • 88. By: Anand Bobade (nmbobade@gmail.com)By: Anand Bobade (nmbobade@gmail.com) 7. Project Cost Management -> Additional Concepts Money – value depends on time • Receiving AED 100 today has different meaning than receiving it after 1 year. Money Value as of Today (PV) Future value (FV)
  • 89. By: Anand Bobade (nmbobade@gmail.com)By: Anand Bobade (nmbobade@gmail.com) 7. Project Cost Management -> Additional Concepts Money – value depends on time • Receiving AED 100 today has different meaning than receiving it after 1 year. Money Value as of Today (PV) Future value (FV)
  • 90. By: Anand Bobade (nmbobade@gmail.com) 7. Project Cost Management -> Additional Concepts • Present Value (PV) = 1,000 • Years : 2 years • Interest: 5% (0.05) • Future Value (FV) = ?? The future value ( FV ) • It refers to a method of calculating how much present value (PV) of an asset or cash will be worth at a specific time in the future FV = PV (1 + R)^N • FV: Future value • PV: Present value • N: time of years • R: Interest rate Above example, FV=?? • = 1,000 (1 + 0.05)^2 ) • = 1,000 * (1.05^2) • = 1,000 * 1.1025 • = 1,102.5
  • 91. By: Anand Bobade (nmbobade@gmail.com) 7. Project Cost Management -> Additional Concepts Present Value: • The value of an expected income(as of date of valuation) • PV <= FV because money has interest-earning potential • To calculate PV, discount FV by interest rate •Present Value (PV) = ?? •Years : 2 years •Interest: 5% (0.05) •Future Value (FV) = 1,000 PV = FV/ (1 + R)^N • PV: Present value • FV: Future value • N: time of years • R: Interest rate Above example, what is PV?? • PV = 1,000 / (1 + 0.05)^2 ) • PV = 1,000 / (1.05^2) • PV = 1,000 / 1.1025 • PV = 907
  • 92. By: Anand Bobade (nmbobade@gmail.com) 7. Project Cost Management -> Additional Concepts Net present value (NPV): • The total present value (PV) of a time series of cash flows. • It allows calculating the accurate value of the project. • If NPV > 0; then accept the project otherwise reject it. Initial investment ( Express as negative number) All Present values (PV’s) Example: If project costs 100,000 & generates income as below with discounted rate of 10% Year 1 = 50,000 ; Year 1 = 37,000 ; Year 1 = 43,000 PV1 = 50,000 / (1 + 0.1) ^1 = 45455.54 PV2 = 37,000 / (1 + 0.1) ^2 = 30578.50 PV3 = 43,000 / (1 + 0.1) ^3 = 32306.53 NPV = (-100,000) + 45455.54 + 30578.50 + 32306.53 = 8,339.57
  • 93. By: Anand Bobade (nmbobade@gmail.com) 7. Project Cost Management -> Questions The project selection board was presented with following project opportunities: Project A has a duration of 5 years and an NPV of 90,000, Project B has a duration of 4 years and an NPV of 80,000, Project C has a duration of 3 years and an NPV of 70,000 Project D has a duration of 2 years and an NPV of 60,000. Which project will be selected by board based on above information? A) Project A B) Project B C) Project C D) Project D Answer : When calculating the NPV of a project, the duration (no. of years) is already factored in the result. So, you can simply select the one with the highest NPV. Hence, answer is A) Project A
  • 94. By: Anand Bobade (nmbobade@gmail.com)By: Anand Bobade (nmbobade@gmail.com) 7.4 Control Cost -> T&T -> Examples & Scenarios Scenarios
  • 95. By: Anand Bobade (nmbobade@gmail.com)By: Anand Bobade (nmbobade@gmail.com) 7.4 Control Cost ->T&T-> Examples • = 2,000PV • = 2,000EV • = 2,000AC This is the ideal situation, where everything goes according to plan • = 2,000PV • = 1,500EV • = 1,700AC • = EV – AC = - 200Cost Variance Without Earned Value measurements, it appears project is in good shape. Expenditures are less than planned. Case 1 Case 2 Observation1
  • 96. By: Anand Bobade (nmbobade@gmail.com)By: Anand Bobade (nmbobade@gmail.com) 7.4 Control Cost ->T&T-> Examples • = 2,000PV • = 1,500EV • = 1,700AC With EV measurements, we see 500 worth of work is behind schedule; i.e., We are 25% behind our planed work Case 2 Observation 2 • = EV – PV = - 500SV • = (SV / PV) x 100 = -25%SV %
  • 97. By: Anand Bobade (nmbobade@gmail.com)By: Anand Bobade (nmbobade@gmail.com) 7.4 Control Cost ->T&T-> Examples • = 2,000PV • = 1,500EV • = 1,700AC We can see “Actuals” exceed “Earned Value” (EV) i.e., 1,500 worth of work was accomplished but money spent was 1,700. We have a 200 cost overrun (13.3% over budget) Case 2 Observation 3 • = EV – AC = - 200CV • = (CV / EV) x 100 = -13.3%CV %
  • 98. By: Anand Bobade (nmbobade@gmail.com)By: Anand Bobade (nmbobade@gmail.com) 7.4 Control Cost ->T&T-> Examples • = 2,000PV • = 1,500EV • = 1,700AC This means only 75 cents of work was done for each $1 worth of work planned. Only 88 cents worth of work was actually done for each $1 spent All performance indicators are Negative Case 2 Observation 4 • = EV/PV = 0.75SPI • = EV/AC = 0.88CPI • = EV-PV = -500SV • = EV-AC = -200CV
  • 99. By: Anand Bobade (nmbobade@gmail.com)By: Anand Bobade (nmbobade@gmail.com) 7.4 Control Cost ->T&T-> Examples • = 2,500PV • = 2,300EV • = 2,100AC Case 3 Bad News: Project work efficiency is a bit low, we are getting only 92 cents of work done on $1 spent. As a result, we are behind schedule. • = EV-PV = -200SV • = SV / PV x 100 = -8%SV% • = EV/PV = 0.92SPI • = EV-AC = 200CV • = CV/PV X 100 = 8%CV% • = EV/AC = 1.095CPI Good news: Project is running under budget. We’re getting $1.095 worth of work done for each $1 spent.
  • 100. By: Anand Bobade (nmbobade@gmail.com)By: Anand Bobade (nmbobade@gmail.com) 7.4 Control Cost ->T&T-> Examples • = 2,000PV • = 1,800EV • = 1,800AC Case 4 Bad News: Project work is not accomplished on Schedule • = EV-PV = -200SV • = SV / PV x 100 = -10%SV% • = EV/PV = 0.9SPI • = EV-AC = 0CV • = CV/PV X 100 = 0%CV% • = EV/AC = 1CPI Good news: Project is running as per our budget. The cost of the work accomplished is as we budgeted.
  • 101. By: Anand Bobade (nmbobade@gmail.com)By: Anand Bobade (nmbobade@gmail.com) 7.4 Control Cost ->T&T-> Examples • = 2,000PV • = 2,200EV • = 2,000AC SPI & CPI =1.1 Project work is getting done at 1.1% efficiency Case 5 • = EV-AC = 200CV • = CV/PV X 100 = 10%CV% • = EV/AC = 1.1CPI • = EV-PV = 200SV • = SV / PV x 100 = 10%SV% • = EV/PV = 1.1SPI Ahead or Schedule & under-running cost: Work is ahead of schedule by 10% & under-running cost by 10%. Management View: Too much Pessimistic planning
  • 102. By: Anand Bobade (nmbobade@gmail.com)By: Anand Bobade (nmbobade@gmail.com) 7.4 Control Cost -> Data Flow Diagram
  • 103. By: Anand Bobade (nmbobade@gmail.com)By: Anand Bobade (nmbobade@gmail.com) To Learn Project Management, Contact Anand Bobade (055 5932004) •nmbobade@gmail.com •https://ae.linkedin.com/in/anandbobade •http://www.slideshare.net/anandbobade •Conduct Online training, Corporate Training, evening & weekend workshops.
  • 104. By: Anand Bobade (nmbobade@gmail.com) Thank You! To Learn Project Management, Contact Anand Bobade (055 5932004) •nmbobade@gmail.com •https://ae.linkedin.com/in/anandbobade •http://www.slideshare.net/anandbobade •Conduct Online training, Corporate Training, evening & weekend workshops. Free learning resources on slide share