cushman & wakefield the economy cre and investment ideas -
ClearPath Investment Perspectives - Nov 17 2014
1. Brendan Connaughton
Chief Investment Officer
Phone: (415) 682-6894
brendan@clearpathcapital.com
ClearPath Investment Perspectives
November 17, 2014
ClearPath
US Economic Scenarios
Avg. Recovery
10%
Subpar
60%
Stagflation
30%
Severe
0%
Economic & Market 2014 Full Yr. Full Yr. 2013 Q1 Q2 Q3 Q4 2014 2015
Global GDP (Yr./Yr.%)
3.20%
3.15%
3.25%
3.50%
3.75%
3.60%
4.10%
Global CPI (Yr./Yr.%)
1.75%
1.75%
2.00%
2.00%
2.15%
1.90%
2.25%
US GDP (Yr./Yr.%)
1.9%
-2.90%
4.6%
3.50%
3.00%
2.65%
2.90%
US CPI % (Yr./Yr.%)
1.5%
2.00%
1.60%
1.73%
1.90%
1.80%
2.00%
Fed Funds
0.1%
0.1%
0.1%
0.1%
0.1%
0.1%
0.25%
10 yr. Treas.
2.35%
3.03%
2.53%
2.52%
3.00%
3.10%
3.55%
Consensus Forecasts
Capital Market Data (using ETF data as of 11/14/14)
Index Last 5 Last Tot. Rt. Tot. Rt. NTM NTM TTM
Days Month YTD TTM P/E Earnings Yield P/B DIV%
MSCI AW
0.05%
5.13%
3.47%
5.39%
14.63x
6.83%
2.17x
1.49%
S&P 500
0.44%
7.21%
12.35%
16.27%
15.88x
6.29%
2.78x
1.98%
DJIA
0.39%
7.61%
8.58%
13.66%
15.01x
6.66%
3.04x
2.12%
NASDAQ
1.23%
8.22%
13.43%
19.43%
19.57x
5.10%
3.29x
1.21%
Russell 2000
0.08%
6.33%
1.99%
6.99%
21.38x
4.67%
2.20x
1.31%
MSCI EAFE
0.88%
3.43%
- 2.55%
0.39%
14.03x
7.12%
1.62x
3.08%
MSCI EM
0.34%
0.39%
1.42%
2.67%
10.99x
9.09%
1.49x
2.76%
Last Last Last
Index Price 5 Days Month YTD
London Gold
$1,185.70
2.56%
- 4.82%
- 1.81%
West Tex Oil
$ 75.46
- 2.12%
- 7.92%
- 18.81%
DJUBS Com
$ 21.56
- 0.78%
- 2.51%
- 16.00%
US / EUR
$ 1.2452
- 0.25%
- 2.23%
- 10.07%
US / Yen
$ 116.68
0.00%
9.86%
10.99%
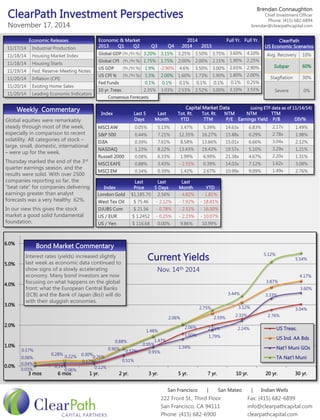
0.03%
0.06%
0.12%
0.51%
0.95%
1.60%
2.01%
2.32%
2.76%
3.04%
0.17%
0.28%
0.30%
0.90%
1.48%
2.06%
2.59%
3.12%
3.87%
4.17%
0.04%
0.14%
0.17%
0.57%
0.95%
1.34%
1.79%
2.24%
3.33%
3.60%
0.06%
0.22%
0.26%
0.88%
1.47%
2.06%
2.75%
3.44%
5.12%
5.54%
0.0%
1.0%
2.0%
3.0%
4.0%
5.0%
6.0%
3 mos
6 mos
1 yr.
2 yr.
3 yr.
5 yr.
7 yr.
10 yr.
20 yr.
30 yr.
US Treas.
US Ind. AA Bds
Nat'l Muni GOs
TA Nat'l Muni
Current Yields
Nov. 14th 2014
Weekly Commentary
Global equities were remarkably steady through most of the week, especially in comparison to recent volatility. All categories of stock – large, small, domestic, international – were up for the week.
Thursday marked the end of the 3rd quarter earnings season, and the results were solid. With over 2500 companies reporting so far, the “beat rate” for companies delivering earnings greater than analyst forecasts was a very healthy 62%.
In our view this gives the stock market a good solid fundamental foundation.
Bond Market Commentary
Interest rates (yields) increased slightly last week as economic data continued to show signs of a slowly accelerating economy. Many bond investors are now focusing on what happens on the global front: what the European Central Banks (ECB) and the Bank of Japan (BoJ) will do with their sluggish economies.
222 Front St., Third Floor
San Francisco, CA 94111
Phone: (415) 682-6900
Fax: (415) 682-6899
info@clearpathcapital.com
clearpathcapital.com
San Francisco | San Mateo | Indian Wells
Economic Releases
11/17/14
Industrial Production
11/18/14
Housing Market Index
11/18/14
Housing Starts
11/19/14
Fed. Reserve Meeting Notes
11/20/14
Inflation (CPI)
11/20/14
Existing Home Sales
11/20/14
Leading Economic Indicators
2. Brendan Connaughton
Chief Investment Officer
Phone: (415) 682-6894
brendan@clearpathcapital.com
222 Front St., Third Floor
San Francisco, CA 94111
Phone: (415) 682-6900
Fax: (415) 682-6899
info@clearpathcapital.com
clearpathcapital.com
San Francisco | San Mateo | Indian Wells
Economic Commentary
Data released last week showed that US Retail Sales rose 0.3% in October – a tiny bit stronger than the consensus forecast had anticipated. As expected, the recent
decline in the price of gasoline weighed on sales at service stations, which
fell 1.5% in October, but drove sales in other areas.
The falling price of gasoline is an incredibly powerful element. If gasoline prices remain at these lower levels for the next 12 months, the gain for the average US household would be an increase of $700 worth of purchasing power over the coming year.
ClearPath Investment Perspectives
November 17, 2014
Retail Sales
Where the Stock Market is… and how we got here…
S&P 500 Index: daily close from 10/9/2007 to Present
3. Brendan Connaughton
Chief Investment Officer
Phone: (415) 682-6894
brendan@clearpathcapital.com
222 Front St., Third Floor
San Francisco, CA 94111
Phone: (415) 682-6900
Fax: (415) 682-6899
info@clearpathcapital.com
clearpathcapital.com
San Francisco | San Mateo | Indian Wells
ClearPath Investment Perspectives
November 17, 2014
Odds and Ends…
Company Commentary
We recently held an exclusive client event at the Telsa Factory in Fremont. Because of some of our relationships, we are able to have our clients get a private tour of the factory and test drive cars on the Telsa test track. In that vein, I have reviewed the stock for some of the attendees.
Telsa Corp. designs, manufactures and sells high-performance electric cars. We are long-term bullish on Telsa – it’s a great way to invest in Elon Musk, Telsa’s visionary and innovative founder. The company’s Q3 earnings were solid, but the stock is still under its 50-day moving average. The stock has a great potential to run up to the $300 range.
Market Commentary
The market action between Sept. 18 to Oct. 15 was historic in nature. We saw dramatic sell-off in all “risk” assets, and the subsequent run is in “safe” assets.
What has been very encouraging for us is the coordination – or lack of correlations – of the two major groups. The action in the stock and bond markets has been very orderly over the last month. This gives us confidence that nothing is “broken.” The pullback we experienced was natural and, frankly, good for the long-term growth of the markets.
Market Commentary
One of the biggest surprises for almost all investors this year was the fall in interest rates. Using the US 10- yr. as a proxy for the overall bond market, the return thus far this year has been about 5.75%. This is in a year in which just about everyone thought you would lose money in bonds this year.
Jan. Feb. Mar. Apr. May Jun. Jul. Aug. Sep. Oct. Nov.
1700
1750
1800
1850
1900
1950
2000
2050
1%
2%
3%
3½%
-8%
+11%
US 10-yr. Treasury %
S&P 500 Index
2014 thru 11/14…
Important to remember that as interest rates go down – bond prices go up. The move inversely to each other.
Bollinger Bands- A band plotted 2 standard deviations away from the 50-day moving average,
200-day moving avg.
50-day moving avg.
4. Brendan Connaughton
Chief Investment Officer
Phone: (415) 682-6894
brendan@clearpathcapital.com
This publication is produced by ClearPath Capital Partners. The information & opinions herein are for general information use only. ClearPath does not guarantee the accuracy or completeness, nor does ClearPath assume any liability for any loss that may result from the reliance by any person upon any such information or opinions. Information & opinions are subject to change without notice, are for general information only & are not intended as an offer or solicitation with respect to the purchase or sales of any security or as personalized investment advice. No assurance can be given that any forecast or target can be achieved. Forecasts are based on assumptions, estimates, opinions & hypothetical models which may prove to be incorrect. Past performance is not indicative of future returns & does not guarantee of future results. Research obtained by unaffiliated 3rd party sources deemed reliable by ClearPath, however, ClearPath does not guarantee accuracy & completeness, & makes no warranties with respect to this data.
ClearPath Investment Perspectives
November 17, 2014
The Retail Sales… and the US Consumer…
An easy way to view or understand the
US economy is to break it down into
what moves or drives economic growth. In general terms, there are three main drivers to the US economy: government spending, corporate spending and consumer spending. The unscientific way to view this breakdown is one-third corporate/government spending and two-thirds US consumer spending. Of course it’s not just this simple, but this is a good way to start an analysis.
With that in mind, the US Consumer is an incredibly resilient economic entity. Moreover, much of what we spend as consumers is on things we must have: toothpaste, gas, groceries, etc. Consumer spending on the margin (that 5-10% of extra spending) makes the real difference for our economy and in overall economic growth.
Retail sales numbers were solid in October. Lower gasoline prices should translate into stronger spending in the future. The US Consumer – the most powerful economic force in the world – will continue to help drive our economy forward over the next 12 months or more.