1. 1
Macro Stress Tests and History-Based Stressed PD:
The Case of Hong Kong
(Published in Volume 16, Issues 3, July 2008
JOURNAL OF FINANCIAL REGULATION AND COMPLIANCE)
Michael Chak-sham Wong
Department of Economics and Finance
City University of Hong Kong
Yat-fai Lam
Department of Economics and Finance
City University of Hong Kong
Abstract
This paper ha discusses the issues about the stress-testing of credit portfolios. Currently there
is no standard methodology to perform stress tests and no standard to evaluate self-reported
stress-testing results. Some banks and bank supervisors have attempted to build econometrics
models for macro stress tests. These models may provide misleading conclusions because of
insufficient data available, inconsistent patterns of association, nonlinear behavior of credit
loss in stress conditions, and the relevance of the historical data in calibrating the model
parameters. These issues on econometrics models are illustrated with data of Hong Kong in
1997-2007. This period is an unusual stressed period for Hong Kong economy, having Asian
financial crisis in 1997, burst of IT bubble in 2001 and SARS outbreak in 2003. With the
given data, we find it is hard to identify suitable models for forecasting. This paper proposes
a methodology to estimate history-based stress probability of default (PD) to complement the
use of macro stress tests. By analyzing the default rates of the banking sector, bank
supervisors can easily identify the stress PD of individual banks. These estimates are very
helpful for bank supervisors to verify those self-reported stress PD and to compute the capital
adequacy ratios of all banks under stress.
2. 2
1. Introduction
Stress testing on the risk of credit portfolios is an important task for banks to comply with
Basel II requirements. There is a wide range of practices among financial institutions (see for
instance, Bank for International Settlements 2000; Financial Services Authority 2005;
Hoggarth, Logan and Zicchino 2005). Some bank supervisors have issued management level
guidelines on stress tests, while other bank supervisors are still exploring ways suitable of
their supervised banks. Data is always a problem in stress testing risk of credit portfolios.
Traditionally banks report the ratio of nonperforming loans. Now banks need to report PD or
default rate measured by “3-month past due”. These two sources of information are not the
same. Many banks do not have sufficient history of PD for building stress test models. This
makes stress testing a challenging task for them.
Some banks claim that they have successfully developed effective methodologies to perform
stress tests and report their stressed loss estimates to bank supervisors. How do bank
supervisors deal with these estimates? Some bank supervisors may consider the financial
soundness of individual banks. Bank supervisors may sum all banks’ estimates and evaluate
the impact of an economic stress on the banking sector. This comes an critical question: How
do bank supervisors know whether these stress loss estimates are consistent? So far there is
no standard on quantitative validation for stress testing models. Given a wide range of
methodologies used for stress testing, banks may intentionally consider some models that
provide them favorable results. If it happens, bank supervisors will underestimate the stress
risk of individual banks and the whole banking sector. Obviously, there should be some
yardsticks that help bank supervisors to verify the appropriateness of self-reported stress
estimates.
Stress test results of market risk and credit risk should be treated separately. For market risk,
stress loss amount may look trivial for most commercial banks in which interest-bearing
revenue usually accounts for more than 50% of their total revenue. When credit portfolios
are under stress, their loss can be severe. Consider a commercial bank that specializes in
3. 3
providing loans to unrated corporations. The original PD is 1%. When the market is under
severe stress, the default rate of the portfolio may go up to 14%. This estimate is based on
the IRB equation of Basel II. Such a sharp increase in default rate can impose serious threats
to the financial soundness of the bank because most banks keep their capital adequacy ratio
(CAR) at 11% to 15%. Therefore, if bank supervisors were unable to verify the
appropriateness of stress testing results, the banking system would be very vulnerable in
economic downturns.
This paper aims to discuss major issues of doing macro stress tests on banks and the banking
system. Section 2 identifies the limitations of building econometrics models for stress testing
credit portfolios. Section 3 illustrates the limitations of macro stress test models with the data
of Hong Kong in 1997-2007. Section 4 proposes a simple methodology to estimate history-
based stress PD and applies it to individual banks. The methodology provides an effective
tool for bank supervisors to verify self-reported stress PD provided by individual banks and
enables them to evaluate their capital adequacy ratios under stress. Section 5 concludes the
paper.
2. Models on Macro Stress Testing
Many previous studies support that macroeconomic conditions affect default rates and credit
risk forecasts. Default rate tend to increase in economic downturns (Fama 1986; and Wilson
1997a & b). Rating agencies tend to behave differently in different economic scenarios (Ferri,
Liu and Majnoni 2001; Monfort and Mulder 2000; and Reisen 2000). Rating downgrades
happen more frequently in economic downturns (Bangia, Diebold, Kronimus, Schagen, and
Schuermann 2002; and Nickell, Perraudin and Varotto 2000). Also, a number of theoretical
models llink macroeconomic factors with credit risk (see the summary of Allen and Saunder
2003).
To effectively evaluate the impacts of economic stress on financial systems, many central
banks and bank supervisors have spent effort on establishing framework for macro stress
4. 4
tests (Boss 2002; Hoggarth and Whitley 2003; Bundesbank 2003; Virolainen 2004;
Drehmann 2005; Wong, Choi and Fong 2006). These works echoes the initiative of the
Financial Sector Assessment Program (FSAP), a joint IMF and World Bank effort introduced
in May 1999. The program aims to better assess both the strengths the vulnerabilities of
financial systems in major economies and to develop some surveillance systems on the
stability of financial sector. Under this initiative, IMF develops Financial System Stability
Assessments (FSSAs) that evaluate risks to macroeconomic stability stemming from the
financial sector and the capacity of the sector to absorb macroeconomic shocks. A survey of
relevant methodologies can be found in Sorge (2004).
In order to assess the impact of macroeconomic shocks to the financial sectors, simple
models are developed to link write-offs or credit provisions (denoted by Yt) with
macroeconomic factors (denoted by Xt) and their lags (denoted by Xk,t). Xk,t may include,
among others, GDP growth, real interest rate, stock market return, property index return,
change in unemployment rate. The following are some prevalent models:
Model 1: t
n
k
tkk
h
t
t uXaaY ++= ∑∑= =1
,
0
0)ln(
Model 2: ∑∑= =
++=
− n
k
ttkk
h
tt
t
uXaa
Y
Y
1
,
0
0)
1
ln(
In the above models, k (from 1 to n) represents chosen macroeconomic factors and t (from 0
to h) represents chosen time lags. Estimation can be based on simple regression with lags,
vector autoregressive regression, seemingly unrelated regression, co-integration analysis and
others. These models have the following limitations:
(1) The models study mainly the impact of macroeconomic factors on the aggregate credit
quality in the banking sector. They do not evaluate their impact on individual banks.
Usually, under an economic stress, banks with high risk credit portfolios and/or poor risk
management systems will have strong hit. This may trigger off settlement and liquidity
5. 5
issues in the banking system. What bank supervisors need to do is to find out the banks
that are more sensitive to economic stress and exercise tighter controls on them, such as
higher capital requirements.
(2) The parameters in the models tend to be biased towards good or normal economic
conditions. It is because a severe economic stress may happen once every 10 years. Only
10% of data used for estimation represents data under economic stress. This means, the
models may underestimate the sensitivity of credit risk to economic stress.
(3) The models are assumed to follow some linear patterns. However, the impact of
macroeconomic variables in a stress scenario may be totally exponential. Default rate can
rise sharply in stress conditions.
(4) To build a stable econometrics model, the degree of freedom is normally expected to be
30 or more. If 5 X- variables and 2 lags are included in an econometric model, there
should be at least 40 quarterly observations, 10-year data. A model with less statistical
bias usually requires more data, say, 60 to 100 quarterly observations. Obviously, many
commercial banks and central banks do not have sufficient data to fulfill this statistical
requirement.
(5) An econometrics model tends to assume a stable relationship between the credit quality
and the macroeconomic variables in the financial sector. However, this relationship may
not be stable in many economies. Also, continuous changes in banking regulation in the
past 20 years affect the strategies of many banks. For instance, to reduce capital charge,
some banks rebalance their credit risk via securitization, investments in foreign credit-
related assets, utilizing credit derivatives, etc. The changes in the regulatory environment
can contribute substantially to the unstable association between credit risk and
macroeconomic variables.
6. 6
3. Can Econometrics Models Work? Some Issues in Hong Kong
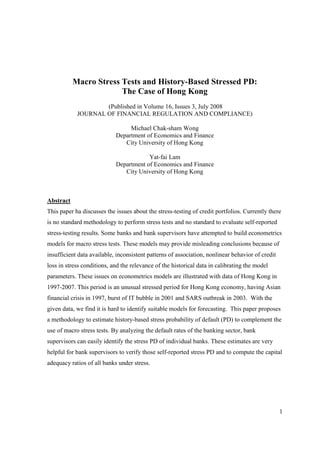
Let’s illustrate the above limitations of macro stress tests with the data in Hong Kong. The
recent major economic downturn in Hong Kong is the Asian financial crisis in 1997. Chart 1
displays the economic times series of various macroeconomic variables in Hong Kong from
Mar 1997 to Mar 2007. Default rates in the chart is the 3-month past due rate (in %) of the
major banks in Hong Kong. GDP, number of unemployed persons, stock market index (Hang
Seng Index) and property price index are all expressed in relative terms with their bases
equal to 1 in March 1997. This simplifies the comparison.
In Oct 1997, the Hong Kong dollar was strongly hit by a few global hedge funds. Then the
stock market immediately declined by more than 50% and rebounded in December 1998. The
property price index declined by more than 30% within 3 months after the incidence and kept
on falling until September 2003. The number of unemployed persons rose sharply to its first
peak in September 1999. Then it drops for several quarters and rose again to its second peak
in September 2003. The nominal GDP had relatively stable behavior in the post-crisis period.
The default rate started at 2.17% in March 1997 and hitit’s the peak at 7.39% in September
1999. Then it fell gradually and consistently in the subsequent quarters.
The movements of the above time series provide some interesting implications on building
econometrics models. Economic shocks on credit quality may have lagged impact up to 2
years. The economic crisis in last quarter of 1997 resulted in the highest default rate in
September 1999. This lagged effect on credit quality lasted for around 2 years. This may be
explained by the progressively cumulative impact of economic shocks on firms’ business
decisions and the labor market. When there were economic downturns, firms had their
profitability decreased. Some firms then announced bankruptcy and some surviving firms cut
costs by lying off employees. This process may take 1 to 2 years, gradually moving up the
default rates of corporate credits, residential mortgages and other retail credits. On the other
hand, the impact of economic downturns could be associated with their duration. Short
7. 7
duration may not trigger big jump in bankruptcy numbers and default rates because default
and bankruptcy are very costly to both lenders and borrowers. Economic downturns of long
duration can have tremendous effect on default rates. From a statistical perspective, a model
with 4 to 8 lags (quarterly data) may be better to address the above issue of lagged impact of
economic shocks. However, this model would not feasible because of limited data available
in Hong Kong.
In addition to the Asian financial crisis, Hong Kong experiences another two stressed
situations after 1997. One crisis was the burst of IT bubble in March 2001. Before the burst,
many internet/concept firms were established with private equities heavily involved. After
the burst, many of these firms went bankrupt their became jobless. In Chart 1, it is observed
that the number of unemployed persons increased after the burst of the IT bubble. The stock
market declined until March 2003. The property price index kept falling until Jun 2003.
However, the default rates kept on falling after the burst of the IT bubble.
Another stressed situation was the SARS outbreak in Hong Kong in March 2003 that made
the world seriously nervous. This nervous period lasted for 3 months. The GDP of Hong
Kong slightly fell after the SARS outbreak and the number of unemployed persons rises
slightly. The default rate rose slightly after the SARS outbreak but kept falling after Jun 2003.
8. 8
Chart 1
Default Rates and Macroeconomic Variables of Hong Kong (1997-2007)
-1.00
0.00
1.00
2.00
3.00
4.00
5.00
6.00
7.00
8.00
Mar-1997
Mar-1998
Mar-1999
Mar-2000
Mar-2001
Mar-2002
Mar-2003
Mar-2004
Mar-2005
Mar-2006
Mar-2007
Default Rate
GDP
Unemployment Number
Hang Send Index
Property Price Index
Asian Financial Crisis Burst of IT Bubble SARS Outbreak
The continuous fall in default rate after March 1999 was partly due to banks tightening the
lending policies. In response to the high default rate after the Asian financial crisis, many
banks in Hong Kong deliberately reduced lending to risky clients, scaled down their credit
lines offered to individual borrowers, and invested more in low-risk securities. This
interactive behavior would make an econometric model unstable.
Comparing the movements of the macroeconomic variables and the default rates in the above
three stressed situations, we can easily identify no consistent pattern of association between
default rate and macro economic factors. Although Wong, Choi and Fong (2006) have built
an econometrics model on default rates of the credit portfolios of the banking sector in Hong
Kong, it is difficult to conduct any cross-validation on this model and to perform any out-of-
sample test on its predictive accuracy.
9. 9
All these modeling problems not only apply to Hong Kong but also to other Asian economies
suffering from the crisis in 1997. For economies with higher degree of economic instability
and/or frequent changes in government policies, econometric modeling usually has some
similar problems. Given these constraints, how can analysts predict stressed PDs and stress
loss of the credit portfolios for individual banks and the banking system?
4. History-based Stressed PDs of the credit portfolios for Individual
Banks
From the data given in Section 3, it is clear that the stressed PDs of the credit portfolios for
the Hong Kong banking sector in 1997-2007 is 7.39% in September 1999. To be
conservative, banks should have prepared sufficient capital for this possible stress scenario.
PD = 7.39% is a history-based stressed PD of the credit portfolios for the banking sector and
an exposure-weighted average PD of all banks in Hong Kong. What should be the history-
based PDs for individual banks? Some banks may provide this information but some may
not. Also, banks may change their risk appetites over time. It is necessary for bank
supervisors to develop tools to evaluate the history-based stressed PD for individual banks
and to adjust these estimates if banks change their risk appetite. This section proposes a
simple methodology to infer the history-based stress PD for individual banks from the
history-based stress PD of the banking sector.
According to the KMV default model, PD is the probability for the normalized asset level (A)
going below default threshold (Q). A is assumed to stay at 0 with SD = 1. Sometimes it
moves to the right because of good economic conditions and to the left because of bad
economic conditions. When A is positive, the distance-of-default (DD) is larger and the PD
becomes lower. When A is negative, the distance-of-default (DD) is smaller and the PD
becomes higher.
10. 10
Assume that the banking sector has a long-run PD (denoted by PD*) that reflects the
aggregate risk appetite of all banks in credit risk exposure. This PD* can be rather stable or
can slowly evolve over time unless all banks suddenly change their risk appetite. Also, we
assume that actual default rate at t is an unbiased estimate of expected PD at t. The changes
in PDt is mainly caused by the changes in At. To estimate PD*, we can consider the median
of all observed PDt in recent history. The position of At can thus be estimated by
At = G(PD*) – G(Actual default rate at t) (1)
At is an implied asset value. G(PD*) is to return the inverse of PD*, measuring the long-
run default threshold (T*) of aggregate credit risk in the banking sector. G(Actual default rate
at t) is to return the inverse of observed default rate at t. This can be used to measure the
expected PDt caused by changes in At. In normal economic conditions, these two items
should be close to 0 and make At = 0 in Equation (1). If G(Actual default rate at t) is higher
than G(PD*), this will mean a negative At.
Table 1 shows the median PDt, PDt in stress conditions, and their corresponding At in Hong
Kong in 1997-2007. The median PDt is 2.68%, which is taken as the PD*. Following
Equation (1), we can estimate At for each quarter. PDt in stress conditions are empirical PDt
at the confidence level of 95%, 99%, 99.9% and 100% respectively. It is clear that the PDs
at 99%, 99.9% and maximum are very close. Their implied asset value At is around -0.48,
primarily reflecting the peak PD observed in Hong Kong in September 1999. At = -0.48 can
also taken as the history-based stress A of the banking sector in Hong Kong.
Table 1 Estimated Asset Value in Stress Conditions
Actual Default Rate G(Actual Default Rate) Implied Asset Value
Median 2.68% -1.93 0.00
95.00% 7.04% -1.47 -0.46
99.00% 7.27% -1.46 -0.48
11. 11
99.90% 7.38% -1.45 -0.48
Maximum 7.39% -1.45 -0.48
Estimating History-Based Stress PDs for Individual Banks
Commercial banks always maintain diversified credit portfolios. They differ in their PDs
because of their risk appetites that guide them to select their target credit assets. Some banks
prefer high-risk assets and some prefer low-risk assets. Assume that all banks have similar A
regardless of their PD levels. This means that the history-based stressed A of a banking
sector can be applied to all banks. In the IRB equation of Basel II, the R (correlation) is
negatively related with PD. Low-PD assets are more sensitive to the market factor than high-
PD assets. This paper primarily assumes that the credit assets of all banks have their A
sharing the same sensitivity to the market factor. With the same history-based stress A,
banks differ in their stress PD because of their default thresholds, which is the inverse of
their PD levels.
Table 1 has shown the history-based stressed asset level A at -0.48. The default threshold (Q)
of bank j can be obtained by Qj = G(PDj). The history-based stress PD for bank j can be
estimated by
History-based Stress PDj = Prob(History-based Stress A < Qj) (2)
Table 2 shows the history-based stress PD of several hypothetical banks, B01 to B06. The
banks have their PDj and default thresholds (Qj). The history-based stressed A is taken as -
0.48. The column “History-based Stressed PD” shows the stressed PD computed with
Equation (2). The column “IRB Stressed PD” displays shows the stressed PD estimated by
Basel IRB equation. In the equation, stressed PD is equal to:
12. 12
IRB Stressed PD = N[(1 – R)-0.5
× G(PD) + (R / (1 – R))0.5
× G(0.999)] (3)
where
N( ) = cumulative probability of a critical value in the bracket
G( ) = inverse of a cumulative probability
R = 0.12 × (1 – e-50 × PD
) / (1 – e-50
) + 0.24 × [1 – (1 – e-50 × PD
) / (1 – e-50
)]
The last column R is the correlation estimated with the equation provided by Basel II
document. As long as the PD of a bank is known, bank supervisors can easily estimate its
history-based stressed PD and compare it with its self-reported stressed PD. Bank
supervisors should expect self-reported stress PD higher than the history-based stressed PD.
The latter is a value that will happen again.
History-based Stress PD vs IRB Stress PD
Table 2 clearly indicates that the history-based stressed PD is much lower than the IRB
stressed PD. This implies that capital charge in IRB equation will be able to cover the
history-based stressed loss.
Let’s focus on the bank B04 in the table. This bank has PD = 2.68% which is the median of
the aggregate banking sector in Hong Kong. Its history-based stress PD is 7.35%, very close
to the historical peak PD at 7.39%. Its IRB stressed PD is 21.48%. Both the history-based
stressed PD and IRB stressed PD provide very useful references for bank supervisors to
verify those self-reported stress PD of individual banks.
The history-based stressed PD is a realistic and empirical estimate on credit risk under a
stress condition, while the IRB stress PD provides capital buffer for banks to continue their
business under the stressed condition. Bank supervisors should expect banks able to
maintain capital adequacy ratio greater than 8% even though a stress condition occurs.
Table 2 Stress PD of Several Hypothetical Banks
13. 13
Bank PD
Default
Threshold
History-based
Stress A
History-based
Stress PD IRB Stress PD
R in IRB
Equation
B01 0.50% -2.58 -0.48 1.80% 9.77% 0.21
B02 1.00% -2.33 -0.48 3.24% 14.03% 0.19
B03 2.00% -2.05 -0.48 5.78% 19.03% 0.16
B04 2.68% -1.93 -0.48 7.35% 21.48% 0.15
B05 3.50% -1.81 -0.48 9.14% 24.09% 0.14
B06 5.00% -1.64 -0.48 12.20% 28.45% 0.13
Commercial banks can rely on their internal models to determine their stressed PD. This aims
to encourage their enhancement on their risk management analysis. Bank supervisors can
build econometrics models to forecast future credit quality of the banking sector. However,
both the history-based stressed PD and IRB stressed PD should not be ignored because of the
following reasons:
(a) With these two stressed PD estimates, bank supervisors can easily verify self-reported
stressed PD of individual banks. If a bank produces a self-reported stressed PD lower
than what is expected, bank supervisors may take further actions to investigate the stress
test models of the bank.
(b) With the history-based stressed PD, bank supervisors can compute capital adequacy
ratios under stress for individual banks and makes sure that they are all above 8%.
(c) For a new bank or a bank having substantially changes in their risk appetite, bank
supervisors can assign an appropriate PD level and compute its history-based stress PD.
The PD assignment can be based on benchmarking with banks of similar risk profile.
This enables bank supervisors to assess the risk of a bank with very limited information.
5. Conclusions
14. 14
This paper has discussed the issues about stress testing credit risk. Currently there is no
standard methodology to do macro stress tests and no standard to evaluate self-reported
stressed estimates. Some banks and bank supervisors have attempted to build econometrics
models for macro stress tests. These models may provide inconsistent conclusions because of
insufficient data available, unstable patterns of association, nonlinear behavior of credit loss
in stress conditions, and the relevance of the historical data in calibrating the model
parameters. These issues on econometrics modeling have been illustrated with data of Hong
Kong in 1997-2007. This period is an unusual stressed period for Hong Kong economy,
having Asian financial crisis in 1997, burst of IT bubble in 2001 and SARS outbreak in 2003.
With the given data, we find it hard to identify suitable models for forecasting stress PD.
The paper has proposed a methodology to estimate history-based stressed PD to complement
the use of macro stress tests. History-based stressed PD is based on the peak default rate
observed in recent history of the banking sector. This estimate can be easily converted to the
stressed PD for individual banks as long as bank supervisors know the default rate of the
banks’ credit portfolios. With the estimates on history-based stressed PDs, bank supervisors
easily verify those self-reported stressed PDs and compute the capital adequacy ratios of all
banks under stress.
The discussion in this paper has not covered LGD. Some bank supervisors have set LGD =
45% for corporate credits if banks following foundation IRB. The LGD in Advanced IRB
approach is a downturn LGD. Bank supervisors can rely on the LGD or average write-offs
given default to calculate stress loss.
15. 15
References
Allen, L., A. Saunders (2003) “A survey of cyclical effects in credit risk measurement
models,” B for International Settlements Working Papers No 126, January.
Bangia, A., F. X. Diebold, A. Kronimus, C. Schagen, and T. Schuermann (2002) “Ratings
migration and the business cycle, with application to credit portfolio stress testing,” Journal
of Banking and Finance 26, 445-474.
Boss, M. (2002) “A Macroeconomic Credit Risk Model for Stress Testing the Austrian
Credit Portfolio,” Financial Stability Report 4, Oesterreichische Nationalbank.
Bank for International Settlements (2000) “Stress testing by large financial institutions:
current practice and aggregation issues,” Report by the Committee on the Global Financial
System, April.
Bundesbank (2003) “Stress testing the German banking system,” Monthly Report, December.
Drehmann, M. (2005) “A market based macro stress test for the corporate credit exposures of
UK banks,” Bank of England, April.
Fama, E. and G. Schwert, (1977), “Asset returns and inflation”, Journal of Financial
Economics, 5, pp.115-146
Ferri, G,. L. Liu and G. Majnoni (2001) “The role of rating agency assessments in less
developed countries: Impact of the proposed Basel guidelines,” Journal of Banking and
Finance 25 (2001), pp. 115–148.
Financial Services Authority (2005) “Stress testing,” Discussion Paper, May.
Hoggarth, G and Whitley, J (2003), “Assessing the strength of UK banks through
macroeconomic stress tests,” Bank of England Financial Stability Review, June.
Hoggarth, G, A. Logan and L. Zicchino (2005) “Macro stress tests of UK banks,” Bank for
International Settlements Papers No 22.
Monfort, B., C. Mulder (2000) “Using credit ratings for capital requirements on lending to
emerging market economies: Possible impact of a new Basel accord,” International Monetary
Fund Policy Working Paper WP/00/69.
Nickell, P., Perraudin, W. and Varotto, S. (2000) “Stability of rating transitions,” Journal of
Banking and Finance 24, 203-227.
16. 16
Reisen, H. (2002). “Ratings since the Asian crisis,” Organization for Economic Cooperation
and Development, Web Document 2.
Sorge Marco (2004), “Stress testing financial systems: An overview of current
methodologies, ” Bank for International Settlements Working papers No. 165.
Wilson, T.C. (1997a), “Portfolio credit risk (I),” Risk, September.
Wilson, T.C. (1997b), “Portfolio credit risk (II),” Risk, October.
Wong, J., K. F. Choi and T. Fong (2006) “A framework for stress testing bank’s credit risk,”
Research Memorandum, Hong Kong Monetary Authority (October)
Virolainen, K. (2004), “Macro stress testing with a macroeconomic credit risk
model for Finland,” Bank of Finland Discussion Papers, 18.