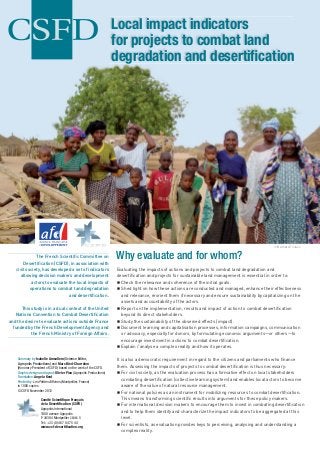
Local impact indicators for projects to combat land degradation and desertification
•
0 j'aime•738 vues

CSFD, 2012. Local impact indicators for projects to combat land degradation and desertification. Summary by Isabelle Amsallem and Marc Bied-Charreton, November 2012. This leaflet summarizes the main results of a study (2009-2012) undertaken by the Committee at the request of the French Development Agency. This study aims at defining a set of local indicators of the impact of projects to combat land degradation and desertification. Besides the description of these indicators, this document shows the difficulties of impact evaluations as well as methodological inputs.

Recommandé
Recommandé
Contenu connexe
Plus de csfd
Plus de csfd (20)
Dernier
Dernier (20)
Local impact indicators for projects to combat land degradation and desertification
- 1. Local impact indicators for projects to combat land degradation and desertification © Bernard Toutain The French Scientific Committee on Desertification (CSFD), in association with Why evaluate and for whom? civil society, has developed a set of indicators Evaluating the impacts of actions and projects to combat land degradation and allowing decision makers and development desertification and projects for sustainable land management is essential in order to: actors to evaluate the local impacts of Check the relevance and coherence of the initial goals. operations to combat land degradation Shed light on how these actions are conducted and managed, enhance their effectiveness and desertification. and relevance, reorient them if necessary and ensure sustainability by capitalizing on the assets and accountability of the actors. This study is in a dual context of the United Report on the implementation, results and impact of action to combat desertification Nations Convention to Combat Desertification beyond its direct stakeholders. and the desire to evaluate actions outside France Study the sustainability of the observed effects (impact). funded by the French Development Agency and Document learning and capitalisation processes, information campaigns, communication the French Ministry of Foreign Affairs. or advocacy, especially for donors, by formulating economic arguments—or others—to encourage investment in actions to combat desertification. Explain / analyse a complex reality and how it operates. Summary by Isabelle Amsallem (Science Editor, It is also a democratic requirement in regard to the citizens and parliaments who finance Agropolis Productions) and Marc Bied-Charreton (Honorary President of CSFD) based on the work of the CSFD. them. Assessing the impacts of projects to combat desertification is thus necessary: Graphic design and layout: Olivier Piau (Agropolis Productions) For civil society, as the evaluation process has a formative effect on local stakeholders Translation: Angela Kent Printed by: Les Petites Affiches (Montpellier, France) combating desertification (collective learning system) and enables local actors to become in 1000 copies aware of the value of natural resource management. © CSFD November 2012 For national policies as an instrument for mobilizing resources to combat desertification. Comité Scientifique Français This means transforming scientific results into arguments for these policy makers. de la Désertification (CSFD) For international decision makers to encourage them to invest in combating desertification Agropolis International 1000 avenue Agropolis and to help them identify and characterize the impact indicators to be aggregated at this F-34394 Montpellier CEDEX 5 level. Tel.: +33 (0)4 67 04 75 44 For scientists, as evaluation provides keys to perceiving, analysing and understanding a www.csf-desertification.org complex reality.
- 2. Why is it hard to evaluate the impact of projects? Some definitions… The natural and social systems evaluated and time scales (which are often long with are complex and poorly understood, as are respect to the dynamics of ecosystems and Outputs (outputs): qualitative and the relation(s) of causality between resource societies). The unexpected, undesirable, quantitative changes directly produced by action. use and management practices (vegetation, indirect etc. effects induced by project soils, water, etc.). The resources concerned interventions must also be integrated. Outcomes: the initial changes induced by these outputs to the surrounding physical may be misidentified and poorly visible Such impacts may also occur elsewhere and human environment. (e.g. soil organic matter). (positive or negative externalities) and at Impacts: new situation resulting from different times. all the effects. These are all types of The stakeholders are complex (types, effect, positive or negative, intended or individual and collective thinking, behaviours, It can be difficult to interpret the results not, generated by the actions to combat roles, attitudes, interests, points of of the evaluation, which may have very desertification. They do not necessarily match the goals defined at the outset and view…). The set of actors is heterogeneous different meanings depending on the angle also involve actors who are not directly and fluctuates over time (from local to of analysis. Assessment focusing on the targeted by these actions; they are often international). Centres of influence shift and evolution of natural resources, for instance, viewed in the long term. multiply, contradict one another. New actors may conclude that a project has failed (or had Evaluation : to assess or judge the value emerge. This complexity is difficult to grasp negative impacts) while evaluation focusing or interest of something (IFAD, n.d.). through indicators, which by nature, should on the economic impact may conclude that it Systematic review (one that is as objective as possible) of a project that is planned, simplify it. was a success (positive impacts). Moreover, in progress or completed. Depending some impacts are unexpected. on the subject analysed and the time of The context of projects to combat evaluation, different types of evaluation desertification is constantly evolving. Natural There are difficulties associated with the exist: ex ante, interim, final, ex post. biological systems, subject to environmental availability and quality of the data required changes and anthropic pressure, evolve. for the evaluation. In particular, the lack The social changes that accompany projects of documented benchmarks is a common The diversity of projects and actions to take place at unpredictable rates. Another problem in evaluating projects to combat combat desertification (objectives, scales, aspect to take into account is the evolution desertification. It underlines the importance contexts, actors...) imposes the need for of institutional means and of those engaged of conducting an ex-ante evaluation of the appropriate methods to evaluate impact. in combating desertification, which also have project (initial situation) and of defining The impacts directly or indirectly attributable local impacts. a baseline (“without project” situation) to the project also vary (technical, social, to assess the changes and measure the economic, ecological, etc.). This diversity The spatiotemporal scales of evaluation impacts. means that no single, remote, a posteriori are hard to define. Desertification is the method of evaluation can be established, nor result of complex, interactive mechanisms can any one list of indicators be applicable in and processes, driven by a combination all cases. of factors acting at different spatial levels © Krishna Naudin
- 3. Edmond Hien © IRD © Bernard Toutain Elements of methodology Define an initial situation to be able Evaluation of projects to combat The assessment of impacts attributed to to compare “before project” and “after desertification thus requires appropriate the intervention must be solidly argued, project” situations. This implies repeating methodologies and approaches involving based on the analysis of the various comparable surveys over time, before and different components (human, economic, beneficiaries of the action and the after the project. financial, ecological, as well as the practices, stakeholders of the intervention. It must techniques and methods implemented…). also be founded on the independent Define a baseline “without project” observations of assessors, based on situation to compare the “with project” The aspects of land tenure and access reading the changes in impact indicators situation at a given time and measure to resources must be integrated into the between the initial situation and the its impacts. This requires a survey of evaluations. Property rights and rights of situation at the time of the evaluation. two analogous samples of individuals or access to resources affect the way the latter The assessment process helps to communities in the same area (control and are used. One can understand the reasons clarify the actors’ roles and interests, beneficiaries). Failing this, a model or a set of for the inefficiency of certain operations to linking evaluation with the process assumptions based on “experts’ statements” combat desertification when we examine the of decentralization. More generally, is drawn up describing the likely evolution of effects of property rights on the behaviours decentralized evaluation is a powerful the initial situation without the project. of the actors (e.g. a process of extensive self-training tool, building the capacity of clearing may be for the purposes of securing local actors to manage local resources The evaluation must be contextualized. land). in their territory. In addition, by providing The context has an influence on the tangible evidence of impact, evaluation impacts of action to combat desertification, Evaluations must take account of the provides an opportunity for actors engaged particularly their sustainability. different local actors involved in combating in combating desertification to form their Contextualizing consists of characterizing the desertification when designing the system own opinions. area where the assessed project takes place. of evaluation (including the choice of An evaluation will be all the more relevant indicators), collecting data and analysing The cost of evaluation must be taken into and informative to stakeholders if it is placed results. In fact: account. The choice of evaluation method in context, including the legal, political A project is a collective effort. and indicators will depend, among other and institutional context. Contextualized Each institutional actor has a share of things, on availability of data, budget and evaluation does not allow for aggregation, responsibility in implementing and making the time allocated. Simple, inexpensive tools extrapolation and comparison over time and their own assessment of the phenomena, and methods need to be developed with space as the context is constantly changing. dynamics and transformations brought local management actors. Data gathering Thus, each evaluation must correspond to about by the project. At the intervention is more effective when the indicators are a characterization step of the context of the planning stage, shared points of reference set up by those who actually provide the project. must be defined by consensus in relation data. Therefore sufficient resources must to the initial situation and to the desired be available and the appropriate means and The approaches used must be holistic, outcome situation. skills implemented through local capacity multidisciplinary, intersectorial and Impact analysis is based on reading building (farmers, shepherds, etc.). systemic. The causes of desertification and interpreting a number of indicators are complex and must be sought beyond that are parameters agreed upon by the the technical field: poverty, land tenure different actors. They must provide a insecurity, incoherent sectorial policies, etc. concrete description of a state that has The fight against desertification must be been reached (how, how much, when, who, approached from all aspects. where).
- 4. The impact indicators selected by the CSFD There is no universal list of local impact It should be emphasized that the list of local the natural capital, human capital and social indicators (or evaluation method), however impact indicators proposed by the CSFD is an capital of a given area and the evolution of the list must integrate different components: indicative list. The assumption made is that these constitutive parameters of sustainable human, economic, financial, practices, a few, simple indicators can be combined to development. techniques and methods of implementation. help understand certain changes in human This is why the CSFD has defined four main and natural environments under the impact types of indicators that combine all the of projects to combat desertification. These possible impacts. indicators can be very useful in assessing Four types of local impact indicators 1. Biophysical indicators are used to qualify and 3. Economic and financial indicators are used to farmers and livestock breeders, breeders and quantify the status of natural capital (water, measure investments, funding sources, rates technical services. This includes quantitative soil, vegetation). of return etc. and qualitative information about how civil 2. Quantitative indicators of production are used 4. Institutional and social indicators are used society is organized and decentralization; to measure the result of the actions of a project to provide qualitative information about the issues of poverty and wellbeing are also in terms of agricultural production, livestock nature and existence of local agreements addressed (schooling, health…). breeding and forestry products. and contracts between development actors: TYPES OF INDICATOR 1. Biophysical 2. Quantitative production 3. Economic and financial 4. Institutional and social INDICATORS 2-1. Precipitation efficiency 1-1. Plant cover rate 3-1. Average income per family 4-1. Wellbeing indicator coefficient for production 1-2. Land cover 2-2. Crop yield 3-2. Income per worker 4-2. Schooling rate 2-3. Total agricultural area per 4-3. Agricultural activity rate 1-3. Herbaceous phytomass 3-3. Income per inhabitant inhabitant (sensu lato) 4-4. Non-agricultural activity rate 1-4. Total phytomass 2-4. Per-hectare fertilizer rate 3-4. Farm net income (current year) (business, craftwork, etc.) 3-5. Farm needs fulfilment rate 1-5. Tree and shrub density 2-5. Number of seedlings planted (agricultural, livestock production, 4-5. Overall activity rate general) 4-6. Agricultural product self- 2-6. Managed area according to 3-6. Natural environment 1-6. Vegetation type consumption rate (agriculture, initial objective (zai, compost, etc.) restoration investments livestock production, general) 2-7. Number of hectares 4-7. Share of migrant worker 1-7. Soil water retention capacity rehabilitated for cropping, grazing 3-7. Agricultural investments income in household budget or woodland 3-8. Livestock production 4-8. Share of migrant worker 1-8. Soil organic carbon content 2-8. Number of reforested hectares investments income invested in agriculture 2-9. Woodland recovery rate after 3-9. Non-agricultural equipment 4-9. Land ownership 1-9. Soil N,P,K content 3 years rate (all services combined) and usage rights 3-10. Cost/benefit ratio of 1-10. Surface crusting rate 2-10. Dune fixation rate investments in the natural 4-10. Migratory flows environment 3-11. Cost/benefit ratio of 4-11. Temporary economic 1-11. Sand encroachment rate 2-11. Watering place density agricultural investments migratory flows 4-12. Number of local agreements 1-12. Indicator of soil surface between development stakeholders changes (structure and texture) 2-12. Livestock productivity 3-12. Economic rate of return (farmers, livestock farmers, under wind erosion effects technical services) 1-13. Runoff index 2-13. Livestock density 4-13. Number of civil society 3-13. Farm size Percentage runoff (domesticated livestock) organizations 1-14. Soil erosion rate: 2-14. Carrying capacity 3-14. Land use 4-14. Decentralization rate erodibility, erosivity 1-15. Soil salinity rate 2-15. Actual carrying capacity 4-15. Poverty rate 4-16. Percentage of total population 2-16. Herd composition 1-16. Water salinity rate with access to drinking water– per animal species Rural and urban areas 1-17. Soil fauna 2-17. Herd growth rate 4-17. Water availability (per capita) 1-18. Biodiversity integrity index 2-18. Fodder supplementation 4-18. Dynamic landscape index 1-19. Composite land degradation index For further information: www.csf-desertification.org/index.php/activites-du-csfd/recherche-et-developpement/les-indicateurs/indicateurs-impact www.csf-desertification.org/index.php/activites-du-csfd/recherche-et-developpement/seminaire-2011-evaluation