Government Spending and Revenue, 1792-2009
•Télécharger en tant que XLSX, PDF•
1 j'aime•774 vues

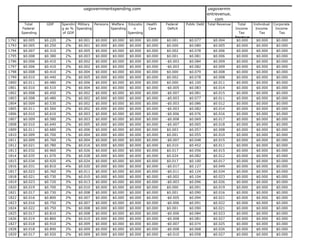
The document shows US government spending, revenue, and debt data from 1792 to 1843. It includes total federal spending and revenue amounts, spending as a percentage of GDP, and breakdowns of spending on items like military, pensions, welfare, and education. Federal deficits are also listed along with total public debt each year. All dollar amounts are in billions and most spending was between 1-4% of GDP during this time period according to the data presented.

Recommandé
Contenu connexe
Tendances
Tendances (20)
En vedette
En vedette (20)
Similaire à Government Spending and Revenue, 1792-2009
Similaire à Government Spending and Revenue, 1792-2009 (20)
Plus de Dan Ewert
Plus de Dan Ewert (18)
Dernier
Dernier (20)
Government Spending and Revenue, 1792-2009
- 1. usgovernmentspending.com usgovernm entrevenue. com Total GDP Spendin Military Pensions Welfare Educatio Health Federal Public Debt Total Revenue Total Individual Corporate Federal g as % Spending Spending n Care Deficit Income Income Income Spending of GDP Spending Tax Tax Tax Revenue 1792 $0.005 $0.220 2% $0.001 $0.000 $0.000 $0.000 $0.000 $0.001 $0.077 $0.004 $0.000 $0.000 $0.000 1793 $0.005 $0.250 2% $0.001 $0.000 $0.000 $0.000 $0.000 $0.000 $0.080 $0.005 $0.000 $0.000 $0.000 1794 $0.007 $0.310 2% $0.005 $0.000 $0.000 $0.000 $0.000 $0.002 $0.078 $0.006 $0.000 $0.000 $0.000 1795 $0.008 $0.380 2% $0.003 $0.000 $0.000 $0.000 $0.000 $0.001 $0.081 $0.006 $0.000 $0.000 $0.000 1796 $0.006 $0.410 1% $0.002 $0.000 $0.000 $0.000 $0.000 -$0.003 $0.084 $0.009 $0.000 $0.000 $0.000 1797 $0.006 $0.410 2% $0.002 $0.000 $0.000 $0.000 $0.000 -$0.003 $0.082 $0.009 $0.000 $0.000 $0.000 1798 $0.008 $0.410 2% $0.004 $0.000 $0.000 $0.000 $0.000 $0.000 $0.079 $0.008 $0.000 $0.000 $0.000 1799 $0.010 $0.440 2% $0.005 $0.000 $0.000 $0.000 $0.000 $0.002 $0.078 $0.008 $0.000 $0.000 $0.000 1800 $0.011 $0.480 2% $0.006 $0.000 $0.000 $0.000 $0.000 $0.000 $0.100 $0.011 $0.000 $0.000 $0.000 1801 $0.010 $0.510 2% $0.004 $0.000 $0.000 $0.000 $0.000 -$0.005 $0.083 $0.014 $0.000 $0.000 $0.000 1802 $0.008 $0.450 2% $0.002 $0.000 $0.000 $0.000 $0.000 -$0.007 $0.081 $0.015 $0.000 $0.000 $0.000 1803 $0.008 $0.480 2% $0.002 $0.000 $0.000 $0.000 $0.000 -$0.003 $0.077 $0.011 $0.000 $0.000 $0.000 1804 $0.009 $0.530 2% $0.002 $0.000 $0.000 $0.000 $0.000 -$0.003 $0.086 $0.012 $0.000 $0.000 $0.000 1805 $0.011 $0.560 2% $0.002 $0.000 $0.000 $0.000 $0.000 -$0.003 $0.082 $0.014 $0.000 $0.000 $0.000 1806 $0.010 $0.610 2% $0.003 $0.000 $0.000 $0.000 $0.000 -$0.006 $0.076 $0.016 $0.000 $0.000 $0.000 1807 $0.009 $0.580 2% $0.003 $0.000 $0.000 $0.000 $0.000 -$0.008 $0.069 $0.017 $0.000 $0.000 $0.000 1808 $0.010 $0.640 2% $0.005 $0.000 $0.000 $0.000 $0.000 -$0.007 $0.065 $0.018 $0.000 $0.000 $0.000 1809 $0.011 $0.680 2% $0.006 $0.000 $0.000 $0.000 $0.000 $0.003 $0.057 $0.008 $0.000 $0.000 $0.000 1810 $0.009 $0.700 1% $0.004 $0.000 $0.000 $0.000 $0.000 $0.001 $0.055 $0.010 $0.000 $0.000 $0.000 1811 $0.009 $0.760 1% $0.004 $0.000 $0.000 $0.000 $0.000 -$0.007 $0.048 $0.015 $0.000 $0.000 $0.000 1812 $0.021 $0.780 3% $0.016 $0.000 $0.000 $0.000 $0.000 $0.010 $0.452 $0.011 $0.000 $0.000 $0.000 1813 $0.032 $0.960 3% $0.026 $0.000 $0.000 $0.000 $0.000 $0.017 $0.056 $0.015 $0.000 $0.000 $0.000 1814 $0.035 $1.070 3% $0.028 $0.000 $0.000 $0.000 $0.000 $0.024 $0.082 $0.012 $0.000 $0.000 $0.000 1815 $0.034 $0.920 4% $0.024 $0.000 $0.000 $0.000 $0.000 $0.017 $0.100 $0.017 $0.000 $0.000 $0.000 1816 $0.031 $0.810 4% $0.020 $0.000 $0.000 $0.000 $0.000 -$0.017 $0.127 $0.049 $0.000 $0.000 $0.000 1817 $0.023 $0.760 3% $0.011 $0.000 $0.000 $0.000 $0.000 -$0.011 $0.124 $0.034 $0.000 $0.000 $0.000 1818 $0.021 $0.730 3% $0.010 $0.000 $0.000 $0.000 $0.000 -$0.002 $0.104 $0.023 $0.000 $0.000 $0.000 1819 $0.023 $0.720 3% $0.013 $0.000 $0.000 $0.000 $0.000 -$0.003 $0.096 $0.026 $0.000 $0.000 $0.000 1820 $0.019 $0.700 3% $0.010 $0.000 $0.000 $0.000 $0.000 $0.000 $0.091 $0.019 $0.000 $0.000 $0.000 1821 $0.017 $0.730 2% $0.008 $0.000 $0.000 $0.000 $0.000 $0.001 $0.090 $0.016 $0.000 $0.000 $0.000 1822 $0.016 $0.800 2% $0.007 $0.000 $0.000 $0.000 $0.000 -$0.005 $0.094 $0.021 $0.000 $0.000 $0.000 1823 $0.016 $0.750 2% $0.007 $0.000 $0.000 $0.000 $0.000 -$0.006 $0.091 $0.022 $0.000 $0.000 $0.000 1824 $0.022 $0.750 3% $0.008 $0.000 $0.000 $0.000 $0.000 $0.001 $0.090 $0.021 $0.000 $0.000 $0.000 1825 $0.017 $0.810 2% $0.008 $0.000 $0.000 $0.000 $0.000 -$0.006 $0.084 $0.023 $0.000 $0.000 $0.000 1826 $0.019 $0.860 2% $0.010 $0.000 $0.000 $0.000 $0.000 -$0.008 $0.081 $0.027 $0.000 $0.000 $0.000 1827 $0.018 $0.910 2% $0.009 $0.000 $0.000 $0.000 $0.000 -$0.007 $0.074 $0.025 $0.000 $0.000 $0.000 1828 $0.018 $0.890 2% $0.009 $0.000 $0.000 $0.000 $0.000 -$0.008 $0.068 $0.026 $0.000 $0.000 $0.000 1829 $0.017 $0.920 2% $0.009 $0.000 $0.000 $0.000 $0.000 -$0.010 $0.058 $0.027 $0.000 $0.000 $0.000
- 2. 1830 $0.017 $1.010 2% $0.009 $0.000 $0.000 $0.000 $0.000 -$0.010 $0.049 $0.027 $0.000 $0.000 $0.000 1831 $0.017 $1.040 2% $0.010 $0.000 $0.000 $0.000 $0.000 -$0.013 $0.039 $0.031 $0.000 $0.000 $0.000 1832 $0.020 $1.120 2% $0.011 $0.000 $0.000 $0.000 $0.000 -$0.015 $0.024 $0.034 $0.000 $0.000 $0.000 1833 $0.026 $1.150 2% $0.015 $0.000 $0.000 $0.000 $0.000 -$0.011 $0.007 $0.037 $0.000 $0.000 $0.000 1834 $0.022 $1.120 2% $0.012 $0.000 $0.000 $0.000 $0.000 -$0.003 $0.005 $0.025 $0.000 $0.000 $0.000 1835 $0.020 $1.330 2% $0.012 $0.000 $0.000 $0.000 $0.000 -$0.018 $0.000 $0.038 $0.000 $0.000 $0.000 1836 $0.034 $1.460 2% $0.021 $0.000 $0.000 $0.000 $0.000 -$0.021 $0.000 $0.054 $0.000 $0.000 $0.000 1837 $0.042 $1.540 3% $0.023 $0.000 $0.000 $0.000 $0.000 $0.013 $0.000 $0.029 $0.000 $0.000 $0.000 1838 $0.038 $1.580 2% $0.021 $0.000 $0.000 $0.000 $0.000 $0.008 $0.003 $0.031 $0.000 $0.000 $0.000 1839 $0.032 $1.650 2% $0.018 $0.000 $0.000 $0.000 $0.000 -$0.004 $0.104 $0.036 $0.000 $0.000 $0.000 1840 $0.029 $1.560 2% $0.016 $0.000 $0.000 $0.000 $0.000 $0.005 $0.004 $0.024 $0.000 $0.000 $0.000 1841 $0.031 $1.640 2% $0.017 $0.000 $0.000 $0.000 $0.000 $0.010 $0.005 $0.021 $0.000 $0.000 $0.000 1842 $0.030 $1.600 2% $0.016 $0.000 $0.000 $0.000 $0.000 $0.005 $0.014 $0.025 $0.000 $0.000 $0.000 1843 $0.016 $1.550 1% $0.008 $0.000 $0.000 $0.000 $0.000 $0.004 $0.033 $0.013 $0.000 $0.000 $0.000 1844 $0.027 $1.690 2% $0.014 $0.000 $0.000 $0.000 $0.000 -$0.007 $0.024 $0.034 $0.000 $0.000 $0.000 1845 $0.027 $1.840 1% $0.014 $0.000 $0.000 $0.000 $0.000 -$0.007 $0.016 $0.034 $0.000 $0.000 $0.000 1846 $0.032 $2.040 2% $0.019 $0.000 $0.000 $0.000 $0.000 -$0.001 $0.016 $0.033 $0.000 $0.000 $0.000 1847 $0.061 $2.390 3% $0.048 $0.000 $0.000 $0.000 $0.000 $0.031 $0.039 $0.031 $0.000 $0.000 $0.000 1848 $0.050 $2.400 2% $0.036 $0.000 $0.000 $0.000 $0.000 $0.009 $0.047 $0.040 $0.000 $0.000 $0.000 1849 $0.050 $2.400 2% $0.026 $0.000 $0.000 $0.000 $0.000 $0.014 $0.063 $0.036 $0.000 $0.000 $0.000 1850 $0.045 $2.560 2% $0.019 $0.000 $0.000 $0.000 $0.000 -$0.004 $0.064 $0.049 $0.000 $0.000 $0.000 1851 $0.054 $2.700 2% $0.023 $0.000 $0.000 $0.000 $0.000 -$0.005 $0.068 $0.059 $0.000 $0.000 $0.000 1852 $0.051 $3.040 2% $0.020 $0.000 $0.000 $0.000 $0.000 -$0.004 $0.066 $0.055 $0.000 $0.000 $0.000 1853 $0.056 $3.280 2% $0.023 $0.000 $0.000 $0.000 $0.000 -$0.011 $0.060 $0.067 $0.000 $0.000 $0.000 1854 $0.067 $3.680 2% $0.024 $0.000 $0.000 $0.000 $0.000 -$0.013 $0.042 $0.080 $0.000 $0.000 $0.000 1855 $0.070 $3.940 2% $0.030 $0.000 $0.000 $0.000 $0.000 -$0.002 $0.036 $0.072 $0.000 $0.000 $0.000 1856 $0.080 $4.010 2% $0.032 $0.000 $0.000 $0.000 $0.000 -$0.001 $0.032 $0.081 $0.000 $0.000 $0.000 1857 $0.079 $4.140 2% $0.033 $0.000 $0.000 $0.000 $0.000 $0.003 $0.029 $0.076 $0.000 $0.000 $0.000 1858 $0.087 $4.050 2% $0.041 $0.000 $0.000 $0.000 $0.000 $0.033 $0.045 $0.054 $0.000 $0.000 $0.000 1859 $0.085 $4.380 2% $0.039 $0.000 $0.000 $0.000 $0.000 $0.023 $0.059 $0.062 $0.000 $0.000 $0.000 1860 $0.078 $4.350 2% $0.029 $0.000 $0.000 $0.000 $0.000 $0.013 $0.065 $0.065 $0.000 $0.000 $0.000 1861 $0.080 $4.600 2% $0.036 $0.000 $0.000 $0.000 $0.000 $0.030 $0.091 $0.050 $0.000 $0.000 $0.000 1862 $0.486 $5.799 8% $0.438 $0.000 $0.000 $0.000 $0.000 $0.426 $0.524 $0.060 $0.000 $0.000 $0.000 1863 $0.726 $7.620 10% $0.664 $0.000 $0.000 $0.000 $0.000 $0.660 $1.120 $0.124 $0.000 $0.000 $0.000 1864 $0.878 $9.460 9% $0.782 $0.000 $0.000 $0.000 $0.000 $0.601 $1.816 $0.277 $0.000 $0.000 $0.000 1865 $1.300 $9.880 13% $1.200 $0.000 $0.000 $0.000 $0.000 $0.963 $2.700 $0.348 $0.000 $0.000 $0.000 1866 $0.536 $8.990 6% $0.343 $0.000 $0.000 $0.000 $0.000 -$0.036 $2.773 $0.572 $0.000 $0.000 $0.000 1867 $0.376 $8.340 5% $0.147 $0.000 $0.000 $0.000 $0.000 -$0.129 $2.678 $0.506 $0.000 $0.000 $0.000 1868 $0.400 $8.150 5% $0.173 $0.000 $0.000 $0.000 $0.000 -$0.022 $2.612 $0.422 $0.000 $0.000 $0.000 1869 $0.347 $7.850 4% $0.127 $0.000 $0.000 $0.000 $0.000 -$0.042 $2.589 $0.388 $0.000 $0.000 $0.000 1870 $0.334 $7.740 4% $0.108 $0.000 $0.000 $0.000 $0.000 -$0.097 $2.481 $0.430 $0.000 $0.000 $0.000 1871 $0.317 $7.590 4% $0.090 $0.000 $0.000 $0.000 $0.000 -$0.087 $2.353 $0.403 $0.000 $0.000 $0.000 1872 $0.304 $8.230 4% $0.085 $0.000 $0.000 $0.000 $0.000 -$0.092 $2.253 $0.396 $0.000 $0.000 $0.000 1873 $0.319 $8.750 4% $0.099 $0.000 $0.000 $0.000 $0.000 -$0.037 $2.235 $0.357 $0.000 $0.000 $0.000
- 3. 1874 $0.335 $8.480 4% $0.102 $0.000 $0.000 $0.000 $0.000 $0.003 $2.252 $0.332 $0.000 $0.000 $0.000 1875 $0.308 $8.160 4% $0.092 $0.000 $0.000 $0.000 $0.000 -$0.007 $2.232 $0.315 $0.000 $0.000 $0.000 1876 $0.298 $8.311 4% $0.085 $0.000 $0.000 $0.000 $0.000 -$0.024 $2.180 $0.323 $0.000 $0.000 $0.000 1877 $0.275 $8.520 3% $0.080 $0.000 $0.000 $0.000 $0.000 -$0.034 $2.205 $0.309 $0.000 $0.000 $0.000 1878 $0.271 $8.380 3% $0.077 $0.000 $0.000 $0.000 $0.000 -$0.016 $2.256 $0.287 $0.000 $0.000 $0.000 1879 $0.300 $9.360 3% $0.091 $0.000 $0.000 $0.000 $0.000 -$0.004 $2.350 $0.304 $0.000 $0.000 $0.000 1880 $0.304 $10.400 3% $0.108 $0.000 $0.000 $0.000 $0.000 -$0.063 $2.120 $0.367 $0.000 $0.000 $0.000 1881 $0.300 $11.600 3% $0.106 $0.000 $0.000 $0.000 $0.000 -$0.097 $2.069 $0.398 $0.000 $0.000 $0.000 1882 $0.299 $12.200 2% $0.120 $0.000 $0.000 $0.000 $0.000 -$0.147 $1.918 $0.445 $0.000 $0.000 $0.000 1883 $0.309 $12.300 3% $0.130 $0.000 $0.000 $0.000 $0.000 -$0.135 $1.884 $0.444 $0.000 $0.000 $0.000 1884 $0.291 $11.800 2% $0.112 $0.000 $0.000 $0.000 $0.000 -$0.101 $1.831 $0.392 $0.000 $0.000 $0.000 1885 $0.310 $11.600 3% $0.115 $0.000 $0.000 $0.000 $0.000 -$0.056 $1.864 $0.366 $0.000 $0.000 $0.000 1886 $0.294 $12.200 2% $0.112 $0.000 $0.000 $0.000 $0.000 -$0.087 $1.775 $0.380 $0.000 $0.000 $0.000 1887 $0.321 $13.100 2% $0.129 $0.000 $0.000 $0.000 $0.000 -$0.099 $1.658 $0.420 $0.000 $0.000 $0.000 1888 $0.324 $13.900 2% $0.136 $0.000 $0.000 $0.000 $0.000 -$0.108 $1.693 $0.432 $0.000 $0.000 $0.000 1889 $0.362 $13.900 3% $0.153 $0.000 $0.000 $0.000 $0.000 -$0.082 $1.619 $0.443 $0.000 $0.000 $0.000 1890 $0.384 $15.100 3% $0.174 $0.000 $0.000 $0.000 $0.000 -$0.080 $1.552 $0.464 $0.000 $0.000 $0.000 1891 $0.439 $15.400 3% $0.199 $0.000 $0.000 $0.000 $0.000 -$0.020 $1.546 $0.459 $0.000 $0.000 $0.000 1892 $0.422 $16.400 3% $0.211 $0.000 $0.000 $0.000 $0.000 -$0.004 $1.589 $0.426 $0.000 $0.000 $0.000 1893 $0.465 $15.400 3% $0.239 $0.000 $0.000 $0.000 $0.000 $0.003 $1.546 $0.462 $0.000 $0.000 $0.000 1894 $0.453 $14.100 3% $0.227 $0.000 $0.000 $0.000 $0.000 $0.071 $1.632 $0.381 $0.000 $0.000 $0.000 1895 $0.443 $15.600 3% $0.222 $0.000 $0.000 $0.000 $0.000 $0.042 $1.676 $0.402 $0.000 $0.000 $0.000 1896 $0.443 $15.500 3% $0.217 $0.000 $0.000 $0.000 $0.000 $0.023 $1.770 $0.421 $0.000 $0.000 $0.000 1897 $0.460 $16.200 3% $0.225 $0.000 $0.000 $0.000 $0.000 $0.030 $1.818 $0.430 $0.000 $0.000 $0.000 1898 $0.541 $18.100 3% $0.298 $0.000 $0.000 $0.000 $0.000 $0.047 $1.797 $0.494 $0.000 $0.000 $0.000 1899 $0.707 $19.500 4% $0.043 $0.000 $0.000 $0.000 $0.000 $0.096 $1.992 $0.611 $0.000 $0.000 $0.000 1900 $0.629 $20.600 3% $0.332 $0.000 $0.000 $0.000 $0.000 -$0.041 $2.137 $0.670 $0.000 $0.000 $0.000 1901 $0.640 $22.300 3% $0.344 $0.000 $0.000 $0.000 $0.000 -$0.059 $2.143 $0.699 $0.000 $0.000 $0.000 1902 $0.572 $24.100 2% $0.306 $0.000 $0.005 $0.004 $0.003 -$0.081 $2.159 $0.653 $0.000 $0.000 $0.000 1903 $0.600 $25.900 2% $0.315 $0.000 $0.005 $0.004 $0.003 -$0.062 $2.203 $0.662 $0.000 $0.000 $0.000 1904 $0.630 $25.700 2% $0.325 $0.000 $0.003 $0.005 $0.003 -$0.016 $2.264 $0.646 $0.000 $0.000 $0.000 1905 $0.661 $28.800 2% $0.335 $0.000 $0.006 $0.005 $0.003 $0.003 $2.275 $0.658 $0.000 $0.000 $0.000 1906 $0.693 $31.000 2% $0.345 $0.000 $0.006 $0.005 $0.003 -$0.037 $2.337 $0.730 $0.000 $0.000 $0.000 1907 $0.727 $33.900 2% $0.356 $0.000 $0.006 $0.005 $0.003 -$0.101 $2.457 $0.828 $0.000 $0.000 $0.000 1908 $0.763 $30.100 3% $0.367 $0.000 $0.006 $0.006 $0.004 $0.005 $2.627 $0.758 $0.000 $0.000 $0.000 1909 $0.801 $32.200 2% $0.378 $0.000 $0.006 $0.006 $0.004 $0.030 $2.640 $0.771 $0.000 $0.000 $0.000 1910 $0.840 $33.400 3% $0.390 $0.000 $0.006 $0.007 $0.004 -$0.035 $2.653 $0.875 $0.000 $0.000 $0.000 1911 $0.881 $34.300 3% $0.402 $0.000 $0.007 $0.007 $0.004 -$0.040 $2.766 $0.921 $0.000 $0.000 $0.000 1912 $0.925 $37.400 2% $0.414 $0.000 $0.007 $0.008 $0.005 $0.004 $2.868 $0.921 $0.000 $0.000 $0.000 1913 $0.970 $39.100 2% $0.427 $0.000 $0.007 $0.008 $0.005 $0.008 $2.916 $0.962 $0.035 $0.000 $0.035 1914 $1.004 $36.500 3% $0.460 $0.000 $0.007 $0.009 $0.006 $0.073 $2.913 $0.931 $0.041 $0.000 $0.041 1915 $1.050 $38.700 3% $0.478 $0.000 $0.007 $0.009 $0.008 $0.215 $3.058 $0.835 $0.047 $0.000 $0.047 1916 $1.041 $49.600 2% $0.497 $0.000 $0.008 $0.010 $0.009 $0.154 $3.609 $0.887 $0.121 $0.066 $0.055 1917 $2.306 $59.700 4% $0.805 $0.000 $0.008 $0.011 $0.012 $1.084 $5.718 $1.222 $0.373 $0.174 $0.199
- 4. 1918 $13.054 $75.800 17% $6.366 $0.000 $0.008 $0.011 $0.017 $9.008 $14.592 $4.046 $2.720 $1.272 $1.448 1919 $18.894 $78.300 24% $11.260 $0.000 $0.009 $0.012 $0.026 $13.200 $27.391 $5.694 $2.684 $1.260 $1.424 1920 $6.783 $88.400 8% $2.640 $0.000 $0.009 $0.013 $0.038 -$0.597 $25.953 $7.380 $4.032 $1.900 $2.132 1921 $5.511 $73.600 7% $2.089 $0.000 $0.009 $0.013 $0.058 -$0.673 $23.977 $6.184 $3.405 $1.611 $1.794 1922 $3.763 $73.400 5% $1.303 $0.006 $0.011 $0.015 $0.094 -$0.498 $22.963 $4.261 $2.232 $1.060 $1.172 1923 $3.715 $85.400 4% $1.270 $0.007 $0.011 $0.015 $0.089 -$0.565 $22.350 $4.280 $1.685 $0.803 $0.882 1924 $3.669 $86.900 4% $1.245 $0.008 $0.011 $0.016 $0.085 -$0.633 $21.251 $4.302 $1.785 $0.854 $0.931 1925 $3.623 $90.600 4% $1.227 $0.009 $0.011 $0.016 $0.082 -$0.425 $20.516 $4.048 $1.697 $0.815 $0.882 1926 $3.577 $96.900 4% $1.215 $0.011 $0.011 $0.017 $0.078 -$0.646 $19.643 $4.223 $1.902 $0.848 $1.054 1927 $3.533 $95.500 4% $1.211 $0.014 $0.012 $0.018 $0.076 -$0.936 $18.512 $4.469 $2.138 $0.879 $1.259 1928 $3.668 $97.400 4% $1.288 $0.016 $0.007 $0.019 $0.083 -$0.661 $17.604 $4.329 $2.088 $0.848 $1.240 1929 $3.809 $103.600 4% $1.372 $0.018 $0.004 $0.020 $0.093 -$0.478 $16.931 $4.287 $2.233 $1.050 $1.183 1930 $3.956 $91.200 4% $1.463 $0.021 $0.003 $0.022 $0.103 -$0.874 $16.185 $4.830 $2.301 $1.095 $1.206 1931 $4.108 $76.500 5% $1.563 $0.024 $0.002 $0.024 $0.114 $0.129 $16.801 $3.979 $1.771 $0.794 $0.977 1932 $4.266 $58.700 7% $1.672 $0.028 $0.002 $0.026 $0.127 $1.632 $19.487 $2.634 $1.048 $0.450 $0.598 1933 $5.103 $56.400 9% $1.376 $0.033 $0.294 $0.130 $0.122 $1.843 $22.539 $3.260 $0.897 $0.405 $0.492 1934 $5.941 $66.000 9% $1.082 $0.039 $0.589 $0.235 $0.117 $2.055 $27.053 $3.886 $0.791 $0.405 $0.386 1935 $7.553 $73.300 10% $1.866 $0.016 $0.561 $0.285 $0.120 $3.022 $27.701 $4.531 $1.102 $0.536 $0.566 1936 $9.165 $83.800 11% $2.653 $0.044 $0.534 $0.335 $0.125 $3.989 $33.779 $5.176 $1.411 $0.666 $0.745 1937 $8.807 $91.900 10% $2.152 $0.056 $0.533 $0.304 $0.126 $2.606 $36.425 $6.201 $2.011 $0.972 $1.039 1938 $8.449 $86.100 10% $1.653 $0.069 $0.534 $0.274 $0.127 $1.223 $37.165 $7.226 $2.610 $1.277 $1.333 1939 $9.255 $92.200 10% $1.905 $0.076 $0.541 $0.308 $0.124 $2.142 $40.440 $7.113 $2.346 $1.118 $1.228 1940 $10.061 $101.400 10% $2.159 $0.085 $0.600 $0.343 $0.123 $3.061 $42.968 $7.000 $2.082 $0.959 $1.123 1941 $14.160 $126.700 11% $7.242 $0.136 $0.754 $0.264 $0.123 $4.722 $48.961 $9.438 $3.467 $1.277 $2.190 1942 $35.549 $161.900 22% $27.081 $0.188 $0.910 $0.186 $0.123 $19.487 $72.423 $16.062 $7.932 $3.205 $4.727 1943 $82.980 $198.600 42% $70.442 $0.237 $0.956 $0.195 $0.161 $55.709 $136.696 $27.271 $16.145 $6.564 $9.581 1944 $100.520 $219.800 46% $86.097 $0.288 $1.002 $0.205 $0.201 $49.121 $201.003 $51.399 $34.438 $19.701 $14.737 1945 $106.876 $223.100 48% $93.743 $0.437 $0.824 $0.354 $0.262 $53.683 $258.682 $53.193 $34.417 $18.340 $16.077 1946 $66.534 $222.300 30% $53.325 $0.587 $0.649 $0.504 $0.324 $20.129 $269.422 $46.405 $27.990 $16.157 $11.833 1947 $41.402 $244.200 17% $22.825 $0.671 $0.853 $1.632 $0.514 -$3.234 $258.286 $44.636 $26.540 $17.907 $8.633 1948 $35.592 $269.200 13% $19.745 $0.756 $1.058 $2.760 $0.705 -$11.662 $252.292 $47.254 $28.983 $19.305 $9.678 1949 $40.196 $267.300 15% $21.991 $0.875 $1.340 $2.799 $0.833 -$3.960 $252.770 $44.156 $26.732 $15.561 $11.171 1950 $44.800 $293.800 15% $24.239 $0.994 $1.622 $2.839 $0.963 $1.273 $257.357 $43.527 $26.233 $15.745 $10.488 1951 $48.935 $339.300 14% $29.219 $1.768 $1.570 $2.196 $0.967 -$7.796 $255.222 $56.731 $35.749 $21.643 $14.106 1952 $71.568 $358.300 20% $51.688 $2.283 $1.510 $1.716 $1.014 -$0.230 $259.105 $71.798 $49.147 $27.921 $21.226 1953 $79.990 $379.400 21% $56.938 $3.091 $1.806 $1.235 $0.956 $5.751 $266.071 $74.239 $51.054 $29.816 $21.238 1954 $77.692 $380.400 20% $52.825 $3.687 $1.951 $1.114 $0.959 $1.857 $271.260 $75.835 $50.643 $29.542 $21.101 1955 $73.441 $414.800 18% $47.167 $4.736 $1.976 $1.323 $0.905 $1.526 $274.374 $71.915 $46.608 $28.747 $17.861 1956 $75.991 $437.500 17% $47.113 $5.868 $1.958 $1.475 $0.947 -$5.303 $272.751 $81.294 $53.068 $32.188 $20.880 1957 $81.783 $461.100 18% $51.298 $7.106 $2.103 $1.568 $1.032 -$5.283 $270.527 $87.066 $56.787 $35.620 $21.167 1958 $86.054 $467.200 18% $51.753 $8.742 $2.557 $1.770 $1.104 $0.048 $276.343 $86.006 $54.798 $34.724 $20.074 1959 $93.531 $506.600 18% $53.984 $10.180 $2.799 $1.662 $1.343 $8.072 $284.706 $85.459 $54.028 $36.719 $17.309 1960 $97.284 $526.400 18% $53.290 $11.694 $3.012 $1.635 $1.450 -$2.516 $286.331 $99.800 $62.209 $40.715 $21.494 1961 $104.863 $544.700 19% $56.989 $12.845 $3.236 $1.720 $1.595 $3.522 $288.971 $101.341 $62.292 $41.338 $20.954
- 5. 1962 $106.821 $585.600 18% $63.604 $11.722 $6.587 $1.738 $1.197 $7.145 $298.201 $99.676 $66.094 $45.571 $20.523 1963 $111.316 $617.700 18% $64.222 $13.230 $6.440 $1.992 $1.451 $4.756 $305.860 $106.560 $69.167 $47.588 $21.579 1964 $118.528 $663.600 18% $65.378 $14.164 $6.421 $2.321 $1.788 $5.915 $311.713 $112.613 $72.190 $48.697 $23.493 1965 $118.228 $719.100 16% $61.610 $15.139 $5.935 $2.929 $1.791 $1.411 $317.274 $116.817 $74.253 $48.792 $25.461 1966 $134.532 $787.800 17% $69.607 $18.462 $5.615 $5.220 $2.606 $3.697 $319.907 $130.835 $85.519 $55.446 $30.073 1967 $157.464 $832.600 19% $83.719 $19.601 $5.728 $7.350 $6.099 $8.642 $326.221 $148.822 $95.497 $61.526 $33.971 1968 $178.134 $910.000 20% $94.260 $21.999 $6.587 $8.565 $9.039 $25.161 $347.578 $152.973 $97.391 $68.726 $28.665 1969 $183.640 $948.600 19% $94.729 $25.557 $7.259 $8.486 $10.857 -$3.242 $353.720 $186.882 $123.927 $87.249 $36.678 1970 $195.649 $1,038.500 19% $94.690 $28.402 $9.078 $9.582 $12.120 $2.842 $370.919 $192.807 $123.241 $90.412 $32.829 1971 $210.172 $1,127.100 19% $92.799 $35.013 $14.749 $10.858 $13.466 $23.033 $398.130 $187.139 $113.015 $86.230 $26.785 1972 $230.681 $1,238.300 19% $94.674 $40.350 $18.155 $13.508 $16.152 $23.372 $427.260 $207.309 $126.903 $94.737 $32.166 1973 $245.707 $1,382.700 18% $92.834 $51.134 $16.779 $13.706 $17.408 $14.908 $458.142 $230.799 $139.399 $103.246 $36.153 1974 $269.359 $1,500.000 18% $98.431 $59.400 $20.179 $13.474 $20.372 $6.135 $475.060 $263.224 $157.572 $118.952 $38.620 1975 $332.332 $1,638.300 20% ##### $71.411 $32.248 $17.061 $25.805 $53.242 $533.189 $279.090 $163.007 $122.386 $40.621 1976 $371.792 $1,825.300 20% ##### $80.907 $42.067 $19.945 $31.568 $73.732 $620.433 $298.060 $173.012 $131.603 $41.409 1977 $409.218 $2,030.900 20% ##### $93.849 $39.767 $22.183 $36.647 $53.659 $698.840 $355.559 $212.518 $157.626 $54.892 1978 $458.746 $2,294.700 20% ##### ##### $38.287 $38.287 $41.292 $59.185 $771.544 $399.561 $240.940 $180.988 $59.952 1979 $504.028 $2,563.300 20% ##### ##### $39.328 $31.521 $46.989 $40.726 $826.519 $463.302 $283.518 $217.841 $65.677 1980 $590.941 $2,789.500 21% ##### ##### $54.862 $33.224 $55.260 $73.829 $907.701 $517.112 $308.669 $244.069 $64.600 1981 $678.241 $3,128.400 22% ##### ##### $63.564 $34.628 $66.016 $78.969 $997.855 $599.272 $347.054 $285.917 $61.137 1982 $745.743 $3,255.000 23% ##### ##### $68.239 $28.219 $74.012 $127.977 $1,142.030 $617.766 $346.951 $297.744 $49.207 1983 $808.364 $3,536.700 23% ##### ##### $80.920 $27.841 $81.229 $207.802 $1,377.210 $600.562 $325.960 $288.938 $37.022 1984 $851.583 $3,933.200 22% ##### ##### $69.831 $28.771 $87.958 $185.367 $1,572.270 $666.486 $355.308 $298.415 $56.893 1985 $946.396 $4,220.300 22% ##### ##### $84.742 $30.615 $99.364 $212.308 $1,823.100 $734.088 $395.862 $334.531 $61.331 1986 $990.441 $4,432.800 22% ##### ##### $73.911 $31.999 ##### $221.226 $2,125.300 $769.215 $412.102 $348.959 $63.143 1987 $1,004.080 $4,739.500 21% ##### ##### $74.741 $31.183 ##### $149.727 $2,350.280 $854.353 $476.483 $392.557 $83.926 1988 $1,064.480 $5,103.800 21% ##### ##### $78.163 $33.362 ##### $155.177 $2,602.340 $909.303 $495.689 $401.181 $94.508 1989 $1,143.830 $5,484.400 21% ##### ##### $82.573 $37.974 ##### $152.640 $2,857.430 $991.190 $548.981 $445.690 $103.291 1990 $1,253.130 $5,803.100 22% ##### ##### $91.483 $40.012 ##### $221.040 $3,233.310 $1,032.090 $560.391 $466.884 $93.507 1991 $1,324.330 $5,995.900 22% ##### ##### ##### $44.394 ##### $269.240 $3,665.300 $1,055.090 $565.913 $467.827 $98.086 1992 $1,381.650 $6,337.700 22% ##### ##### ##### $46.320 ##### $290.320 $4,064.620 $1,091.330 $576.234 $475.964 $100.270 1993 $1,409.520 $6,657.400 21% ##### ##### ##### $51.333 ##### $255.050 $4,411.490 $1,154.470 $627.200 $509.680 $117.520 1994 $1,461.910 $7,072.200 21% ##### ##### ##### $47.156 ##### $203.190 $4,692.750 $1,258.720 $683.440 $543.055 $140.385 1995 $1,515.880 $7,397.700 20% ##### ##### ##### $55.176 ##### $163.950 $4,973.980 $1,351.930 $747.248 $590.244 $157.004 1996 $1,560.610 $7,816.900 20% ##### ##### ##### $52.351 ##### $107.430 $5,224.810 $1,453.180 $828.241 $656.417 $171.824 1997 $1,601.310 $8,304.300 19% ##### ##### ##### $53.108 ##### $21.890 $5,413.150 $1,579.420 $919.759 $737.466 $182.293 1998 $1,652.680 $8,679.660 19% ##### ##### ##### $55.883 ##### -$69.280 $5,526.190 $1,721.960 ###### $828.586 $188.677 1999 $1,702.040 $9,201.140 18% ##### ##### ##### $56.302 ##### -$125.600 $5,656.270 $1,827.640 ###### $879.480 $184.680 2000 $1,789.220 $9,749.100 18% ##### ##### ##### $59.995 ##### -$236.240 $5,674.180 $2,025.460 ###### ###### $207.289 2001 $1,863.190 ####### 19% ##### ##### ##### $63.721 ##### -$128.240 $5,807.460 $1,991.430 ###### $994.339 $151.075 2002 $2,011.150 ####### 19% ##### ##### ##### $77.875 ##### $157.750 $6,228.240 $1,853.400 ###### $858.345 $148.044 2003 $2,160.120 ####### 20% ##### ##### ##### $90.561 ##### $377.590 $6,783.230 $1,782.530 $925.477 $793.699 $131.778 2004 $2,293.010 ####### 20% ##### ##### ##### $96.364 ##### $412.730 $7,379.050 $1,880.280 $998.330 $808.959 $189.371 2005 $2,472.200 ####### 20% ##### ##### ##### ##### ##### $318.340 $7,932.710 $2,153.860 ###### $927.222 $278.282
- 6. 2006 $2,655.440 ####### 20% ##### ##### ##### ##### ##### $248.190 $8,506.970 $2,407.250 ###### ###### $353.915 2007 $2,728.940 ####### 20% ##### ##### ##### ##### ##### $160.700 $9,007.650 $2,568.240 ###### ###### $370.243 2008 $2,982.880 ####### 21% ##### ##### ##### ##### ##### $458.550 $9,985.760 $2,524.330 ###### ###### $304.346 2009 $3,997.840 ####### 28% ##### ##### ##### $91.689 ##### $1,841.190 ####### $2,156.650 ###### $953.006 $146.758
- 7. Other Social Taxes Insuranc e $0.004 $0.000 $0.005 $0.000 $0.005 $0.000 $0.006 $0.000 $0.008 $0.000 $0.009 $0.000 $0.008 $0.000 $0.008 $0.000 $0.011 $0.000 $0.013 $0.000 $0.015 $0.000 $0.011 $0.000 $0.012 $0.000 $0.014 $0.000 $0.016 $0.000 $0.016 $0.000 $0.017 $0.000 $0.008 $0.000 $0.009 $0.000 $0.014 $0.000 $0.010 $0.000 $0.017 $0.000 $0.011 $0.000 $0.016 $0.000 $0.048 $0.000 $0.033 $0.000 $0.022 $0.000 $0.025 $0.000 $0.018 $0.000 $0.015 $0.000 $0.020 $0.000 $0.021 $0.000 $0.019 $0.000 $0.022 $0.000 $0.025 $0.000 $0.023 $0.000 $0.025 $0.000 $0.025 $0.000
- 8. $0.025 $0.000 $0.029 $0.000 $0.032 $0.000 $0.034 $0.000 $0.022 $0.000 $0.035 $0.000 $0.051 $0.000 $0.025 $0.000 $0.026 $0.000 $0.032 $0.000 $0.020 $0.000 $0.017 $0.000 $0.020 $0.000 $0.008 $0.000 $0.029 $0.000 $0.030 $0.000 $0.030 $0.000 $0.027 $0.000 $0.036 $0.000 $0.031 $0.000 $0.044 $0.000 $0.053 $0.000 $0.050 $0.000 $0.062 $0.000 $0.074 $0.000 $0.065 $0.000 $0.074 $0.000 $0.069 $0.000 $0.047 $0.000 $0.054 $0.000 $0.056 $0.000 $0.042 $0.000 $0.052 $0.000 $0.116 $0.000 $0.272 $0.000 $0.335 $0.000 $0.559 $0.000 $0.499 $0.000 $0.405 $0.000 $0.372 $0.000 $0.411 $0.000 $0.383 $0.000 $0.374 $0.000 $0.334 $0.000
- 9. $0.305 $0.000 $0.288 $0.000 $0.294 $0.000 $0.281 $0.000 $0.258 $0.000 $0.274 $0.000 $0.334 $0.000 $0.361 $0.000 $0.404 $0.000 $0.398 $0.000 $0.349 $0.000 $0.324 $0.000 $0.337 $0.000 $0.371 $0.000 $0.379 $0.000 $0.387 $0.000 $0.403 $0.000 $0.393 $0.000 $0.355 $0.000 $0.386 $0.000 $0.306 $0.000 $0.325 $0.000 $0.338 $0.000 $0.348 $0.000 $0.405 $0.000 $0.516 $0.000 $0.567 $0.000 $0.587 $0.000 $0.492 $0.000 $0.520 $0.000 $0.503 $0.000 $0.508 $0.000 $0.551 $0.000 $0.587 $0.000 $0.549 $0.000 $0.568 $0.000 $0.608 $0.000 $0.596 $0.000 $0.598 $0.000 $0.612 $0.000 $0.592 $0.000 $0.512 $0.000 $0.603 $0.000 $0.841 $0.000
- 10. $0.947 $0.000 $0.767 $0.000 $0.886 $0.000 $1.029 $0.000 $1.292 $0.000 $1.346 $0.000 $1.252 $0.000 $1.241 $0.000 $1.429 $0.000 $2.210 $0.025 $2.058 $0.026 $2.049 $0.028 $1.890 $0.030 $1.617 $0.031 $1.504 $0.033 $2.075 $0.031 $2.643 $0.029 $2.979 $0.031 $3.309 $0.033 $3.397 $0.303 $3.481 $0.572 $3.529 $0.662 $3.574 $0.750 $4.787 $0.959 $5.999 $1.166 $9.652 $1.535 $13.301 $1.902 $13.937 $1.893 $14.570 $1.883 $14.518 $2.214 $14.462 $2.543 $13.672 $2.786 $12.882 $3.026 $15.355 $4.086 $16.301 $4.710 $16.218 $5.123 $17.846 $5.607 $17.264 $6.144 $18.511 $7.691 $19.583 $8.191 $19.179 $9.386 $19.001 $9.691 $22.310 $12.185 $21.808 $13.708
- 11. $15.817 $17.047 $16.760 $19.805 $17.515 $21.963 $18.951 $22.243 $18.057 $25.546 $18.900 $32.618 $19.569 $33.923 $21.279 $39.015 $21.938 $44.362 $23.266 $47.324 $24.580 $52.574 $24.789 $63.114 $25.735 $75.071 $25.772 $84.534 $28.829 $90.769 $30.648 $106.486 $31.012 $120.968 $32.520 $138.939 $38.873 $157.804 $56.665 $182.719 $54.132 $201.496 $51.117 $208.994 $56.116 $239.376 $56.003 $263.771 $54.838 $282.507 $57.736 $301.903 $62.114 $332.918 $63.188 $358.010 $67.336 $378.661 $74.008 $394.588 $78.484 $412.181 $84.064 $426.886 $95.784 $460.076 $96.833 $482.955 $95.045 $507.904 $100.657 $537.760 $108.321 $570.062 $125.735 $610.318 $128.561 $651.202 $125.921 $692.353 $122.563 $699.108 $122.199 $711.358 $128.890 $731.678 $134.933 $792.289
- 12. $141.665 $835.927 $132.874 $867.655 $140.480 $898.126 $132.779 $897.255
- 13. usgovernmentspending.com usgovern Total Federal GDP Spendin Military Pensions Welfare Education Health Federal Deficit Public Debt mentreve Total Total Individual Spending g as % Spending Spending Spending Care Revenue Income Income Tax of GDP Tax Revenue 1792 $0.113 $4.889 2% $0.027 $0.000 $0.000 $0.000 $0.000 $0.031 $1.716 $0.082 $0.000 $0.000 1793 $0.109 $5.435 2% $0.026 $0.000 $0.000 $0.000 $0.000 -$0.004 $1.748 $0.104 $0.000 $0.000 1794 $0.139 $6.078 2% $0.094 $0.000 $0.000 $0.000 $0.000 $0.029 $1.537 $0.110 $0.000 $0.000 1795 $0.131 $6.441 2% $0.051 $0.000 $0.000 $0.000 $0.000 $0.024 $1.369 $0.107 $0.000 $0.000 1796 $0.095 $6.613 1% $0.026 $0.000 $0.000 $0.000 $0.000 -$0.044 $1.352 $0.139 $0.000 $0.000 1797 $0.107 $6.949 2% $0.025 $0.000 $0.000 $0.000 $0.000 -$0.044 $1.392 $0.151 $0.000 $0.000 1798 $0.136 $7.069 2% $0.060 $0.000 $0.000 $0.000 $0.000 -$0.005 $1.366 $0.140 $0.000 $0.000 1799 $0.171 $7.586 2% $0.093 $0.000 $0.000 $0.000 $0.000 $0.034 $1.342 $0.134 $0.000 $0.000 1800 $0.186 $8.136 2% $0.102 $0.000 $0.000 $0.000 $0.000 -$0.002 $1.695 $0.188 $0.000 $0.000 1801 $0.164 $8.644 2% $0.066 $0.000 $0.000 $0.000 $0.000 -$0.078 $1.407 $0.242 $0.000 $0.000 1802 $0.162 $9.000 2% $0.044 $0.000 $0.000 $0.000 $0.000 -$0.144 $1.614 $0.306 $0.000 $0.000 1803 $0.155 $9.057 2% $0.040 $0.000 $0.000 $0.000 $0.000 -$0.060 $1.455 $0.215 $0.000 $0.000 1804 $0.165 $9.636 2% $0.038 $0.000 $0.000 $0.000 $0.000 -$0.058 $1.571 $0.222 $0.000 $0.000 1805 $0.198 $10.182 2% $0.044 $0.000 $0.000 $0.000 $0.000 -$0.056 $1.496 $0.255 $0.000 $0.000 1806 $0.179 $10.702 2% $0.053 $0.000 $0.000 $0.000 $0.000 -$0.102 $1.328 $0.281 $0.000 $0.000 1807 $0.163 $10.741 2% $0.057 $0.000 $0.000 $0.000 $0.000 -$0.150 $1.281 $0.313 $0.000 $0.000 1808 $0.176 $10.847 2% $0.083 $0.000 $0.000 $0.000 $0.000 -$0.120 $1.105 $0.297 $0.000 $0.000 1809 $0.186 $11.724 2% $0.102 $0.000 $0.000 $0.000 $0.000 $0.043 $0.983 $0.143 $0.000 $0.000 1810 $0.155 $12.069 1% $0.069 $0.000 $0.000 $0.000 $0.000 $0.021 $0.948 $0.171 $0.000 $0.000 1811 $0.141 $12.459 1% $0.067 $0.000 $0.000 $0.000 $0.000 -$0.107 $0.787 $0.246 $0.000 $0.000 1812 $0.335 $12.581 3% $0.256 $0.000 $0.000 $0.000 $0.000 $0.168 $7.290 $0.169 $0.000 $0.000 1813 $0.431 $12.800 3% $0.349 $0.000 $0.000 $0.000 $0.000 $0.231 $0.747 $0.200 $0.000 $0.000 1814 $0.432 $13.049 3% $0.339 $0.000 $0.000 $0.000 $0.000 $0.287 $0.994 $0.145 $0.000 $0.000 1815 $0.465 $12.778 4% $0.326 $0.000 $0.000 $0.000 $0.000 $0.232 $1.386 $0.233 $0.000 $0.000 1816 $0.476 $12.273 4% $0.305 $0.000 $0.000 $0.000 $0.000 -$0.261 $1.929 $0.736 $0.000 $0.000 1817 $0.368 $12.258 3% $0.180 $0.000 $0.000 $0.000 $0.000 -$0.182 $1.992 $0.550 $0.000 $0.000 1818 $0.354 $12.373 3% $0.161 $0.000 $0.000 $0.000 $0.000 -$0.032 $1.754 $0.385 $0.000 $0.000 1819 $0.383 $12.203 3% $0.217 $0.000 $0.000 $0.000 $0.000 -$0.054 $1.619 $0.437 $0.000 $0.000 1820 $0.345 $12.727 3% $0.182 $0.000 $0.000 $0.000 $0.000 -$0.007 $1.655 $0.345 $0.000 $0.000 1821 $0.321 $13.774 2% $0.151 $0.000 $0.000 $0.000 $0.000 $0.025 $1.698 $0.294 $0.000 $0.000 1822 $0.295 $14.545 2% $0.133 $0.000 $0.000 $0.000 $0.000 -$0.095 $1.702 $0.387 $0.000 $0.000 1823 $0.324 $15.306 2% $0.151 $0.000 $0.000 $0.000 $0.000 -$0.118 $1.855 $0.443 $0.000 $0.000 1824 $0.478 $16.667 3% $0.171 $0.000 $0.000 $0.000 $0.000 $0.020 $2.007 $0.458 $0.000 $0.000 1825 $0.372 $17.609 2% $0.174 $0.000 $0.000 $0.000 $0.000 -$0.133 $1.822 $0.502 $0.000 $0.000 1826 $0.402 $18.696 2% $0.211 $0.000 $0.000 $0.000 $0.000 -$0.180 $1.763 $0.580 $0.000 $0.000 1827 $0.374 $19.362 2% $0.196 $0.000 $0.000 $0.000 $0.000 -$0.147 $1.574 $0.521 $0.000 $0.000 1828 $0.411 $20.227 2% $0.205 $0.000 $0.000 $0.000 $0.000 -$0.189 $1.534 $0.600 $0.000 $0.000 1829 $0.395 $21.395 2% $0.209 $0.000 $0.000 $0.000 $0.000 -$0.223 $1.358 $0.616 $0.000 $0.000 1830 $0.395 $23.488 2% $0.219 $0.000 $0.000 $0.000 $0.000 -$0.223 $1.130 $0.621 $0.000 $0.000
- 14. 1831 $0.420 $25.366 2% $0.241 $0.000 $0.000 $0.000 $0.000 -$0.324 $0.954 $0.744 $0.000 $0.000 1832 $0.490 $28.000 2% $0.265 $0.000 $0.000 $0.000 $0.000 -$0.365 $0.608 $0.853 $0.000 $0.000 1833 $0.664 $29.487 2% $0.390 $0.000 $0.000 $0.000 $0.000 -$0.272 $0.179 $0.938 $0.000 $0.000 1834 $0.538 $28.000 2% $0.300 $0.000 $0.000 $0.000 $0.000 -$0.078 $0.120 $0.615 $0.000 $0.000 1835 $0.495 $32.439 2% $0.283 $0.000 $0.000 $0.000 $0.000 -$0.441 $0.000 $0.937 $0.000 $0.000 1836 $0.784 $33.953 2% $0.486 $0.000 $0.000 $0.000 $0.000 -$0.477 $0.000 $1.260 $0.000 $0.000 1837 $0.922 $34.222 3% $0.511 $0.000 $0.000 $0.000 $0.000 $0.278 $0.007 $0.647 $0.000 $0.000 1838 $0.891 $36.744 2% $0.493 $0.000 $0.000 $0.000 $0.000 $0.181 $0.077 $0.709 $0.000 $0.000 1839 $0.733 $38.372 2% $0.423 $0.000 $0.000 $0.000 $0.000 -$0.102 $2.419 $0.837 $0.000 $0.000 1840 $0.707 $38.049 2% $0.385 $0.000 $0.000 $0.000 $0.000 $0.122 $0.088 $0.585 $0.000 $0.000 1841 $0.759 $40.000 2% $0.420 $0.000 $0.000 $0.000 $0.000 $0.243 $0.129 $0.520 $0.000 $0.000 1842 $0.784 $42.105 2% $0.432 $0.000 $0.000 $0.000 $0.000 $0.139 $0.358 $0.645 $0.000 $0.000 1843 $0.463 $44.286 1% $0.214 $0.000 $0.000 $0.000 $0.000 $0.103 $0.934 $0.360 $0.000 $0.000 1844 $0.760 $48.286 2% $0.400 $0.000 $0.000 $0.000 $0.000 -$0.197 $0.671 $0.960 $0.000 $0.000 1845 $0.758 $51.111 1% $0.400 $0.000 $0.000 $0.000 $0.000 -$0.194 $0.442 $0.953 $0.000 $0.000 1846 $0.883 $56.667 2% $0.531 $0.000 $0.000 $0.000 $0.000 -$0.036 $0.433 $0.922 $0.000 $0.000 1847 $1.613 $62.895 3% $1.263 $0.000 $0.000 $0.000 $0.000 $0.813 $1.021 $0.813 $0.000 $0.000 1848 $1.343 $64.865 2% $0.976 $0.000 $0.000 $0.000 $0.000 $0.254 $1.270 $1.089 $0.000 $0.000 1849 $1.375 $66.667 2% $0.722 $0.000 $0.000 $0.000 $0.000 $0.378 $1.753 $0.997 $0.000 $0.000 1850 $1.244 $71.111 2% $0.528 $0.000 $0.000 $0.000 $0.000 -$0.119 $1.764 $1.364 $0.000 $0.000 1851 $1.500 $75.000 2% $0.642 $0.000 $0.000 $0.000 $0.000 -$0.139 $1.897 $1.639 $0.000 $0.000 1852 $1.425 $84.444 2% $0.544 $0.000 $0.000 $0.000 $0.000 -$0.103 $1.839 $1.528 $0.000 $0.000 1853 $1.561 $91.111 2% $0.628 $0.000 $0.000 $0.000 $0.000 -$0.297 $1.661 $1.856 $0.000 $0.000 1854 $1.708 $94.359 2% $0.610 $0.000 $0.000 $0.000 $0.000 -$0.344 $1.082 $2.054 $0.000 $0.000 1855 $1.700 $96.098 2% $0.720 $0.000 $0.000 $0.000 $0.000 -$0.056 $0.868 $1.756 $0.000 $0.000 1856 $2.000 $100.250 2% $0.810 $0.000 $0.000 $0.000 $0.000 -$0.025 $0.800 $2.025 $0.000 $0.000 1857 $1.934 $100.976 2% $0.812 $0.000 $0.000 $0.000 $0.000 $0.073 $0.700 $1.861 $0.000 $0.000 1858 $2.287 $106.579 2% $1.071 $0.000 $0.000 $0.000 $0.000 $0.863 $1.182 $1.424 $0.000 $0.000 1859 $2.174 $112.308 2% $1.003 $0.000 $0.000 $0.000 $0.000 $0.600 $1.500 $1.577 $0.000 $0.000 1860 $2.000 $111.538 2% $0.744 $0.000 $0.000 $0.000 $0.000 $0.333 $1.667 $1.656 $0.000 $0.000 1861 $1.956 $112.195 2% $0.888 $0.000 $0.000 $0.000 $0.000 $0.739 $2.210 $1.217 $0.000 $0.000 1862 $10.338 $123.383 8% $9.317 $0.000 $0.000 $0.000 $0.000 $9.055 $11.153 $1.283 $0.000 $0.000 1863 $12.307 $129.153 10% $11.247 $0.000 $0.000 $0.000 $0.000 $11.190 $18.980 $2.100 $0.000 $0.000 1864 $12.027 $129.589 9% $10.705 $0.000 $0.000 $0.000 $0.000 $8.232 $24.874 $3.796 $0.000 $0.000 1865 $17.105 $130.000 13% $15.789 $0.000 $0.000 $0.000 $0.000 $12.671 $35.526 $4.583 $0.000 $0.000 1866 $7.246 $121.486 6% $4.641 $0.000 $0.000 $0.000 $0.000 -$0.491 $37.476 $7.735 $0.000 $0.000 1867 $5.449 $120.870 5% $2.133 $0.000 $0.000 $0.000 $0.000 -$1.871 $38.813 $7.332 $0.000 $0.000 1868 $6.062 $123.485 5% $2.618 $0.000 $0.000 $0.000 $0.000 -$0.332 $39.571 $6.392 $0.000 $0.000 1869 $5.416 $122.656 4% $1.984 $0.000 $0.000 $0.000 $0.000 -$0.652 $40.445 $6.067 $0.000 $0.000 1870 $5.470 $126.885 4% $1.767 $0.000 $0.000 $0.000 $0.000 -$1.582 $40.667 $7.051 $0.000 $0.000 1871 $5.554 $133.158 4% $1.574 $0.000 $0.000 $0.000 $0.000 -$1.523 $41.284 $7.077 $0.000 $0.000 1872 $5.337 $144.386 4% $1.495 $0.000 $0.000 $0.000 $0.000 -$1.611 $39.532 $6.947 $0.000 $0.000 1873 $5.704 $156.250 4% $1.771 $0.000 $0.000 $0.000 $0.000 -$0.666 $39.902 $6.370 $0.000 $0.000
- 15. 1874 $6.317 $160.000 4% $1.930 $0.000 $0.000 $0.000 $0.000 $0.062 $42.482 $6.255 $0.000 $0.000 1875 $6.043 $160.000 4% $1.806 $0.000 $0.000 $0.000 $0.000 -$0.129 $43.771 $6.173 $0.000 $0.000 1876 $5.968 $166.220 4% $1.706 $0.000 $0.000 $0.000 $0.000 -$0.488 $43.608 $6.454 $0.000 $0.000 1877 $5.608 $173.878 3% $1.633 $0.000 $0.000 $0.000 $0.000 -$0.696 $45.006 $6.304 $0.000 $0.000 1878 $5.768 $178.298 3% $1.632 $0.000 $0.000 $0.000 $0.000 -$0.338 $48.004 $6.106 $0.000 $0.000 1879 $6.391 $199.149 3% $1.930 $0.000 $0.000 $0.000 $0.000 -$0.074 $49.991 $6.466 $0.000 $0.000 1880 $6.338 $216.667 3% $2.258 $0.000 $0.000 $0.000 $0.000 -$1.306 $44.175 $7.642 $0.000 $0.000 1881 $6.256 $241.667 3% $2.213 $0.000 $0.000 $0.000 $0.000 -$2.027 $43.104 $8.283 $0.000 $0.000 1882 $6.219 $254.167 2% $2.498 $0.000 $0.000 $0.000 $0.000 -$3.060 $39.965 $9.279 $0.000 $0.000 1883 $6.568 $261.702 3% $2.770 $0.000 $0.000 $0.000 $0.000 -$2.874 $40.089 $9.443 $0.000 $0.000 1884 $6.335 $256.522 2% $2.439 $0.000 $0.000 $0.000 $0.000 -$2.185 $39.793 $8.517 $0.000 $0.000 1885 $6.896 $257.778 3% $2.551 $0.000 $0.000 $0.000 $0.000 -$1.244 $41.422 $8.140 $0.000 $0.000 1886 $6.670 $277.273 2% $2.536 $0.000 $0.000 $0.000 $0.000 -$1.975 $40.343 $8.645 $0.000 $0.000 1887 $7.293 $297.727 2% $2.925 $0.000 $0.000 $0.000 $0.000 -$2.257 $37.673 $9.550 $0.000 $0.000 1888 $7.373 $315.909 2% $3.084 $0.000 $0.000 $0.000 $0.000 -$2.445 $38.475 $9.818 $0.000 $0.000 1889 $8.409 $323.256 3% $3.567 $0.000 $0.000 $0.000 $0.000 -$1.895 $37.653 $10.305 $0.000 $0.000 1890 $8.937 $351.163 3% $4.035 $0.000 $0.000 $0.000 $0.000 -$1.853 $36.095 $10.791 $0.000 $0.000 1891 $10.205 $358.140 3% $4.635 $0.000 $0.000 $0.000 $0.000 -$0.458 $35.953 $10.663 $0.000 $0.000 1892 $9.814 $381.395 3% $4.900 $0.000 $0.000 $0.000 $0.000 -$0.091 $36.942 $9.905 $0.000 $0.000 1893 $11.074 $366.667 3% $5.693 $0.000 $0.000 $0.000 $0.000 $0.079 $36.810 $10.993 $0.000 $0.000 1894 $11.313 $352.500 3% $5.685 $0.000 $0.000 $0.000 $0.000 $1.778 $40.808 $9.535 $0.000 $0.000 1895 $11.369 $400.000 3% $5.692 $0.000 $0.000 $0.000 $0.000 $1.069 $42.977 $10.300 $0.000 $0.000 1896 $11.362 $397.436 3% $5.574 $0.000 $0.000 $0.000 $0.000 $0.577 $45.379 $10.785 $0.000 $0.000 1897 $11.792 $415.385 3% $5.759 $0.000 $0.000 $0.000 $0.000 $0.756 $46.608 $11.036 $0.000 $0.000 1898 $13.882 $464.103 3% $7.649 $0.000 $0.000 $0.000 $0.000 $1.208 $46.064 $12.674 $0.000 $0.000 1899 $18.121 $500.000 4% $1.111 $0.000 $0.000 $0.000 $0.000 $2.454 $51.074 $15.667 $0.000 $0.000 1900 $16.118 $528.205 3% $8.503 $0.000 $0.000 $0.000 $0.000 -$1.051 $54.795 $17.169 $0.000 $0.000 1901 $16.005 $557.500 3% $8.610 $0.000 $0.000 $0.000 $0.000 -$1.478 $53.583 $17.483 $0.000 $0.000 1902 $14.300 $602.500 2% $7.650 $0.000 $0.125 $0.100 $0.075 -$2.025 $53.965 $16.325 $0.000 $0.000 1903 $14.637 $631.707 2% $7.690 $0.000 $0.127 $0.105 $0.073 -$1.510 $53.720 $16.146 $0.000 $0.000 1904 $14.993 $611.905 2% $7.736 $0.000 $0.074 $0.107 $0.074 -$0.390 $53.905 $15.381 $0.000 $0.000 1905 $16.112 $702.439 2% $8.166 $0.000 $0.134 $0.117 $0.076 $0.063 $55.478 $16.049 $0.000 $0.000 1906 $16.502 $738.095 2% $8.217 $0.000 $0.133 $0.121 $0.076 -$0.879 $55.648 $17.381 $0.000 $0.000 1907 $16.527 $770.455 2% $8.084 $0.000 $0.132 $0.123 $0.075 -$2.291 $55.845 $18.818 $0.000 $0.000 1908 $17.744 $700.000 3% $8.526 $0.000 $0.140 $0.135 $0.081 $0.116 $61.088 $17.628 $0.000 $0.000 1909 $18.616 $748.837 2% $8.788 $0.000 $0.144 $0.144 $0.086 $0.686 $61.386 $17.930 $0.000 $0.000 1910 $19.089 $759.091 3% $8.855 $0.000 $0.145 $0.150 $0.091 -$0.798 $60.289 $19.886 $0.000 $0.000 1911 $20.027 $779.545 3% $9.127 $0.000 $0.150 $0.159 $0.095 -$0.905 $62.855 $20.932 $0.000 $0.000 1912 $20.544 $831.111 2% $9.202 $0.000 $0.151 $0.167 $0.102 $0.078 $63.742 $20.467 $0.000 $0.000 1913 $21.087 $850.000 2% $9.283 $0.000 $0.152 $0.174 $0.109 $0.174 $63.396 $20.913 $0.761 $0.000 1914 $21.362 $776.596 3% $9.787 $0.000 $0.149 $0.191 $0.128 $1.553 $61.968 $19.809 $0.872 $0.000 1915 $22.340 $823.404 3% $10.170 $0.000 $0.149 $0.191 $0.170 $4.574 $65.066 $17.766 $1.000 $0.000 1916 $20.412 $972.549 2% $9.745 $0.000 $0.157 $0.196 $0.176 $3.020 $70.769 $17.392 $2.373 $1.294
- 16. 1917 $38.433 $995.000 4% $13.417 $0.000 $0.133 $0.183 $0.200 $18.067 $95.297 $20.367 $6.217 $2.900 1918 $183.859 $1,067.606 17% $89.662 $0.000 $0.113 $0.155 $0.239 $126.873 $205.524 $56.986 $38.310 $17.915 1919 $233.259 $966.667 24% $139.012 $0.000 $0.111 $0.148 $0.321 $162.963 $338.160 $70.296 $33.136 $15.556 1920 $72.160 $940.426 8% $28.085 $0.000 $0.096 $0.138 $0.404 -$6.351 $276.090 $78.511 $42.894 $20.213 1921 $65.607 $876.190 7% $24.869 $0.000 $0.107 $0.155 $0.690 -$8.012 $285.445 $73.619 $40.536 $19.179 1922 $47.633 $929.114 5% $16.494 $0.076 $0.139 $0.190 $1.190 -$6.304 $290.676 $53.937 $28.253 $13.418 1923 $46.438 $1,067.500 4% $15.875 $0.088 $0.138 $0.188 $1.113 -$7.063 $279.371 $53.500 $21.063 $10.038 1924 $45.863 $1,086.250 4% $15.563 $0.100 $0.138 $0.200 $1.063 -$7.913 $265.635 $53.775 $22.313 $10.675 1925 $44.183 $1,104.878 4% $14.963 $0.110 $0.134 $0.195 $1.000 -$5.183 $250.198 $49.366 $20.695 $9.939 1926 $43.096 $1,167.470 4% $14.639 $0.133 $0.133 $0.205 $0.940 -$7.783 $236.665 $50.880 $22.916 $10.217 1927 $43.617 $1,179.012 4% $14.951 $0.173 $0.148 $0.222 $0.938 -$11.556 $228.542 $55.173 $26.395 $10.852 1928 $45.850 $1,217.500 4% $16.100 $0.200 $0.088 $0.238 $1.038 -$8.263 $220.054 $54.113 $26.100 $10.600 1929 $47.613 $1,295.000 4% $17.150 $0.225 $0.050 $0.250 $1.163 -$5.975 $211.639 $53.588 $27.913 $13.125 1930 $50.718 $1,169.231 4% $18.756 $0.269 $0.038 $0.282 $1.321 -$11.205 $207.504 $61.923 $29.500 $14.038 1931 $57.859 $1,077.465 5% $22.014 $0.338 $0.028 $0.338 $1.606 $1.817 $236.638 $56.042 $24.944 $11.183 1932 $60.085 $826.761 7% $23.549 $0.394 $0.028 $0.366 $1.789 $22.986 $274.465 $37.099 $14.761 $6.338 1933 $83.656 $924.590 9% $22.557 $0.541 $4.820 $2.131 $2.000 $30.213 $369.487 $53.443 $14.705 $6.639 1934 $94.302 $1,047.619 9% $17.175 $0.619 $9.349 $3.730 $1.857 $32.619 $429.414 $61.683 $12.556 $6.429 1935 $118.016 $1,145.313 10% $29.156 $0.250 $8.766 $4.453 $1.875 $47.219 $432.827 $70.797 $17.219 $8.375 1936 $141.000 $1,289.231 11% $40.815 $0.677 $8.215 $5.154 $1.923 $61.369 $519.669 $79.631 $21.708 $10.246 1937 $131.448 $1,371.642 10% $32.119 $0.836 $7.955 $4.537 $1.881 $38.896 $543.651 $92.552 $30.015 $14.507 1938 $128.015 $1,304.545 10% $25.045 $1.045 $8.091 $4.152 $1.924 $18.530 $563.102 $109.485 $39.545 $19.348 1939 $142.385 $1,418.462 10% $29.308 $1.169 $8.323 $4.738 $1.908 $32.954 $622.146 $109.431 $36.092 $17.200 1940 $154.785 $1,560.000 10% $33.215 $1.308 $9.231 $5.277 $1.892 $47.092 $661.038 $107.692 $32.031 $14.754 1941 $205.217 $1,836.232 11% $104.957 $1.971 $10.928 $3.826 $1.783 $68.435 $709.586 $136.783 $50.246 $18.507 1942 $467.750 $2,130.263 22% $356.329 $2.474 $11.974 $2.447 $1.618 $256.408 $952.928 $211.342 $104.368 $42.171 1943 $1,024.444 $2,451.852 42% $869.654 $2.926 $11.802 $2.407 $1.988 $687.765 $1,687.605 $336.679 $199.321 $81.037 1944 $1,225.854 $2,680.488 46% ###### $3.512 $12.220 $2.500 $2.451 $599.037 $2,451.256 $626.817 $419.976 $240.256 1945 $1,272.333 $2,655.952 48% ###### $5.202 $9.810 $4.214 $3.119 $639.083 $3,079.548 $633.250 $409.726 $218.333 1946 $731.143 $2,442.857 30% $585.989 $6.451 $7.132 $5.538 $3.560 $221.198 $2,960.681 $509.945 $307.582 $177.549 1947 $398.096 $2,348.077 17% $219.471 $6.452 $8.202 $15.692 $4.942 -$31.096 $2,483.519 $429.192 $255.192 $172.183 1948 $314.973 $2,382.301 13% $174.735 $6.690 $9.363 $24.425 $6.239 -$103.204 $2,232.673 $418.177 $256.487 $170.841 1949 $362.126 $2,408.108 15% $198.117 $7.883 $12.072 $25.216 $7.505 -$35.676 $2,277.207 $397.802 $240.829 $140.189 1950 $396.460 $2,600.000 15% $214.504 $8.796 $14.354 $25.124 $8.522 $11.265 $2,277.496 $385.195 $232.150 $139.336 1951 $401.107 $2,781.148 14% $239.500 $14.492 $12.869 $18.000 $7.926 -$63.902 $2,091.984 $465.008 $293.025 $177.402 1952 $577.161 $2,889.516 20% $416.839 $18.411 $12.177 $13.839 $8.177 -$1.855 $2,089.556 $579.016 $396.347 $225.169 1953 $639.920 $3,035.200 21% $455.504 $24.728 $14.448 $9.880 $7.648 $46.008 $2,128.568 $593.912 $408.432 $238.528 1954 $616.603 $3,019.048 20% $419.246 $29.262 $15.484 $8.841 $7.611 $14.738 $2,152.857 $601.865 $401.929 $234.460 1955 $587.528 $3,318.400 18% $377.336 $37.888 $15.808 $10.584 $7.240 $12.208 $2,194.992 $575.320 $372.864 $229.976 1956 $598.354 $3,444.882 17% $370.969 $46.205 $15.417 $11.614 $7.457 -$41.756 $2,147.646 $640.110 $417.858 $253.449 1957 $624.298 $3,519.847 18% $391.588 $54.244 $16.053 $11.969 $7.878 -$40.328 $2,065.092 $664.626 $433.489 $271.908 1958 $637.437 $3,460.741 18% $383.356 $64.756 $18.941 $13.111 $8.178 $0.356 $2,046.985 $637.081 $405.911 $257.215 1959 $687.728 $3,725.000 18% $396.941 $74.853 $20.581 $12.221 $9.875 $59.353 $2,093.426 $628.375 $397.265 $269.993
- 17. 1960 $704.957 $3,814.493 18% $386.159 $84.739 $21.826 $11.848 $10.507 -$18.232 $2,074.862 $723.188 $450.790 $295.036 1961 $749.021 $3,890.714 19% $407.064 $91.750 $23.114 $12.286 $11.393 $25.157 $2,064.079 $723.864 $444.943 $295.271 1962 $757.596 $4,153.191 18% $451.092 $83.135 $46.716 $12.326 $8.489 $50.674 $2,114.901 $706.922 $468.752 $323.199 1963 $778.434 $4,319.580 18% $449.105 $92.517 $45.035 $13.930 $10.147 $33.259 $2,138.881 $745.175 $483.685 $332.783 1964 $817.434 $4,576.552 18% $450.883 $97.683 $44.283 $16.007 $12.331 $40.793 $2,149.745 $776.641 $497.862 $335.841 1965 $804.272 $4,891.837 16% $419.116 ##### $40.374 $19.925 $12.184 $9.599 $2,158.327 $794.673 $505.122 $331.918 1966 $890.940 $5,217.219 17% $460.974 ##### $37.185 $34.570 $17.258 $24.483 $2,118.589 $866.457 $566.351 $367.192 1967 $1,009.385 $5,337.179 19% $536.660 ##### $36.718 $47.115 $39.096 $55.397 $2,091.160 $953.987 $612.160 $394.397 1968 $1,092.847 $5,582.822 20% $578.282 ##### $40.411 $52.546 $55.454 $154.362 $2,132.380 $938.485 $597.491 $421.632 1969 $1,067.674 $5,515.116 19% $550.750 ##### $42.203 $49.337 $63.122 -$18.849 $2,056.512 $1,086.523 $720.506 $507.262 1970 $1,080.934 $5,737.569 19% $523.149 ##### $50.155 $52.939 $66.961 $15.702 $2,049.276 $1,065.232 $680.890 $499.514 1971 $1,112.021 $5,963.492 19% $491.000 ##### $78.037 $57.450 $71.249 $121.868 $2,106.508 $990.153 $597.963 $456.243 1972 $1,182.979 $6,350.256 19% $485.508 ##### $93.103 $69.272 $82.831 $119.856 $2,191.077 $1,063.123 $650.785 $485.831 1973 $1,181.284 $6,647.596 18% $446.317 ##### $80.668 $65.894 $83.692 $71.673 $2,202.606 $1,109.611 $670.188 $496.375 1974 $1,171.126 $6,521.739 18% $427.961 ##### $87.735 $58.583 $88.574 $26.674 $2,065.478 $1,144.452 $685.096 $517.183 1975 $1,318.778 $6,501.190 20% $437.262 ##### $127.968 $67.702 $102.401 $211.278 $2,115.829 $1,107.500 $646.853 $485.659 1976 $1,397.714 $6,862.030 20% $430.338 ##### $158.147 $74.981 $118.677 $277.188 $2,332.455 $1,120.526 $650.421 $494.748 1977 $1,446.000 $7,176.325 20% $429.739 ##### $140.519 $78.385 $129.495 $189.608 $2,469.399 $1,256.392 $750.947 $556.982 1978 $1,504.085 $7,523.607 20% $429.308 ##### $125.531 $125.531 $135.384 $194.049 $2,529.652 $1,310.036 $789.967 $593.403 1979 $1,486.808 $7,561.357 20% $423.938 ##### $116.012 $92.982 $138.611 $120.136 $2,438.109 $1,366.673 $836.336 $642.599 1980 $1,534.912 $7,245.455 21% $436.049 ##### $142.499 $86.296 $143.532 $191.764 $2,357.665 $1,343.148 $801.738 $633.945 1981 $1,595.861 $7,360.941 22% $455.501 ##### $149.562 $81.478 $155.332 $185.809 $2,347.894 $1,410.052 $816.598 $672.746 1982 $1,653.532 $7,217.295 23% $491.235 ##### $151.306 $62.570 $164.106 $283.763 $2,532.217 $1,369.769 $769.293 $660.186 1983 $1,734.687 $7,589.485 23% $529.124 ##### $173.648 $59.745 $174.311 $445.927 $2,955.386 $1,288.760 $699.485 $620.039 1984 $1,752.228 $8,093.004 22% $553.243 ##### $143.685 $59.200 $180.984 $381.414 $3,235.123 $1,371.370 $731.086 $614.023 1985 $1,881.503 $8,390.258 22% $586.851 ##### $168.473 $60.865 $197.543 $422.083 $3,624.453 $1,459.419 $787.002 $665.072 1986 $1,934.455 $8,657.813 22% $612.998 ##### $144.357 $62.498 $207.227 $432.082 $4,150.977 $1,502.373 $804.887 $681.561 1987 $1,890.923 $8,925.612 21% $603.382 ##### $140.755 $58.725 $216.738 $281.972 $4,426.139 $1,608.951 $897.331 $739.279 1988 $1,924.919 $9,229.295 21% $597.134 ##### $141.344 $60.329 $223.083 $280.609 $4,705.859 $1,644.309 $896.363 $725.463 1989 $1,972.121 $9,455.862 21% $591.681 ##### $142.367 $65.472 $229.921 $263.172 $4,926.603 $1,708.948 $946.519 $768.431 1990 $2,050.949 $9,497.709 22% $559.990 ##### $149.727 $65.486 $255.020 $361.768 $5,291.833 $1,689.182 $917.170 $764.131 1991 $2,079.011 $9,412.716 22% $503.060 ##### $174.829 $69.692 $275.779 $422.669 $5,754.003 $1,656.342 $888.403 $734.422 1992 $2,106.174 $9,661.128 22% $531.284 ##### $207.977 $70.610 $317.867 $442.561 $6,196.067 $1,663.613 $878.405 $725.555 1993 $2,085.089 $9,848.225 21% $508.882 ##### $215.280 $75.936 $340.189 $377.293 $6,525.873 $1,707.796 $927.811 $753.964 1994 $2,109.538 $10,205.195 21% $485.294 ##### $214.870 $68.046 $363.447 $293.203 $6,771.645 $1,816.335 $986.205 $783.629 1995 $2,129.045 $10,390.028 20% $458.413 ##### $214.622 $77.494 $386.619 $230.267 $6,985.927 $1,898.778 $1,049.506 $828.994 1996 $2,126.172 $10,649.728 20% $430.837 ##### $213.121 $71.323 $400.004 $146.362 $7,118.270 $1,979.809 $1,128.394 $894.301 1997 $2,135.080 $11,072.400 19% $433.395 ##### $211.696 $70.811 $418.479 $29.187 $7,217.533 $2,105.893 $1,226.345 $983.288 1998 $2,168.871 $11,390.630 19% $424.012 ##### $209.492 $73.337 $425.543 -$90.919 $7,252.218 $2,259.790 $1,334.991 $1,087.383 1999 $2,184.904 $11,811.476 18% $427.779 ##### $212.393 $72.275 $425.573 -$161.232 $7,260.937 $2,346.136 $1,366.059 $1,128.986 2000 $2,222.634 $12,110.683 18% $445.581 ##### $212.898 $74.528 $436.827 -$293.466 $7,048.671 $2,516.099 $1,505.278 $1,247.776 2001 $2,250.229 $12,147.585 19% $442.380 ##### $221.064 $76.958 $470.597 -$154.879 $7,013.841 $2,405.109 $1,383.350 $1,200.893 2002 $2,391.379 $12,364.328 19% $501.566 ##### $265.895 $92.598 $508.203 $187.574 $7,405.755 $2,203.805 $1,196.658 $1,020.624
- 18. 2003 $2,511.767 $12,658.372 20% $561.803 ##### $281.897 $105.303 $545.359 $439.058 $7,887.477 $2,072.709 $1,076.136 $922.906 2004 $2,596.840 $13,144.960 20% $614.471 ##### $269.260 $109.133 $577.003 $467.418 $8,356.795 $2,129.422 $1,130.612 $916.148 2005 $2,707.777 $13,514.786 20% $657.260 ##### $268.916 $116.563 $601.588 $348.675 $8,688.620 $2,359.102 $1,320.377 $1,015.577 2006 $2,818.938 $13,896.815 20% $659.481 ##### $264.956 $135.547 $618.522 $263.471 $9,030.754 $2,555.467 $1,483.891 $1,108.185 2007 $2,816.244 $14,154.489 20% $673.522 ##### $262.363 $105.247 $662.376 $165.841 $9,295.820 $2,650.402 $1,582.779 $1,200.691 2008 $2,962.145 $14,067.130 21% $724.632 ##### $311.237 $101.191 $666.737 $455.362 $9,916.346 $2,506.783 $1,440.016 $1,137.786 2009 $3,997.840 $14,240.200 28% $821.707 ##### $395.432 $91.689 $784.224 $1,841.190 $12,867.500 $2,156.650 $1,099.764 $953.006
- 19. Corporate Other Social Income Taxes Insuranc Tax e $0.000 $0.082 $0.000 $0.000 $0.102 $0.000 $0.000 $0.106 $0.000 $0.000 $0.108 $0.000 $0.000 $0.135 $0.000 $0.000 $0.147 $0.000 $0.000 $0.136 $0.000 $0.000 $0.129 $0.000 $0.000 $0.183 $0.000 $0.000 $0.219 $0.000 $0.000 $0.300 $0.000 $0.000 $0.213 $0.000 $0.000 $0.215 $0.000 $0.000 $0.247 $0.000 $0.000 $0.274 $0.000 $0.000 $0.304 $0.000 $0.000 $0.290 $0.000 $0.000 $0.134 $0.000 $0.000 $0.162 $0.000 $0.000 $0.236 $0.000 $0.000 $0.158 $0.000 $0.000 $0.231 $0.000 $0.000 $0.137 $0.000 $0.000 $0.218 $0.000 $0.000 $0.723 $0.000 $0.000 $0.534 $0.000 $0.000 $0.366 $0.000 $0.000 $0.417 $0.000 $0.000 $0.324 $0.000 $0.000 $0.275 $0.000 $0.000 $0.367 $0.000 $0.000 $0.418 $0.000 $0.000 $0.431 $0.000 $0.000 $0.474 $0.000 $0.000 $0.550 $0.000 $0.000 $0.489 $0.000 $0.000 $0.564 $0.000 $0.000 $0.577 $0.000 $0.000 $0.577 $0.000
- 20. $0.000 $0.695 $0.000 $0.000 $0.798 $0.000 $0.000 $0.869 $0.000 $0.000 $0.545 $0.000 $0.000 $0.863 $0.000 $0.000 $1.181 $0.000 $0.000 $0.556 $0.000 $0.000 $0.612 $0.000 $0.000 $0.733 $0.000 $0.000 $0.476 $0.000 $0.000 $0.412 $0.000 $0.000 $0.526 $0.000 $0.000 $0.237 $0.000 $0.000 $0.837 $0.000 $0.000 $0.833 $0.000 $0.000 $0.825 $0.000 $0.000 $0.697 $0.000 $0.000 $0.965 $0.000 $0.000 $0.867 $0.000 $0.000 $1.211 $0.000 $0.000 $1.461 $0.000 $0.000 $1.383 $0.000 $0.000 $1.711 $0.000 $0.000 $1.892 $0.000 $0.000 $1.595 $0.000 $0.000 $1.853 $0.000 $0.000 $1.683 $0.000 $0.000 $1.229 $0.000 $0.000 $1.372 $0.000 $0.000 $1.438 $0.000 $0.000 $1.012 $0.000 $0.000 $1.106 $0.000 $0.000 $1.968 $0.000 $0.000 $3.725 $0.000 $0.000 $4.409 $0.000 $0.000 $7.553 $0.000 $0.000 $7.228 $0.000 $0.000 $6.135 $0.000 $0.000 $5.808 $0.000 $0.000 $6.733 $0.000 $0.000 $6.726 $0.000 $0.000 $6.568 $0.000 $0.000 $5.955 $0.000
- 21. $0.000 $5.751 $0.000 $0.000 $5.649 $0.000 $0.000 $5.884 $0.000 $0.000 $5.741 $0.000 $0.000 $5.485 $0.000 $0.000 $5.823 $0.000 $0.000 $6.948 $0.000 $0.000 $7.515 $0.000 $0.000 $8.408 $0.000 $0.000 $8.470 $0.000 $0.000 $7.576 $0.000 $0.000 $7.191 $0.000 $0.000 $7.648 $0.000 $0.000 $8.441 $0.000 $0.000 $8.620 $0.000 $0.000 $9.002 $0.000 $0.000 $9.374 $0.000 $0.000 $9.140 $0.000 $0.000 $8.251 $0.000 $0.000 $9.186 $0.000 $0.000 $7.660 $0.000 $0.000 $8.323 $0.000 $0.000 $8.672 $0.000 $0.000 $8.915 $0.000 $0.000 $10.392 $0.000 $0.000 $13.231 $0.000 $0.000 $14.544 $0.000 $0.000 $14.685 $0.000 $0.000 $12.300 $0.000 $0.000 $12.683 $0.000 $0.000 $11.976 $0.000 $0.000 $12.390 $0.000 $0.000 $13.119 $0.000 $0.000 $13.341 $0.000 $0.000 $12.767 $0.000 $0.000 $13.209 $0.000 $0.000 $13.818 $0.000 $0.000 $13.545 $0.000 $0.000 $13.289 $0.000 $0.761 $13.304 $0.000 $0.872 $12.596 $0.000 $1.000 $10.894 $0.000 $1.078 $11.824 $0.000
- 22. $3.317 $14.017 $0.000 $20.394 $13.338 $0.000 $17.580 $9.469 $0.000 $22.681 $9.426 $0.000 $21.357 $12.250 $0.000 $14.835 $16.354 $0.000 $11.025 $16.825 $0.000 $11.638 $15.650 $0.000 $10.756 $15.134 $0.000 $12.699 $17.217 $0.000 $15.543 $27.284 $0.309 $15.500 $25.725 $0.325 $14.788 $25.613 $0.350 $15.462 $24.231 $0.385 $13.761 $22.775 $0.437 $8.423 $21.183 $0.465 $8.066 $34.016 $0.508 $6.127 $41.952 $0.460 $8.844 $46.547 $0.484 $11.462 $50.908 $0.508 $15.507 $50.701 $4.522 $20.197 $52.742 $8.667 $18.892 $54.292 $10.185 $17.277 $54.985 $11.538 $31.739 $69.377 $13.899 $62.197 $78.934 $15.342 $118.284 ##### $18.951 $179.720 ##### $23.195 $191.393 ##### $22.536 $130.033 ##### $20.692 $83.010 ##### $21.288 $85.646 ##### $22.504 $100.640 ##### $25.099 $92.814 ##### $26.779 $115.623 ##### $33.492 $171.177 ##### $37.984 $169.904 ##### $40.984 $167.468 ##### $44.500 $142.888 ##### $49.152 $164.409 ##### $60.559 $161.580 ##### $62.527 $148.696 ##### $69.526 $127.272 ##### $71.257
- 23. $155.754 ##### $88.297 $149.671 ##### $97.914 $145.553 ##### ##### $150.902 ##### ##### $162.021 ##### ##### $173.204 ##### ##### $199.159 ##### ##### $217.763 ##### ##### $175.859 ##### ##### $213.244 ##### ##### $181.376 ##### ##### $141.720 ##### ##### $164.954 ##### ##### $173.813 ##### ##### $167.913 ##### ##### $161.194 ##### ##### $155.673 ##### ##### $193.965 ##### ##### $196.564 ##### ##### $193.737 $95.929 ##### $167.792 ##### ##### $143.852 ##### ##### $109.106 ##### ##### $79.446 ##### ##### $117.064 ##### ##### $121.930 ##### ##### $123.326 ##### ##### $158.053 ##### ##### $170.901 ##### ##### $178.088 ##### ##### $153.039 ##### ##### $153.981 ##### ##### $152.851 ##### ##### $173.846 ##### ##### $202.576 ##### ##### $220.511 ##### ##### $234.093 ##### ##### $243.057 ##### ##### $247.608 ##### ##### $237.073 ##### ##### $257.502 ##### ##### $182.458 ##### ##### $176.033 ##### #####
- 24. $153.230 ##### ##### $214.463 ##### ##### $304.800 ##### ##### $375.706 ##### ##### $382.088 ##### ##### $302.230 ##### ##### $146.758 ##### #####
- 25. Total Total Individual Corporate Other Taxes Social Revenue Income Tax Income Tax Income Tax Insurance Revenue 1792 $0.082 $0.000 $0.000 $0.000 $0.082 $0.000 1793 $0.104 $0.000 $0.000 $0.000 $0.102 $0.000 1794 $0.110 $0.000 $0.000 $0.000 $0.106 $0.000 1795 $0.107 $0.000 $0.000 $0.000 $0.108 $0.000 1796 $0.139 $0.000 $0.000 $0.000 $0.135 $0.000 1797 $0.151 $0.000 $0.000 $0.000 $0.147 $0.000 1798 $0.140 $0.000 $0.000 $0.000 $0.136 $0.000 1799 $0.134 $0.000 $0.000 $0.000 $0.129 $0.000 1800 $0.188 $0.000 $0.000 $0.000 $0.183 $0.000 1801 $0.242 $0.000 $0.000 $0.000 $0.219 $0.000 1802 $0.306 $0.000 $0.000 $0.000 $0.300 $0.000 1803 $0.215 $0.000 $0.000 $0.000 $0.213 $0.000 1804 $0.222 $0.000 $0.000 $0.000 $0.215 $0.000 1805 $0.255 $0.000 $0.000 $0.000 $0.247 $0.000 1806 $0.281 $0.000 $0.000 $0.000 $0.274 $0.000 1807 $0.313 $0.000 $0.000 $0.000 $0.304 $0.000 1808 $0.297 $0.000 $0.000 $0.000 $0.290 $0.000 1809 $0.143 $0.000 $0.000 $0.000 $0.134 $0.000 1810 $0.171 $0.000 $0.000 $0.000 $0.162 $0.000 1811 $0.246 $0.000 $0.000 $0.000 $0.236 $0.000 1812 $0.169 $0.000 $0.000 $0.000 $0.158 $0.000 1813 $0.200 $0.000 $0.000 $0.000 $0.231 $0.000 1814 $0.145 $0.000 $0.000 $0.000 $0.137 $0.000 1815 $0.233 $0.000 $0.000 $0.000 $0.218 $0.000 1816 $0.736 $0.000 $0.000 $0.000 $0.723 $0.000 1817 $0.550 $0.000 $0.000 $0.000 $0.534 $0.000 1818 $0.385 $0.000 $0.000 $0.000 $0.366 $0.000 1819 $0.437 $0.000 $0.000 $0.000 $0.417 $0.000 1820 $0.345 $0.000 $0.000 $0.000 $0.324 $0.000 1821 $0.294 $0.000 $0.000 $0.000 $0.275 $0.000 1822 $0.387 $0.000 $0.000 $0.000 $0.367 $0.000 1823 $0.443 $0.000 $0.000 $0.000 $0.418 $0.000 1824 $0.458 $0.000 $0.000 $0.000 $0.431 $0.000 1825 $0.502 $0.000 $0.000 $0.000 $0.474 $0.000 1826 $0.580 $0.000 $0.000 $0.000 $0.550 $0.000 1827 $0.521 $0.000 $0.000 $0.000 $0.489 $0.000 1828 $0.600 $0.000 $0.000 $0.000 $0.564 $0.000 1829 $0.616 $0.000 $0.000 $0.000 $0.577 $0.000 1830 $0.621 $0.000 $0.000 $0.000 $0.577 $0.000 1831 $0.744 $0.000 $0.000 $0.000 $0.695 $0.000 1832 $0.853 $0.000 $0.000 $0.000 $0.798 $0.000 1833 $0.938 $0.000 $0.000 $0.000 $0.869 $0.000 1834 $0.615 $0.000 $0.000 $0.000 $0.545 $0.000 1835 $0.937 $0.000 $0.000 $0.000 $0.863 $0.000 1836 $1.260 $0.000 $0.000 $0.000 $1.181 $0.000 1837 $0.647 $0.000 $0.000 $0.000 $0.556 $0.000 1838 $0.709 $0.000 $0.000 $0.000 $0.612 $0.000 1839 $0.837 $0.000 $0.000 $0.000 $0.733 $0.000
- 26. 1840 $0.585 $0.000 $0.000 $0.000 $0.476 $0.000 1841 $0.520 $0.000 $0.000 $0.000 $0.412 $0.000 1842 $0.645 $0.000 $0.000 $0.000 $0.526 $0.000 1843 $0.360 $0.000 $0.000 $0.000 $0.237 $0.000 1844 $0.960 $0.000 $0.000 $0.000 $0.837 $0.000 1845 $0.953 $0.000 $0.000 $0.000 $0.833 $0.000 1846 $0.922 $0.000 $0.000 $0.000 $0.825 $0.000 1847 $0.813 $0.000 $0.000 $0.000 $0.697 $0.000 1848 $1.089 $0.000 $0.000 $0.000 $0.965 $0.000 1849 $0.997 $0.000 $0.000 $0.000 $0.867 $0.000 1850 $1.364 $0.000 $0.000 $0.000 $1.211 $0.000 1851 $1.639 $0.000 $0.000 $0.000 $1.461 $0.000 1852 $1.528 $0.000 $0.000 $0.000 $1.383 $0.000 1853 $1.856 $0.000 $0.000 $0.000 $1.711 $0.000 1854 $2.054 $0.000 $0.000 $0.000 $1.892 $0.000 1855 $1.756 $0.000 $0.000 $0.000 $1.595 $0.000 1856 $2.025 $0.000 $0.000 $0.000 $1.853 $0.000 1857 $1.861 $0.000 $0.000 $0.000 $1.683 $0.000 1858 $1.424 $0.000 $0.000 $0.000 $1.229 $0.000 1859 $1.577 $0.000 $0.000 $0.000 $1.372 $0.000 1860 $1.656 $0.000 $0.000 $0.000 $1.438 $0.000 1861 $1.217 $0.000 $0.000 $0.000 $1.012 $0.000 1862 $1.283 $0.000 $0.000 $0.000 $1.106 $0.000 1863 $2.100 $0.000 $0.000 $0.000 $1.968 $0.000 1864 $3.796 $0.000 $0.000 $0.000 $3.725 $0.000 1865 $4.583 $0.000 $0.000 $0.000 $4.409 $0.000 1866 $7.735 $0.000 $0.000 $0.000 $7.553 $0.000 1867 $7.332 $0.000 $0.000 $0.000 $7.228 $0.000 1868 $6.392 $0.000 $0.000 $0.000 $6.135 $0.000 1869 $6.067 $0.000 $0.000 $0.000 $5.808 $0.000 1870 $7.051 $0.000 $0.000 $0.000 $6.733 $0.000 1871 $7.077 $0.000 $0.000 $0.000 $6.726 $0.000 1872 $6.947 $0.000 $0.000 $0.000 $6.568 $0.000 1873 $6.370 $0.000 $0.000 $0.000 $5.955 $0.000 1874 $6.255 $0.000 $0.000 $0.000 $5.751 $0.000 1875 $6.173 $0.000 $0.000 $0.000 $5.649 $0.000 1876 $6.454 $0.000 $0.000 $0.000 $5.884 $0.000 1877 $6.304 $0.000 $0.000 $0.000 $5.741 $0.000 1878 $6.106 $0.000 $0.000 $0.000 $5.485 $0.000 1879 $6.466 $0.000 $0.000 $0.000 $5.823 $0.000 1880 $7.642 $0.000 $0.000 $0.000 $6.948 $0.000 1881 $8.283 $0.000 $0.000 $0.000 $7.515 $0.000 1882 $9.279 $0.000 $0.000 $0.000 $8.408 $0.000 1883 $9.443 $0.000 $0.000 $0.000 $8.470 $0.000 1884 $8.517 $0.000 $0.000 $0.000 $7.576 $0.000 1885 $8.140 $0.000 $0.000 $0.000 $7.191 $0.000 1886 $8.645 $0.000 $0.000 $0.000 $7.648 $0.000 1887 $9.550 $0.000 $0.000 $0.000 $8.441 $0.000 1888 $9.818 $0.000 $0.000 $0.000 $8.620 $0.000 1889 $10.305 $0.000 $0.000 $0.000 $9.002 $0.000 1890 $10.791 $0.000 $0.000 $0.000 $9.374 $0.000 1891 $10.663 $0.000 $0.000 $0.000 $9.140 $0.000
- 27. 1892 $9.905 $0.000 $0.000 $0.000 $8.251 $0.000 1893 $10.993 $0.000 $0.000 $0.000 $9.186 $0.000 1894 $9.535 $0.000 $0.000 $0.000 $7.660 $0.000 1895 $10.300 $0.000 $0.000 $0.000 $8.323 $0.000 1896 $10.785 $0.000 $0.000 $0.000 $8.672 $0.000 1897 $11.036 $0.000 $0.000 $0.000 $8.915 $0.000 1898 $12.674 $0.000 $0.000 $0.000 $10.392 $0.000 1899 $15.667 $0.000 $0.000 $0.000 $13.231 $0.000 1900 $17.169 $0.000 $0.000 $0.000 $14.544 $0.000 1901 $17.483 $0.000 $0.000 $0.000 $14.685 $0.000 1902 $16.325 $0.000 $0.000 $0.000 $12.300 $0.000 1903 $16.146 $0.000 $0.000 $0.000 $12.683 $0.000 1904 $15.381 $0.000 $0.000 $0.000 $11.976 $0.000 1905 $16.049 $0.000 $0.000 $0.000 $12.390 $0.000 1906 $17.381 $0.000 $0.000 $0.000 $13.119 $0.000 1907 $18.818 $0.000 $0.000 $0.000 $13.341 $0.000 1908 $17.628 $0.000 $0.000 $0.000 $12.767 $0.000 1909 $17.930 $0.000 $0.000 $0.000 $13.209 $0.000 1910 $19.886 $0.000 $0.000 $0.000 $13.818 $0.000 1911 $20.932 $0.000 $0.000 $0.000 $13.545 $0.000 1912 $20.467 $0.000 $0.000 $0.000 $13.289 $0.000 1913 $20.913 $0.761 $0.000 $0.761 $13.304 $0.000 1914 $19.809 $0.872 $0.000 $0.872 $12.596 $0.000 1915 $17.766 $1.000 $0.000 $1.000 $10.894 $0.000 1916 $17.392 $2.373 $1.294 $1.078 $11.824 $0.000 1917 $20.367 $6.217 $2.900 $3.317 $14.017 $0.000 1918 $56.986 $38.310 $17.915 $20.394 $13.338 $0.000 1919 $70.296 $33.136 $15.556 $17.580 $9.469 $0.000 1920 $78.511 $42.894 $20.213 $22.681 $9.426 $0.000 1921 $73.619 $40.536 $19.179 $21.357 $12.250 $0.000 1922 $53.937 $28.253 $13.418 $14.835 $16.354 $0.000 1923 $53.500 $21.063 $10.038 $11.025 $16.825 $0.000 1924 $53.775 $22.313 $10.675 $11.638 $15.650 $0.000 1925 $49.366 $20.695 $9.939 $10.756 $15.134 $0.000 1926 $50.880 $22.916 $10.217 $12.699 $17.217 $0.000 1927 $55.173 $26.395 $10.852 $15.543 $27.284 $0.309 1928 $54.113 $26.100 $10.600 $15.500 $25.725 $0.325 1929 $53.588 $27.913 $13.125 $14.788 $25.613 $0.350 1930 $61.923 $29.500 $14.038 $15.462 $24.231 $0.385 1931 $56.042 $24.944 $11.183 $13.761 $22.775 $0.437 1932 $37.099 $14.761 $6.338 $8.423 $21.183 $0.465 1933 $53.443 $14.705 $6.639 $8.066 $34.016 $0.508 1934 $61.683 $12.556 $6.429 $6.127 $41.952 $0.460 1935 $70.797 $17.219 $8.375 $8.844 $46.547 $0.484 1936 $79.631 $21.708 $10.246 $11.462 $50.908 $0.508 1937 $92.552 $30.015 $14.507 $15.507 $50.701 $4.522 1938 $109.485 $39.545 $19.348 $20.197 $52.742 $8.667 1939 $109.431 $36.092 $17.200 $18.892 $54.292 $10.185 1940 $107.692 $32.031 $14.754 $17.277 $54.985 $11.538 1941 $136.783 $50.246 $18.507 $31.739 $69.377 $13.899 1942 $211.342 $104.368 $42.171 $62.197 $78.934 $15.342 1943 $336.679 $199.321 $81.037 $118.284 $119.160 $18.951
- 28. 1944 $626.817 $419.976 $240.256 $179.720 $162.207 $23.195 1945 $633.250 $409.726 $218.333 $191.393 $165.917 $22.536 1946 $509.945 $307.582 $177.549 $130.033 $160.110 $20.692 1947 $429.192 $255.192 $172.183 $83.010 $139.596 $21.288 1948 $418.177 $256.487 $170.841 $85.646 $127.982 $22.504 1949 $397.802 $240.829 $140.189 $100.640 $123.171 $25.099 1950 $385.195 $232.150 $139.336 $92.814 $114.000 $26.779 1951 $465.008 $293.025 $177.402 $115.623 $125.861 $33.492 1952 $579.016 $396.347 $225.169 $171.177 $131.460 $37.984 1953 $593.912 $408.432 $238.528 $169.904 $129.744 $40.984 1954 $601.865 $401.929 $234.460 $167.468 $141.635 $44.500 1955 $575.320 $372.864 $229.976 $142.888 $138.112 $49.152 1956 $640.110 $417.858 $253.449 $164.409 $145.756 $60.559 1957 $664.626 $433.489 $271.908 $161.580 $149.489 $62.527 1958 $637.081 $405.911 $257.215 $148.696 $142.067 $69.526 1959 $628.375 $397.265 $269.993 $127.272 $139.713 $71.257 1960 $723.188 $450.790 $295.036 $155.754 $161.667 $88.297 1961 $723.864 $444.943 $295.271 $149.671 $155.771 $97.914 1962 $706.922 $468.752 $323.199 $145.553 $112.177 $120.901 1963 $745.175 $483.685 $332.783 $150.902 $117.203 $138.497 1964 $776.641 $497.862 $335.841 $162.021 $120.793 $151.469 1965 $794.673 $505.122 $331.918 $173.204 $128.918 $151.313 1966 $866.457 $566.351 $367.192 $199.159 $119.583 $169.179 1967 $953.987 $612.160 $394.397 $217.763 $121.154 $209.090 1968 $938.485 $597.491 $421.632 $175.859 $120.055 $208.117 1969 $1,086.523 $720.506 $507.262 $213.244 $123.715 $226.831 1970 $1,065.232 $680.890 $499.514 $181.376 $121.204 $245.094 1971 $990.153 $597.963 $456.243 $141.720 $123.101 $250.392 1972 $1,063.123 $650.785 $485.831 $164.954 $126.051 $269.610 1973 $1,109.611 $670.188 $496.375 $173.813 $119.178 $303.433 1974 $1,144.452 $685.096 $517.183 $167.913 $111.891 $326.396 1975 $1,107.500 $646.853 $485.659 $161.194 $102.270 $335.452 1976 $1,120.526 $650.421 $494.748 $155.673 $108.380 $341.237 1977 $1,256.392 $750.947 $556.982 $193.965 $108.297 $376.276 1978 $1,310.036 $789.967 $593.403 $196.564 $101.679 $396.616 1979 $1,366.673 $836.336 $642.599 $193.737 $95.929 $409.850 1980 $1,343.148 $801.738 $633.945 $167.792 $100.969 $409.881 1981 $1,410.052 $816.598 $672.746 $143.852 $133.329 $429.927 1982 $1,369.769 $769.293 $660.186 $109.106 $120.027 $446.776 1983 $1,288.760 $699.485 $620.039 $79.446 $109.693 $448.485 1984 $1,371.370 $731.086 $614.023 $117.064 $115.465 $492.543 1985 $1,459.419 $787.002 $665.072 $121.930 $111.338 $524.396 1986 $1,502.373 $804.887 $681.561 $123.326 $107.105 $551.771 1987 $1,608.951 $897.331 $739.279 $158.053 $108.731 $568.556 1988 $1,644.309 $896.363 $725.463 $170.901 $112.322 $602.022 1989 $1,708.948 $946.519 $768.431 $178.088 $108.945 $617.259 1990 $1,689.182 $917.170 $764.131 $153.039 $110.206 $619.740 1991 $1,656.342 $888.403 $734.422 $153.981 $116.182 $619.447 1992 $1,663.613 $878.405 $725.555 $152.851 $119.640 $628.325 1993 $1,707.796 $927.811 $753.964 $173.846 $124.355 $631.488 1994 $1,816.335 $986.205 $783.629 $202.576 $138.216 $663.890 Revenues: 1900-Present 1995 $1,898.778 $1,049.506 $828.994 $220.511 $136.001 $678.308 $3,000.000
- 29. 1996 $1,979.809 $1,128.394 $894.301 $234.093 $3,000.000 $129.489 $691.967 1997 $2,105.893 $1,226.345 $983.288 $243.057 $134.209 $717.013 $2,500.000 1998 $2,259.790 $1,334.991 $1,087.383 $247.608 $142.154 $748.113 1999 $2,346.136 $1,366.059 $1,128.986 $237.073 $161.406 $783.463 $2,000.000 2000 $2,516.099 $1,505.278 $1,247.776 $257.502 $159.703 $808.947 2001 $2,405.109 $1,383.350 $1,200.893 $182.458 $1,500.000 $152.079 $836.175 2002 $2,203.805 $1,196.658 $1,020.624 $176.033 $145.735 $831.282 2003 $2,072.709 $1,076.136 $922.906 $153.230 $1,000.000 $142.092 $827.160 2004 $2,129.422 $1,130.612 $916.148 $214.463 $145.968 $828.627 $500.000 2005 $2,359.102 $1,320.377 $1,015.577 $304.800 $147.791 $867.786 2006 $2,555.467 $1,483.891 $1,108.185 $375.706 $150.387 $887.396 $0.000 2007 $2,650.402 $1,582.779 $1,200.691 $382.088 $137.125 $895.413 1900 1910 1930 1940 1950 1960 1970 1980 1990 1920 2000 2008 $2,506.783 $1,440.016 $1,137.786 $302.230 $139.503 $891.883 2009 $2,156.650 $1,099.764 $953.006 $146.758 $132.779 $897.255 Revenues $3,000.000 $2,500.000 $2,000.000 $1,500.000 $1,000.000 $500.000 $0.000 1812 1832 1852 1872 1892 1912 1952 1992 1792 1932 1972
- 33. s: 1900-Present Total Revenue
- 34. Total Revenue Total Income Tax Revenue Individual Income Tax Corporate Income Tax Other Taxes 2000 Social Insurance venues Total Revenue Total Income Tax Revenue Individual Income Tax Corporate Income Tax Other Taxes 1992 Social Insurance
- 35. Military Pensions Welfare Education Health Care Spending Spending Spending 1792 $0.027 $0.000 $0.000 $0.000 $0.000 1793 $0.026 $0.000 $0.000 $0.000 $0.000 1794 $0.094 $0.000 $0.000 $0.000 $0.000 1795 $0.051 $0.000 $0.000 $0.000 $0.000 1796 $0.026 $0.000 $0.000 $0.000 $0.000 1797 $0.025 $0.000 $0.000 $0.000 $0.000 1798 $0.060 $0.000 $0.000 $0.000 $0.000 1799 $0.093 $0.000 $0.000 $0.000 $0.000 1800 $0.102 $0.000 $0.000 $0.000 $0.000 1801 $0.066 $0.000 $0.000 $0.000 $0.000 1802 $0.044 $0.000 $0.000 $0.000 $0.000 1803 $0.040 $0.000 $0.000 $0.000 $0.000 1804 $0.038 $0.000 $0.000 $0.000 $0.000 1805 $0.044 $0.000 $0.000 $0.000 $0.000 1806 $0.053 $0.000 $0.000 $0.000 $0.000 1807 $0.057 $0.000 $0.000 $0.000 $0.000 1808 $0.083 $0.000 $0.000 $0.000 $0.000 1809 $0.102 $0.000 $0.000 $0.000 $0.000 1810 $0.069 $0.000 $0.000 $0.000 $0.000 1811 $0.067 $0.000 $0.000 $0.000 $0.000 1812 $0.256 $0.000 $0.000 $0.000 $0.000 1813 $0.349 $0.000 $0.000 $0.000 $0.000 1814 $0.339 $0.000 $0.000 $0.000 $0.000 1815 $0.326 $0.000 $0.000 $0.000 $0.000 1816 $0.305 $0.000 $0.000 $0.000 $0.000 1817 $0.180 $0.000 $0.000 $0.000 $0.000 1818 $0.161 $0.000 $0.000 $0.000 $0.000 1819 $0.217 $0.000 $0.000 $0.000 $0.000 1820 $0.182 $0.000 $0.000 $0.000 $0.000 1821 $0.151 $0.000 $0.000 $0.000 $0.000 1822 $0.133 $0.000 $0.000 $0.000 $0.000 1823 $0.151 $0.000 $0.000 $0.000 $0.000 1824 $0.171 $0.000 $0.000 $0.000 $0.000 1825 $0.174 $0.000 $0.000 $0.000 $0.000 1826 $0.211 $0.000 $0.000 $0.000 $0.000 1827 $0.196 $0.000 $0.000 $0.000 $0.000 1828 $0.205 $0.000 $0.000 $0.000 $0.000 1829 $0.209 $0.000 $0.000 $0.000 $0.000 1830 $0.219 $0.000 $0.000 $0.000 $0.000 1831 $0.241 $0.000 $0.000 $0.000 $0.000 1832 $0.265 $0.000 $0.000 $0.000 $0.000
- 36. 1833 $0.390 $0.000 $0.000 $0.000 $0.000 1834 $0.300 $0.000 $0.000 $0.000 $0.000 1835 $0.283 $0.000 $0.000 $0.000 $0.000 1836 $0.486 $0.000 $0.000 $0.000 $0.000 1837 $0.511 $0.000 $0.000 $0.000 $0.000 1838 $0.493 $0.000 $0.000 $0.000 $0.000 1839 $0.423 $0.000 $0.000 $0.000 $0.000 1840 $0.385 $0.000 $0.000 $0.000 $0.000 1841 $0.420 $0.000 $0.000 $0.000 $0.000 1842 $0.432 $0.000 $0.000 $0.000 $0.000 1843 $0.214 $0.000 $0.000 $0.000 $0.000 1844 $0.400 $0.000 $0.000 $0.000 $0.000 1845 $0.400 $0.000 $0.000 $0.000 $0.000 1846 $0.531 $0.000 $0.000 $0.000 $0.000 1847 $1.263 $0.000 $0.000 $0.000 $0.000 1848 $0.976 $0.000 $0.000 $0.000 $0.000 1849 $0.722 $0.000 $0.000 $0.000 $0.000 1850 $0.528 $0.000 $0.000 $0.000 $0.000 1851 $0.642 $0.000 $0.000 $0.000 $0.000 1852 $0.544 $0.000 $0.000 $0.000 $0.000 1853 $0.628 $0.000 $0.000 $0.000 $0.000 1854 $0.610 $0.000 $0.000 $0.000 $0.000 1855 $0.720 $0.000 $0.000 $0.000 $0.000 1856 $0.810 $0.000 $0.000 $0.000 $0.000 1857 $0.812 $0.000 $0.000 $0.000 $0.000 1858 $1.071 $0.000 $0.000 $0.000 $0.000 1859 $1.003 $0.000 $0.000 $0.000 $0.000 1860 $0.744 $0.000 $0.000 $0.000 $0.000 1861 $0.888 $0.000 $0.000 $0.000 $0.000 1862 $9.317 $0.000 $0.000 $0.000 $0.000 1863 $11.247 $0.000 $0.000 $0.000 $0.000 1864 $10.705 $0.000 $0.000 $0.000 $0.000 1865 $15.789 $0.000 $0.000 $0.000 $0.000 1866 $4.641 $0.000 $0.000 $0.000 $0.000 1867 $2.133 $0.000 $0.000 $0.000 $0.000 1868 $2.618 $0.000 $0.000 $0.000 $0.000 1869 $1.984 $0.000 $0.000 $0.000 $0.000 1870 $1.767 $0.000 $0.000 $0.000 $0.000 1871 $1.574 $0.000 $0.000 $0.000 $0.000 1872 $1.495 $0.000 $0.000 $0.000 $0.000 1873 $1.771 $0.000 $0.000 $0.000 $0.000 1874 $1.930 $0.000 $0.000 $0.000 $0.000 1875 $1.806 $0.000 $0.000 $0.000 $0.000
- 37. 1876 $1.706 $0.000 $0.000 $0.000 $0.000 1877 $1.633 $0.000 $0.000 $0.000 $0.000 1878 $1.632 $0.000 $0.000 $0.000 $0.000 1879 $1.930 $0.000 $0.000 $0.000 $0.000 1880 $2.258 $0.000 $0.000 $0.000 $0.000 1881 $2.213 $0.000 $0.000 $0.000 $0.000 1882 $2.498 $0.000 $0.000 $0.000 $0.000 1883 $2.770 $0.000 $0.000 $0.000 $0.000 1884 $2.439 $0.000 $0.000 $0.000 $0.000 1885 $2.551 $0.000 $0.000 $0.000 $0.000 1886 $2.536 $0.000 $0.000 $0.000 $0.000 1887 $2.925 $0.000 $0.000 $0.000 $0.000 1888 $3.084 $0.000 $0.000 $0.000 $0.000 1889 $3.567 $0.000 $0.000 $0.000 $0.000 1890 $4.035 $0.000 $0.000 $0.000 $0.000 1891 $4.635 $0.000 $0.000 $0.000 $0.000 1892 $4.900 $0.000 $0.000 $0.000 $0.000 1893 $5.693 $0.000 $0.000 $0.000 $0.000 1894 $5.685 $0.000 $0.000 $0.000 $0.000 1895 $5.692 $0.000 $0.000 $0.000 $0.000 1896 $5.574 $0.000 $0.000 $0.000 $0.000 1897 $5.759 $0.000 $0.000 $0.000 $0.000 1898 $7.649 $0.000 $0.000 $0.000 $0.000 1899 $1.111 $0.000 $0.000 $0.000 $0.000 1900 $8.503 $0.000 $0.000 $0.000 $0.000 1901 $8.610 $0.000 $0.000 $0.000 $0.000 1902 $7.650 $0.000 $0.125 $0.100 $0.075 1903 $7.690 $0.000 $0.127 $0.105 $0.073 1904 $7.736 $0.000 $0.074 $0.107 $0.074 1905 $8.166 $0.000 $0.134 $0.117 $0.076 1906 $8.217 $0.000 $0.133 $0.121 $0.076 1907 $8.084 $0.000 $0.132 $0.123 $0.075 1908 $8.526 $0.000 $0.140 $0.135 $0.081 1909 $8.788 $0.000 $0.144 $0.144 $0.086 1910 $8.855 $0.000 $0.145 $0.150 $0.091 1911 $9.127 $0.000 $0.150 $0.159 $0.095 1912 $9.202 $0.000 $0.151 $0.167 $0.102 1913 $9.283 $0.000 $0.152 $0.174 $0.109 1914 $9.787 $0.000 $0.149 $0.191 $0.128 1915 $10.170 $0.000 $0.149 $0.191 $0.170 1916 $9.745 $0.000 $0.157 $0.196 $0.176 1917 $13.417 $0.000 $0.133 $0.183 $0.200 1918 $89.662 $0.000 $0.113 $0.155 $0.239