
Recommandé
Recommandé
Contenu connexe
En vedette
En vedette (16)
Similaire à Europe heart journal Advance DEC-2012
Similaire à Europe heart journal Advance DEC-2012 (20)
Plus de drucsamal
Plus de drucsamal (20)
Dernier
Dernier (20)
Europe heart journal Advance DEC-2012
- 1. ..................................................................................................................................................................................... ..................................................................................................................................................................................... CLINICAL RESEARCH Predicting survival in heart failure: a risk score based on 39 372 patients from 30 studies Stuart J. Pocock1*, Cono A. Ariti1, John J.V. McMurray2, Aldo Maggioni3, Lars Køber4, Iain B. Squire5, Karl Swedberg6, Joanna Dobson1, Katrina K. Poppe7, Gillian A. Whalley7, and Rob N. Doughty7, on behalf of the Meta-Analysis Global Group in Chronic Heart Failure (MAGGIC) 1 Department of Medical Statistics, London School of Hygiene and Tropical Medicine, Keppel Street, London WC1E 7HT, UK; 2 Institute of Cardiovascular and Medical Sciences, University of Glasgow, Glasgow, UK; 3 ANMCO Research Centre, Florence, Italy; 4 Rigshospitalet—Copenhagen University Hospital, Copenhagen, Denmark; 5 Department of Cardiovascular Sciences, The University of Leicester, Leicester, UK; 6 Sahlgrenska University, Hospital/O¨ stra, Go¨teborg, Sweden; and 7 Department of Medicine, University of Auckland, Auckland, New Zealand Received 22 May 2012; revised 3 August 2012; accepted 13 September 2012 Aims Using a large international database from multiple cohort studies, the aim is to create a generalizable easily used risk score for mortality in patients with heart failure (HF). Methods and results The MAGGIC meta-analysis includes individual data on 39 372 patients with HF, both reduced and preserved left- ventricular ejection fraction (EF), from 30 cohort studies, six of which were clinical trials. 40.2% of patients died during a median follow-up of 2.5 years. Using multivariable piecewise Poisson regression methods with stepwise vari- able selection, a final model included 13 highly significant independent predictors of mortality in the following order of predictive strength: age, lower EF, NYHA class, serum creatinine, diabetes, not prescribed beta-blocker, lower sys- tolic BP, lower body mass, time since diagnosis, current smoker, chronic obstructive pulmonary disease, male gender, and not prescribed ACE-inhibitor or angiotensin-receptor blockers. In preserved EF, age was more predictive and systolic BP was less predictive of mortality than in reduced EF. Conversion into an easy-to-use integer risk score iden- tified a very marked gradient in risk, with 3-year mortality rates of 10 and 70% in the bottom quintile and top decile of risk, respectively. Conclusion In patients with HF of both reduced and preserved EF, the influences of readily available predictors of mortality can be quantified in an integer score accessible by an easy-to-use website www.heartfailurerisk.org. The score has the potential for widespread implementation in a clinical setting. ----------------------------------------------------------------------------------------------------------------------------------------------------------- Keywords Heart failure † Meta-analysis † Prognostic model † Mortality Introduction Heart failure (HF) is a major cause of death, but prognosis in indi- vidual patients is highly variable. Quantifying a patient’s survival prospects based on their overall risk profile will help identify those patients in need of more intensive monitoring and therapy, and also help target appropriate populations for trials of new therapies. There exist previous risk models for patients with HF.1 –8 Each uses a single cohort of patients and hence their generaliz- ability to other populations is questionable. Each model’s development is from a limited cohort size, compromising the ability to truly quantify the best risk prediction model. Also most models are restricted to patients with reduced left- ventricular ejection fraction (EF), thus excluding many HF patients with preserved EF. The Meta-analysis Global Group in Chronic Heart Failure (MAGGIC) provides a comprehensive opportunity to develop a prognostic model in HF patients, both with reduced and preserved EF. We use readily available risk factors based on 39 372 patients from 30 studies to provide a user-friendly score that readily quan- tifies individual patient mortality risk. * Corresponding author. Tel: +44 207 927 2413, Fax: +44 207 637 2853, Email: stuart.pocock@lshtm.ac.uk Published on behalf of the European Society of Cardiology. All rights reserved. & The Author 2012. For permissions please email: journals.permissions@oup.com European Heart Journal doi:10.1093/eurheartj/ehs337 European Heart Journal Advance Access published October 24, 2012 byguestonNovember30,2013http://eurheartj.oxfordjournals.org/Downloadedfrom
- 2. Methods The MAGGIC program’s details are documented previously.9 Briefly, we have individual patient data from 31 cohort studies (six randomized clinical trials and 24 observational registries). Here one registry is excluded since it had only median 3-month follow-up. The remainder comprised 39 372 patients with a median follow-up of 2.5 years (inter- quartile range 1.0–3.9 years), during which 15 851 patients (40.2%) died. Thirty-one baseline variables were considered as potential pre- dictors of mortality (Table 1). The Coordinating Centre at the University of Auckland assembled the database for 29 studies. The London School of Hygiene and Trop- ical Medicine team the added in the CHARM trial data. The online Ap- pendix lists the MAGGIC investigators (Supplementary material online). In 18 studies, a preference was for rounding the EF to the nearest 5%. In these studies, such rounded values were re-allocated within 2.5% either side using a uniform distribution. Statistical methods Poisson regression models were used to simultaneously relate baseline variables to the time to death from any cause, with study fitted as a random effect. Since mortality risk is higher early on, the underlying Poisson rate was set in three time bands: up to 3 months, 3–6 months, and over 6 months. Models were built using forward stepwise regression with inclusion criterion P , 0.01. For binary and categorical variables, dummy variables were used. Quantitative variables were fitted as continuous measurements, unless there was a clear evidence of non-linearity, e.g. body mass index, EF, and creatinine. Also two highly significant statistical interac- tions were included in the main model: the impact of age and systolic blood pressure both depend on EF. Each variable’s strength of contribution to predicting mortality was expressed as the z statistic. The larger the z the smaller the P-value, e.g.: z values 3.29, 3.89, 5.32, and 6.11 are associated with P-values 0.001, 0.0001, 0.0000001, and 0.000000001, respectively. Missing values are handled by multiple imputations using chained equations.10,11 This method has three steps. First, for each variable with missing values, a regression equation is created. This model includes the outcome and follow-up time, in this case the Nelson– Aalen estimator (as recommended by White and Royston10 ), an indi- cator variable for each study and other model covariates. For continu- ous variables, this is a multivariable linear regression, for binary variables, a logistic regression, and for ordered categorical variables, an ordinal logistic regression. Once all such regression equations are defined, missing values are replaced by randomly chosen observed values of each variable in the first iteration. For subsequent iterations, missing values are replaced by a random draw from the distribution defined by the regression equations. This was repeated for 10 itera- tions, the final value being the chosen imputed value. This is similar to Gibbs sampling.12 This entire process was repeated 25 times, thus creating 25 imputed data sets. The next step was to estimate the model for each of these data sets. Finally, the model coefficients are averaged according to Rubin’s rule.13 This ensures that the estimated standard error of each averaged coefficient reflects both between and within imputation variances, giving valid inferences. We converted the Poisson model predictor to an integer score, which is then directly related to an individual’s probability of dying within 3 years. A zero score represents a patient at lowest possible risk. Having grouped each variable into convenient intervals, the score increases by an integer amount for each risk factor level above the lowest risk. Each integer is a rounding of the exact coefficient in the Poisson model, making log rate ratio 0.1 equivalent to 1 point. .................. .................. ................................................................................ ................................................................................ ................................................................................ ................................................................................ ................................................................................ Table 1 Descriptive statistics for baseline variables Alive (n 5 23 521) Died (n 5 15 851) Mean or % SD Mean or % SD Age (years) 64.3 11.8 71.9 10.9 Male, % 69.0 65.1 Non-Caucasian, % 10.7 7.8 Body mass index (kg/m2 ) 27.5 5.1 26.0 5.0 Current smoker, % 34.2 29.0 Ejection fraction, % 36.6 14.0 33.6 14.0 Systolic blood pressure (mmHg) 131.0 21.8 130.5 25.6 Diastolic blood pressure (mmHg) 77.7 12.1 75.5 13.5 Haemoglobin (g/L) 133.7 19.0 119.0 26.1 Heart failure duration ≥18 months, % 48.8 49.7 NYHA class, % I 10.8 6.7 II 53.8 37.1 III 31.3 42.8 IV 4.1 13.4 Creatinine (mmol/L) 109.4 55.8 126.9 58.4 Sodium (mmol/L) 139.7 3.6 138.9 4.2 Medical history, % Diabetes 20.6 25.7 Angina 40.3 38.6 MI 45.6 43.6 Atrial fibrillation 17.8 23.5 Stroke 6.2 12.2 COPD 5.7 17.0 Hypertension 41.3 39.3 Rales 22.3 41.7 Ischaemic heart disease 52.9 51.8 CABG 15.4 13.9 PCI 11.7 7.9 Branch bundle block 22.1 24.5 Oedema 21.4 31.9 Shortness of breath, % Resting 15.9 35.8 Exercise 80.8 78.8 Medications, % Beta-blocker 40.4 24.4 ACE-I 68.0 60.5 ARB 3.3 4.3 NYHA, New York Heart Association; COPD, chronic obstructive pulmonary disease; ACE-I, angiotensin-converting enzyme inhibitor; ARB, angiotensin-receptor blockers; PCI, percutaneous coronary intervention; CABG, coronary artery bypass grafting. S.J. Pocock et al.Page 2 of 10 byguestonNovember30,2013http://eurheartj.oxfordjournals.org/Downloadedfrom
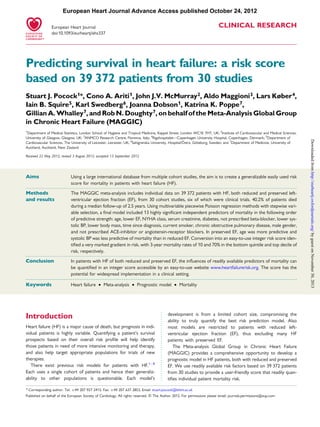
- 3. The data were analysed using Stata version 12.1 statistical package. Results This report is based on 39 372 patients from 30 studies: six were randomized controlled trials (24 041 patients) and 24 were regis- tries (15 331 patients). Supplementary material online Table S1 describes each of the 30 studies. Overall, 15 851 (40.2%) patients died during a median follow-up of 2.5 years. The six largest studies (DIAMOND,14 DIG,15 CHARM,16 and ECHOS17 trials and IN-CHF18 and HOLA19 registries) contributed 75.8% of patients and also 75.8% of deaths. There were 31 baseline variables available for inclusion in prognostic models. Table 1 provides their descriptive statistics for patients still alive and patients who died during follow-up. Using Poisson regression models for patient survival with forward stepwise variable selection, adjusting for study (random effect) and follow-up time (higher mortality rate in early follow- up), we identified 13 independent predictor variables (Table 2). All were highly significant P , 0.002, and most were overwhelm- ingly significant, i.e. P , 0.0001. Table 3 lists the extent of missing data for these 13 variables. A multiple imputation algorithm (see Methods) was used to overcome this problem. Consequently, all results are based on average estimates across 25 imputed data sets. For continuous variables, potential non-linearity in the predic- tion of survival was explored, as were potential statistical interac- tions between predictors. Hence the associations of EF, body mass index, and serum creatinine with mortality risk were, respectively, confined to EF ,40%, body mass index ,30 kg/m2 , and serum creatinine ,350 mmol/L. The mortality association of increased age was more marked with higher EF, whereas the inverse associ- ation of systolic blood pressure with mortality became more marked with lower EF. Figure 1 displays the independent impact of each predictor on mortality risk. The impact of age (which varies with EF) is particu- larly strong, and hence is shown on a different scale to the other plots. From the risk coefficients given in Table 2, an integer score has been created (Figure 2). For each patient, the integer amounts con- tributed by the risk factor’s values are added up to obtain a total integer score for that patient. The bell-shaped distribution of this integer risk score for all 39 372 patients is shown in Figure 3. The median is 23 points and the range is 0–52 points, with 95% of patients in the range of 8–36 points. The curve in Figure 3 relates a patient’s score to their probability of dying within 3 ............................................................................................................................................................................... ............................................................................................................................................................................... ............................................................................................................................................................................... Table 2 Multivariable model predicting mortality in all 39 372 patients Variable Rate ratio 95% CI Log rate ratio Z P-value Age (per 10 years) 1.154 (1.092, 1.220) 0.143 5.08 ,0.0001 Males 1.115 (1.073, 1.159) 0.109 5.58 ,0.0001 BMI (per 1 kg/m2 increase up to 30 kg/m2 )a 0.965 (0.959, 0.972) 20.035 210.10 ,0.0001 Current smoker 1.159 (1.109, 1.210) 0.147 6.65 ,0.0001 SBP (per 10 mmHg increase) 0.882 (0.855, 0.910) 20.126 27.85 ,0.0001 Diabetes 1.422 (1.365, 1.481) 0.352 16.85 ,0.0001 NYHA I 0.788 (0.732, 0.848) 20.239 26.35 ,0.0001 II 1.000 III 1.410 (1.354, 1.467) 0.343 16.75 ,0.0001 IV 1.684 (1.580, 1.796) 0.521 16.05 ,0.0001 Ejection fraction (per 5% increase up to 40%)a 0.581 (0.539, 0.627) 20.542 214.03 ,0.0001 COPD 1.228 (1.152, 1.310) 0.206 6.36 ,0.0001 HF duration .18 months 1.188 (1.139, 1.240) 0.173 7.96 ,0.0001 Creatinine (per 10 mmol/L up to 350 mmol/L) 1.039 (1.035, 1.042) 0.038 19.82 ,0.0001 Beta-blocker 0.760 (0.726, 0.796) 20.274 211.77 ,0.0001 ACE-I/ARB 0.908 (0.856, 0.963) 20.096 23.26 0.002 Interaction of ejection fraction and ageb 1.040 (1.031, 1.049) 0.039 9.05 ,0.0001 Interaction of ejection fraction and SBPc 1.012 (1.008, 1.017) 0.012 5.13 ,0.0001 BMI, body mass index; SBP, systolic blood pressure; NYHA, New York Heart Association; COPD, chronic obstructive pulmonary disease; HF, heart failure; ACE-I, angiotensin-converting enzyme inhibitor; ARB, angiotensin-receptor blockers. a The BMI variable has a linear trend up to 30 kg/m2 , while above 30 kg/m2 the risk is constant. Similarly, for ejection fraction, the risk is constant above 40%, and for creatinine risk is constant above 350 mmol/L. b The interaction between ejection fraction and age indicates an extra 4% increase in mortality for each simultaneous 10-year increase in age and 5% increase in ejection fraction on top of the risks of ejection fraction and age considered independently, i.e. the protective effect of increased ejection fraction function diminishes as a patient ages (Figure 1). c The interaction between ejection fraction and SBP indicates an extra 1.2% increase in mortality for each simultaneous 10 mmHg increase in SBP and 5% increase in ejection fraction on top of the risks of ejection fraction and SBP considered independently, i.e. the protective effect of increased ejection fraction function diminishes as a patient’s SBP increases (Figure 1). Predicting survival in heart failure Page 3 of 10 byguestonNovember30,2013http://eurheartj.oxfordjournals.org/Downloadedfrom
- 4. years. For instance, scores of 10, 20, 30, and 40 have 3-year prob- abilities 0.101, 0.256, 0.525, and 0.842, respectively. Table 4 details the link between any integer score and the probabilities of dying within 1 year and 3 years. Figure 4 shows mortality over 3 years for patients classified into six risk groups. Groups 1–4 comprise patients with scores 0–16, 17–20, 21–24, and 25–28, respectively, approximately the first four quintiles of risk. To give more detail at higher risk, groups 5 and 6 comprise patients with scores 29–32 and 33 or more, ap- proximately the top two deciles of risk. The marked continuous separation of the six Kaplan–Meier curves is striking: the 3-year % dead in the bottom quintile and top decile is 10 and 70%, respectively. Regarding model goodness-of-fit, Figure 5 compares observed and model-predicted 3-year mortality risk across the six risk groups. In the bottom two groups, the observed mortality is slight- ly lower than that predicted by the model, but overall the marked gradient in risk is well captured by the integer score. Tables 5 and 6 show two separate models for patients with reduced and preserved left-ventricular function (EF ,40 and ≥40%, respectively). For most predictors, the strength of mortality association is similar in both subgroups. However, the impact of age is more marked and the impact of lower SBP is less marked in patients with preserved left-ventricular function, consistent with the interactions in the overall model. In this meta-analysis of 30 cohort studies, we explored between- study heterogeneity in mortality prediction. From fitting separate models for each study, we observe a good consistency across studies re the relative importance of the predictors (data not shown). We have also repeated the model in Table 2, now fitting study as a fixed effect (rather than a random effect). This reveals substantial between-study differences in mortality risk not explained by predictors in our model. However, a comparison of the seven randomized trials with the 23 patient registries reveals no significant difference in their mortality rates. Discussion This study identifies 13 independent predictors of mortality in HF. Although all have been previously identified, the model and risk score reported here are the most comprehensive and generaliz- able available in the literature. They are based on 39 372 patients from 30 studies with a median follow-up of 2.5 years, the largest available database of HF patients. Also, we include patients with both reduced and preserved EF, the latter being absent from most previous models of HF prognosis. Given the wide variety of different studies included, with a global representation, the findings are inherently generalizable to a broad spectrum of current and future patients. Conversion of the risk model into a user-friendly integer score accessible by the website www.heartfailurerisk.org facilitates its use on a routine in- dividual patient basis by busy clinicians and nurses. All 13 predictors in the risk score should be routinely available, though provision will be made in the website for one or two vari- ables to be unknown for an individual. Note, the ‘top five’ predic- tors age, EF, serum creatinine, New York Heart Association (NYHA) class, and diabetes are important to know. The inverse as- sociation of EF with mortality is well established, and as previously reported,9 in above 40% there appears no further trend in progno- sis. We included serum creatinine rather than creatinine clearance or eGFR. The latter involve formulae that include age, which would artificially diminish the huge influence of age on prognosis. We confirm the association of body mass index with mortality,20 but with a cut-off of 30 kg/m2 , above which there appears no further trend. While others report heart rate as a significant pre- dictor of mortality,21 we find that once the strong influence of .......................................... .......................................... ............................................................................................................................................................................... Table 3 Extent of missing data Model variable Studies with no data Studies with some data Total patients missing data Studies Missing patients Studies Missing patients Age 0 0 0 0 0 Gender 0 0 0 0 0 BMI 17 14 515 13 2686 17 201 Current smoker 6 9166 24 448 9614 SBP 9 12 016 21 276 12 292 Diabetes 1 348 29 341 689 NYHA class 5 2503 25 1128 3631 Ejection fraction 6 3279 24 3558 6837 COPD 10 16 788 20 253 17 041 HF duration 20 11 679 10 1066 12 745 Creatinine 5 2800 25 17 245 20 045 Beta-blocker 3 7890 27 709 8599 ACE-I/ARB 1 97 29 649 746 BMI, body mass index; SBP, systolic blood pressure; NYHA, New York Heart Association; COPD, chronic obstructive pulmonary disease; HF, heart failure; ACE-I, angiotensin-converting enzyme inhibitor; ARB, angiotensin-receptor blockers. S.J. Pocock et al.Page 4 of 10 byguestonNovember30,2013http://eurheartj.oxfordjournals.org/Downloadedfrom
- 5. beta blocker use is included, heart rate was not a strong independ- ent predictor. A modest association of ACE-inhibitor and/or angio- tensin-receptor blockers (ARB) use with lower mortality was highly significant, though many of our cohorts were established before ARBs were routinely available. Cardiovascular disease history (e.g. myocardial infarction, angina, stroke, atrial fibrillation, LBBB) was considered in our model development. What mattered most was the time since first diagnosis of HF, best captured by whether this exceeds 18 months. Besides the powerful influence of diabetes, the other disease indicator of a poorer prognosis was prevalence of COPD. Previous myocardial infarction, atrial fibrillation, and LBBB were not sufficiently strong independent predictors of risk to be included in our model. For patients with reduced and preserved EF, we developed sep- arate risk models (Tables 5 and 6). Nearly all predictors display a Figure 1 Mortality rate ratios (and 95% CIs) for each variable in the predictive model. All charts are on the same scale except that for the interaction between ejection fraction and age, where the impact on mortality is more marked. Predicting survival in heart failure Page 5 of 10 byguestonNovember30,2013http://eurheartj.oxfordjournals.org/Downloadedfrom
- 6. similar influence on mortality in both subgroups. Two exceptions are age (better prognosis of preserved EF compared with reduced EF HF is more pronounced at younger ages) and systolic blood pressure, which have a stronger inverse association with mortality in patients with reduced EF. These two interactions are incorporated into the integer risk score, as displayed in Figure 1. Our meta-analysis of 30 cohort studies enables exploration of between-study differences in mortality risk. Separately, for each of the 10 largest studies, we calculated Poisson regression models for the same 13 predictors. Informal inspection of models across studies shows a consistent pattern to be expected, given there are no surprises among the selected predictors. An additional model, with study included as a fixed effect (rather than a random effect), reveals some between-study variation in mortality risk not captured by the predictor variables. This may be due to geographic variations or unidentified patient-selection criteria varying across registries and clinical trials, though overall patients in registries and trials appear at similar risk. Also, calendar Figure 2 A chart to calculate the integer risk score for each patient. Figure 3 Distribution of the integer risk score for all 39 372 patients, and its association with the risk of dying (and 95% CI) within 3 years. S.J. Pocock et al.Page 6 of 10 byguestonNovember30,2013http://eurheartj.oxfordjournals.org/Downloadedfrom
- 7. ............................................................................................................................................................................... Table 4 Predicted probabilities of death for each integer risk score Integer risk score 1-year probability of death 3-year probability of death Integer risk score 1-year probability of death 3-year probability of death 0 0.015 0.039 26 0.175 0.397 1 0.016 0.043 27 0.191 0.427 2 0.018 0.048 28 0.209 0.458 3 0.020 0.052 29 0.227 0.490 4 0.022 0.058 30 0.248 0.523 5 0.024 0.063 31 0.269 0.556 6 0.027 0.070 32 0.292 0.590 7 0.029 0.077 33 0.316 0.625 8 0.032 0.084 34 0.342 0.658 9 0.036 0.092 35 0.369 0.692 10 0.039 0.102 36 0.398 0.725 11 0.043 0.111 37 0.427 0.756 12 0.048 0.122 38 0.458 0.787 13 0.052 0.134 39 0.490 0.815 14 0.058 0.146 40 0.523 0.842 15 0.063 0.160 41 0.557 0.866 16 0.070 0.175 42 0.591 0.889 17 0.077 0.191 43 0.625 0.908 18 0.084 0.209 44 0.659 0.926 19 0.093 0.227 45 0.692 0.941 20 0.102 0.247 46 0.725 0.953 21 0.111 0.269 47 0.757 0.964 22 0.122 0.292 48 0.787 0.973 23 0.134 0.316 49 0.816 0.980 24 0.147 0.342 50 0.842 0.985 25 0.160 0.369 Figure 4 Cumulative mortality risk over 3 years for patients classified into six risk groups. Risk groups 1–4 represent the first four quintiles of risk (integer scores 0–16, 17–20, 21–24, and 25–28, respectively). Risk groups 5 and 6 represent the top two deciles of risk (integer scores 29–32 and 33 or more, respectively). 95% CIs are plotted at 1, 2, and 3 years follow-up. Figure 5 Observed vs. model-predicted 3-year mortality in six risk groups. Predicting survival in heart failure Page 7 of 10 byguestonNovember30,2013http://eurheartj.oxfordjournals.org/Downloadedfrom
- 8. year may be relevant since improved treatment of HF may enhance prognosis in more recent times. We will explore these issues in a subsequent publication. The integer risk score gives a very powerful discrimination of patients’ mortality risk over 3 years, and also has excellent goodness-of-fit to the data across all 30 studies combined (Figures 3 and 4). Specifically, the score facilitates the identification of low-risk patients, e.g. score ,17 has an expected 90% 3-year survival, and very high-risk patients, e.g. score ≥33 has an expected 30% 3-year survival. ............................................................................................................................................................................... ............................................................................................................................................................................... ............................................................................................................................................................................... Table 6 Main effects model for EF ≥40 (17 930 patients of whom 6951 died) Variable Rate ratio 95% CI Z P-value Age (per 10 years) 1.589 (1.536, 1.643) 27.14 ,0.001 Male 1.113 (1.053, 1.177) 3.77 ,0.001 BMI (per 1 kg/m2 increase up to 30 kg/m2) 0.960 (0.951, 0.969) 28.50 ,0.001 Current smoker 1.174 (1.095, 1.258) 4.54 ,0.001 SBP (per 10 mmHg) 0.982 (0.968, 0.998) 22.30 0.024 Diabetes 1.401 (1.311, 1.498) 9.90 ,0.001 NYHA class I 0.756 (0.682, 0.838) 25.32 ,0.001 II 1.000 III 1.458 (1.361, 1.561) 10.83 ,0.001 IV 1.756 (1.599, 1.928) 11.82 ,0.001 COPD 1.284 (1.181, 1.396) 5.91 ,0.001 HF duration .18 months 1.166 (1.088, 1.250) 4.37 ,0.001 Creatinine (per 10 mmol/L up to 350 mmol/L) 1.035 (1.029, 1.041) 11.39 ,0.001 Beta-blocker 0.798 (0.746, 0.855) 26.47 ,0.001 ARB/ACE-I 0.938 (0.842, 1.044) 21.21 0.233 BMI, body mass index; SBP, systolic blood pressure; NYHA, New York Hear Association; COPD, chronic obstructive pulmonary disease; HF, heart failure; ACE-I, angiotensin-converting enzyme inhibitor; ARB, angiotensin-receptor blockers. ............................................................................................................................................................................... ............................................................................................................................................................................... ............................................................................................................................................................................... Table 5 Main effects model for EF <40 (21 442 patients of whom 8900 died) Variable Rate ratio 95% CI Z P-value Age (per 10 years) 1.407 (1.375, 1.439) 29.54 ,0.001 Male 1.101 (1.044, 1.161) 3.57 ,0.001 BMI (per 1 kg/m2 increase up to 30 kg/m2 ) 0.970 (0.961, 0.978) 27.32 ,0.001 Current smoker 1.154 (1.091, 1.222) 4.99 ,0.001 SBP (per 10 mmHg increase) 0.936 (0.924, 0.948) 210.06 ,0.001 Diabetes 1.421 (1.347, 1.499) 13.00 ,0.001 NYHA classs I 0.828 (0.744, 0.922) 23.44 0.001 II 1.000 III 1.372 (1.303, 1.445) 12.03 ,0.001 IV 1.640 (1.503, 1.790) 11.21 ,0.001 Ejection fraction (per 5% increase) 0.915 (0.902, 0.928) 212.34 ,0.001 COPD 1.191 (1.096, 1.295) 4.17 ,0.001 HF duration .18 months 1.191 (1.127, 1.259) 6.22 ,0.001 Creatinine (per 10 mmol/L up to 350 mmol/L) 1.041 (1.035, 1.046) 15.65 ,0.001 Beta-blocker 0.736 (0.694, 0.781) 210.21 ,0.001 ACE-I/ARB 0.834 (0.770, 0.905) 24.47 ,0.001 BMI, body mass index; SBP, systolic blood pressure; NYHA, New York Heart Association; COPD, chronic obstructive pulmonary disease; HF, heart failure; ACE-I, angiotensin-converting enzyme inhibitor; ARB, angiotensin-receptor blockers. S.J. Pocock et al.Page 8 of 10 byguestonNovember30,2013http://eurheartj.oxfordjournals.org/Downloadedfrom
- 9. We recognize some limitations. In combining evidence across multiple studies, we inevitably encountered substantial missing data (Table 3), with a few variables (e.g. body mass index, HF dur- ation) missing in some entire cohorts. To overcome this problem, we used sophisticated computer-intensive multiple imputation methods. In addition, we have checked the robustness of our overall findings for each predictor by separate analyses within each cohort where full data for that predictor were available. Conventional good practice seeks to validate a new risk score on external data. That is important when a risk score arises from a single cohort in one particular setting, especially when that cohort has limited size. Here, the circumstances are different. We have a global meta-analysis of 30 cohorts with the largest numbers of patients and deaths ever investigated in HF. We found an internal consistency across studies in risk predictors, but inevitably found between-cohort differences in mortality risk not attributable to known risk factors, probably due to geographic variations and differing patient-selection criteria. Thus, no single external cohort can provide a sensible, generalizable validation of our risk model. We feel that internal validation found across studies is sufficient. There exist several other risk scores for predicting survival in HF.1–8 Best known is the Seattle Heart Failure Model.1 It was devel- oped from a small database, 1125 patients in the PRAISE clinical trial,22 confined to patients with severe HF: NYHA class III B or IV and EF ≤30%. Such patients account for ,20% of patients in our meta-analysis. Thus the robustness, applicability, and generalizability of the Seattle model are somewhat limited. Some variables in the Seattle model, e.g. serum sodium and haemoglobin, were not found to be independent predictors for inclusion in our model. Also, the Seattle model does not include diabetes, body mass index, and serum creatinine, well established risk factors in HF. A re- cently developed predictive model for survival is from the 3C-HF Study,2 but its relatively small size and only 1 year follow-up is limiting. Any new risk score’s success depends on the patient variables available for inclusion. Current knowledge of biomarkers in HF is inevitably ahead of what data are available across multiple cohort studies. For instance, natriuretic peptide level markedly influences prognosis in HF,8,23 but could not be included in our model. In principle, its inclusion would enhance further the excellent prog- nostic discrimination we achieved with routinely collected long- established predictors. The risk score is most applicable for patients at a stable point in their disease, the short-term impact of acute HF events being a separate matter. In conclusion, the risk score developed here on a huge database of 30 cohort studies provides a uniquely robust and generalizable tool to quantify individual patients’ prognosis in HF. The simplified integer score, accessible by the website www.heartfailurerisk.org makes findings routinely usable by busy clinicians. Such immediate awareness of a patient’s risk profile is of value in determining the most appropriate management and treatment of their HF. Supplementary material Supplementary material is available at European Heart Journal online. Funding K.K.P. is supported by the Heart Foundation of New Zealand. The work was supported by grants from the New Zealand National Heart Founda- tion, the University of Auckland, and the University of Glasgow. R.N.D. holds the New Zealand Heart Foundation Chair in Heart Health. Conflict of interest: none declared. References 1. Levy WC, Mozaffarian D, Linker DT, Sutradhar SC, Anker SD, Cropp AB, Anand I, Maggioni A, Burton P, Sullivan MD, Pitt B, Poole-Wilson PA, Mann DL, Packer M. The Seattle heart failure model: prediction of survival in heart failure. Circulation 2006;113:1424–1433. 2. Senni M, Parrella P, De Maria R, Cottini C, Bo¨hm M, Ponikowski P, Filippatos G, Tribouilloy C, Di Lenarda A, Oliva F, Pulignano G, Cicoira M, Nodari S, Porcu M, Cioffi G, Gabrielli D, Parodi O, Ferrazzi P, Gavazzi A. Predicting heart failure outcome from cardiac and comorbid conditions: the 3C-HF score. Int J Cardiol. Advance Access published November 28, 2011, doi:10.1016/j.ijcard.2011.10.071. 3. Pocock SJ, Wang D, Pfeffer MA, Yusuf S, McMurray JJ, Swedberg KB, Ostergren J, Michelson EL, Pieper KS, Granger CB. Predictors of mortality and morbidity in patients with chronic heart failure. Eur Heart J 2006;27:65–75. 4. O’Connor CM, Whellan DJ, Wojdyla D, Leifer E, Clare RM, Ellis SJ, Fine LJ, Fleg JL, Zannad F, Keteyian SJ, Kitzman DW, Kraus WE, Rendall D, Pina IL, Cooper LS, Fiuzat M, Lee KL. Factors related to morbidity and mortality in patients with chronic heart failure with systolic dysfunction: the HF-ACTION predictive risk score model. Circ Heart Fail 2012;5:63–71. 5. O’Connor CM, Hasselblad V, Mehta RH, Tasissa G, Califf RM, Fiuzat M, Rogers JG, Leier CV, Stevenson LW. Triage after hospitalization with advanced heart failure: the ESCAPE (Evaluation Study of Congestive Heart Failure and Pul- monary Artery Catheterization Effectiveness) risk model and discharge score. J Am Coll Cardiol 2010;55:872–878. 6. O’Connor CM, Abraham WT, Albert NM, Clare R, Gattis Stough W, Gheorghiade M, Greenberg BH, Yancy CW, Young JB, Fonarow GC. Predictors of mortality after discharge in patients hospitalized with heart failure: an analysis from the Organized Program to Initiate Lifesaving Treatment in Hospitalized Patients with Heart Failure (OPTIMIZE-HF). Am Heart J 2008;156:662–673. 7. Lee DS, Austin PC, Rouleau JL, Liu PP, Naimark D, Tu JV. Predicting mortality among patients hospitalized for heart failure: derivation and validation of a clinical model. JAMA 2003;290:2581–2587. 8. Wedel H, McMurray JJ, Lindberg M, Wikstrand J, Cleland JG, Cornel JH, Dunselman P, Hjalmarson A, Kjekshus J, Komajda M, Kuusi T, Vanhaecke J, Waagstein F. Predictors of fatal and non-fatal outcomes in the Controlled Rosu- vastatin Multinational Trial in Heart Failure (CORONA): incremental value of apolipoprotein A-1, high-sensitivity C-reactive peptide and N-terminal pro B-type natriuretic peptide. Eur J Heart Fail 2009;11:281–291. 9. Meta-analysis Global Group in Chronic Heart Failure (MAGGIC). The survival of patients with heart failure with preserved or reduced left ventricular ejection frac- tion: an individual patient data meta-analysis. Eur Heart J 2012;33:1750–7. 10. White IR, Royston P. Imputing missing covariate values for the Cox model. Stat Med 2009;28:1982–1998. 11. White IR, Royston P, Wood AM. Multiple imputation using chained equations: issues and guidance for practice. Stat Med 2011;30:377–399. 12. Gelman A. Bayesian Data Analysis. 2nd ed. London, New York: Chapman & Hall; 2004. 13. Rubin DB. Multiple Imputation for Nonresponse in Surveys. New York; Chichester: Wiley; 1987. 14. Gustafsson F, Torp-Pedersen C, Brendorp B, Seibaek M, Burchardt H, Kober L. Long- term survival in patients hospitalized with congestive heart failure: relation to pre- served and reduced left ventricular systolic function. Eur Heart J 2003;24:863–870. 15. Curtis JP, Sokol SI, Wang Y, Rathore SS, Ko DT, Jadbabaie F, Portnay EL, Marshalko SJ, Radford MJ, Krumholz HM. The association of left ventricular ejec- tion fraction, mortality, and cause of death in stable outpatients with heart failure. J Am Coll Cardiol 2003;42:736–742. 16. Pfeffer MA, Swedberg K, Granger CB, Held P, McMurray JJ, Michelson EL, Olofsson B, Ostergren J, Yusuf S, Pocock S. Effects of candesartan on mortality and morbidity in patients with chronic heart failure: the CHARM-Overall pro- gramme. Lancet 2003;362:759–766. 17. Torp-Pedersen C, Kober L, Carlsen JE, Akkan D, Bruun NE, Dacoronias D, Dickstein K, Haghfelt T, Ohlin H, McMurray JJ. A randomised trial of a pre- synaptic stimulator of DA2-dopaminergic and alpha2-adrenergic receptors on morbidity and mortality in patients with heart failure. Eur J Heart Fail 2008;10: 89–95. Predicting survival in heart failure Page 9 of 10 byguestonNovember30,2013http://eurheartj.oxfordjournals.org/Downloadedfrom
- 10. 18. Tarantini L, Faggiano P, Senni M, Lucci D, Bertoli D, Porcu M, Opasich C, Tavazzi L, Maggioni AP. Clinical features and prognosis associated with a pre- served left ventricular systolic function in a large cohort of congestive heart failure outpatients managed by cardiologists. Data from the Italian Network on Congestive Heart Failure. Ital Heart J 2002;3:656–664. 19. Martinez-Selles M, Garcia Robles JA, Prieto L, Dominguez Munoa M, Frades E, Diaz-Castro O, Almendral J. Systolic dysfunction is a predictor of long term mor- tality in men but not in women with heart failure. Eur Heart J 2003;24:2046–2053. 20. Kenchaiah S, Pocock SJ, Wang D, Finn PV, Zornoff LA, Skali H, Pfeffer MA, Yusuf S, Swedberg K, Michelson EL, Granger CB, McMurray JJ, Solomon SD. Body mass index and prognosis in patients with chronic heart failure: insights from the Candesartan in Heart failure: assessment of reduction in mortality and morbidity (CHARM) program. Circulation 2007;116:627–636. 21. Fox K, Ford I, Steg PG, Tendera M, Robertson M, Ferrari R. Heart rate as a prog- nostic risk factor in patients with coronary artery disease and left-ventricular sys- tolic dysfunction (BEAUTIFUL): a subgroup analysis of a randomised controlled trial. Lancet 2008;372:817–821. 22. Packer M, O’Connor CM, Ghali JK, Pressler ML, Carson PE, Belkin RN, Miller AB, Neuberg GW, Frid D, Wertheimer JH, Cropp AB, DeMets DL. Effect of amlodi- pine on morbidity and mortality in severe chronic heart failure. Prospective ran- domized amlodipine survival evaluation study group. N Engl J Med 1996;335: 1107–1114. 23. Pfister R, Diedrichs H, Schiedermair A, Rosenkranz S, Hellmich M, Erdmann E, Schneider CA. Prognostic impact of NT-proBNP and renal function in compari- son to contemporary multi-marker risk scores in heart failure patients. Eur J Heart Fail 2008;10:315–320. S.J. Pocock et al.Page 10 of 10 byguestonNovember30,2013http://eurheartj.oxfordjournals.org/Downloadedfrom