
Recommandé
Contenu connexe
Tendances
Tendances (18)
Similaire à Country-Risk Premium in the Periphery and the International Financial Cycle 1999-2019
Similaire à Country-Risk Premium in the Periphery and the International Financial Cycle 1999-2019 (20)
Plus de Grupo de Economia Política IE-UFRJ
Plus de Grupo de Economia Política IE-UFRJ (20)
Dernier
Dernier (20)
Country-Risk Premium in the Periphery and the International Financial Cycle 1999-2019
- 1. 1 Country-Risk Premium in the Periphery and the International Financial Cycle 1999-20191 Gabriel Aidar2 Julia Braga3 Abstract Taking into account the pull-push debate on the weight that external or internal factors have on the behavior of capital flows and country-risk premium of developing economies, the aim of this article is to assess empirically the extent by which the push factors, linked to global liquidity and interest rates, (compared to country-specific factors) play on the changes in the risk premium of a set of countries of the periphery, in the period 1999-2019. This is done using the methodology of Principal Component Analysis, which can relate the information from different countries to its common sources. We also test for a structural change in the premium risk series in 2003, by means of structural break tests. We find that push factors do play the predominant role in explaining country risk changes of our selected peripherical countries and that there was indeed a substantial general reduction in country risk premia after 2003, confirming that the external constraints of the periphery were significantly loosened by more favorable conditions in the international economy in the more recent period. The results are in line both with the view that cycles in peripherical economies are broadly subordinated to global financial cycles, in but also that such external conditions substantially improved compared to the 1990s. 1 The authors thank Franklin Serrano, Maryse Farhi and Carlos Bastos for their valuable comments and suggestions. All errors are our own. 2 PhD student at Institute of Economics – Federal University of Rio de Janeiro. gabriel.aidar@ppge.ie.ufrj.br 3 Professor at the Department of Economics – Fluminense Federal University (UFF). jbraga@id.uff.br
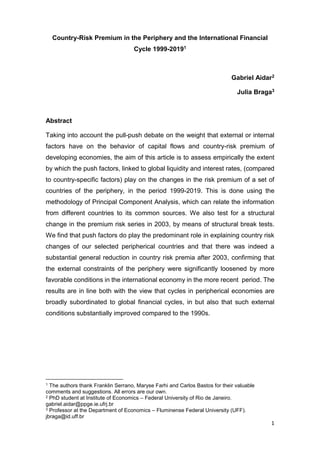
- 2. 2 1. Introduction Since the 1990s, the reintegration of some developing countries (that had been excluded after the debt crises of the 1980s) to international financial markets has been a key feature to understand its economic cycles. Medeiros (2008) shows that from 1990 on, the economic cycles of peripheral countries, usually correlated to commodity prices, regain a financial aspect related to their integration to international financial markets. The liberalization of capital accounts and the consequent flow of capital became a new source of instability for these countries. From an empirical perspective, the data from the 1990s raised a great debate over the main factors behind the flow of capital to developing economies (Hannan, 2018; Koepke, 2018). Indeed, the inspiration for this debate was the return of developing economies to international markets at the end of the 1980s (Calvo et al., 1993) and the first findings stressed the major role of external factors related to global liquidity (the also called "push" factors). This view was reinforced in the 2000s when impressive flows of capital to developing economies are observed again (Rey, 2015). The aim of this article is to inquire empirically to what extent the push factors linked to global liquidity play a major role (compared to country-specific factors) on the changes in the risk premium of a set of developing or “peripheral” economies in the period 1999-2019. The empirical motivation for the current investigation is given by Figure 1, which presents a strong correlation between a general measure of risk spread expressed by the EMBI+ and the specific EMBI Brazil4 risk premium. This apparent strong correlation is remarkable because the EMBI+ is composed by very different countries such as Brazil, Egypt and Malaysia. We test this connection between risk premium indicators by employing the Principal Component Analysis (PCA) as presented in Johnson and Wichern (2002) and Jolliffe (2002). According to this methodology, we try to find the fraction of the total variance of a set of sovereign risk series which can be explained by a subset of one or two principal components. We use the group of 4 The Emerging Bond Index (EMBI+) is a market index calculated by JP Morgan that measures the difference between the interest rate on dollar denominated sovereign bonds issued by emerging economies and the US Treasuries of the same maturity. We will return to this definition in the next sections.
- 3. 3 countries considered in the EMBI+ index for the period between January 1999 to January 2019. Depending on the size of this fraction, we may show the relative importance of common factors as determinant of the sovereign risk despite the differences in country-specific countries. The original use of this approach is found in Calvo et al. (1993). We also note in Figure 1 that both the EMBI+ and EMBI Brazil risk spreads seem to have been significantly reduced after 2003 (in spite of a spike around the time of the global financial crisis). So, we apply a structural break test in order to test for changes in the pattern of sovereign risk spreads in the 2000s. Moreover, we provide evidences that the common factors behind our set of country-risk premium can be explained by financial variables, namely the US interest rate, oil price and the VIX. Figure 01 – EMBI+ x EMBI Brazil Source: Authors based on JP Morgan data. As the country risk premium can be considered as part of the floor to feasible domestic interest rates under international capital mobility (Serrano and Summa, 2015), our results on its main determinants of sovereign risk may be relevant to assess the level of financial dependency of developing economies regarding international financial cycles. Therefore, our empirical results reinforce the push literature in the period 1999-2019 and confirm empirically that the expansionary 0 500 1.000 1.500 2.000 2.500 jan/98 ago/98 mar/99 out/99 mai/00 dez/00 jul/01 fev/02 set/02 abr/03 nov/03 jun/04 jan/05 ago/05 mar/06 out/06 mai/07 dez/07 jul/08 fev/09 set/09 abr/10 nov/10 jun/11 jan/12 ago/12 mar/13 out/13 mai/14 dez/14 jul/15 fev/16 set/16 abr/17 nov/17 jun/18 EMBI+ EMBI Brazil
- 4. 4 financial cycle in the 2000s (Akyüz, 2017; Freitas et al., 2016; Serrano, 2013) largely explain the fall in country-risk for selected developing economies. The paper is organized into five sections. After this introduction, the following section details the debate on pull-push factors on capital flows and the determinants of country-risk. In this section, we also discuss our main findings on country-risk determinants through the Principal Component Analysis. The third section provides an economic interpretation of the previous results and how the changes in the selected country-risk premium are related to changes in external financial conditions in the 2000s. The final section concludes the paper. 2. Country risk determinants 2 .1. The pull-push literature Calvo et al. (1993) note that the resumption of the flow of foreign capital to Latin American countries in the early 1990s occurs broadly, after the interruption in the middle of the previous decade. This fact seemed puzzling for these authors, since capitals return to flow into different developing countries, not just those who had supposedly adopted the reform agenda advocated in the period5. The amount of capital that flowed into the Latin American countries in the form of direct foreign investments and investments in portfolios reached US$ 670 billion in the period 1990-94 and it was five times the same amount that flowed in the period 1984-89 (Calvo et al., 1996). When analyzing the dynamics of variables such as international reserves, real exchange rate and inflation for ten Latin American countries6, Calvo et al., (1993) found that the common factors to these countries explain from 69% to 88% of the total variation of these indicators. The authors also found correlation among the co-movement of these factors and the recession of the US economy in the early 1990s, as well as the FED interest rate reduction process initiated in the second half of 1989. Based on Calvo et al. (1993) findings, Fernandez-Arias (1996) and Taylor and Sarno (1997) proposed to control the inflow of capital in the emerging economies by domestic factors. Calvo et al. (1993) also inspired several empirical studies with the aim to measure the role of external or internal factors prevailing in explaining the resumption of capital flows to Latin America in 5 The reform agenda, such as privatizations, financial liberalization, and fiscal adjustment were part of the conditionalities of the IMF and World Bank lending packages. For a review see Taylor (1997). 6 Namely: Argentina, Bolivia, Brazil, Chile, Colombia, Ecuador, Mexico, Peru, Uruguay, and Venezuela.
- 5. 5 the 1990s – also known as pull-push debate. As described by the survey of Koepke (2018) for those who defended the prevalence of push factors, the reasons for the resumption of the capital flow would be the fall of the Fed's interest rate and the recession in the US economy at the beginning of the 1990s. However, over the same decade, the Fed's interest rate has risen again, and the US economy recovered, but the capital flows to Latin America did not fall. In this context, those who defend the predominance of domestic factors to determine the attraction of capital gained some space. Associated with these factors would be the situation of the external accounts, the commercial and financial opening and, according to them, the adjustment of the public accounts. However, the indiscriminate capital inflows to different Latin American economies throughout the 1990s suggests that domestic factors hardly explain the capital flow on their own (Koepke, 2018). Moreover, throughout the literature, the domestic factors commonly found as being empirically significant were those associated with the situation of the external accounts of each country, which reflect the external vulnerability of developing economies. Hannan (2018) lists the domestic factors often put forth by the pull literature: trade liberalization, international reserves, exchange rate regime, institutional quality, per capita income, capital account opening and financial market development - and none of them are associated with fiscal policy choices. In the 2000s, after the international financial crisis and the consequent monetary easing in the US and Europe, the push side regained strength, as seen, for example, in Bruno and Shin (2013) and Rey (2015). For these authors, the monetary policy of the central economies is the main determinant of the global financial cycles. Thus, these studies seek to measure empirically the consequences of FED interest shocks on global risk perception and the international liquidity levels. An initial negative (positive) shock in the US interest rate may change the perception of global risk by itself and this movement triggers a wave of capital inflows (outflows) in emerging economies. This type of analysis is strongly connected with the sharp fall of interest rates in the central economies after 2009. It is worth noting that the pull-push literature was concerned not only with the measurement of capital flow determinants but also with its impact on the macroeconomic variables in the countries analyzed. This literature, from Calvo et al. (1993) to Rey (2015), sought to observe the impact of the international capital flow in the series of foreign exchange, reserves, bank credit, asset prices, and stock market performance. Hence, it was tried to evaluate how the global financial cycle could impact the national economies. The main concern of these authors was also to propose a policy recommendation for countries with external
- 6. 6 vulnerability related to financial cycles. Rey (2015) argues that the supposed impossible trinity (or trilemma) is in fact a dilemma: given that global liquidity is the main factor determining the flow of external capitals to developing countries, the choice is simply between the autonomy of monetary policy or the free mobility of capital, regardless of the exchange rate regime adopted. For this literature, the way in which international financial cycles are absorbed locally imposes the need for capital control in developing economies. The pull-push debate interests us to the extent that the sovereign risk premium reflects the appetite of non-resident investors to apply their resources in developing economies. Since the country-risk premium, in addition to the foreign interest rate and the expected devaluation of the exchange rate, define the floor for the domestic interest rate, its variation is central to understand the inflow/outflow of capital in developing economies. Therefore, we approach the pull-push controversy through the analysis of the determinants of the country-risk premium. The literature on the determinants of sovereign risk for Latin America countries is much influenced by Blanchard (2004), which proposes a link between domestic factors (fiscal indicators) and the level of country risk. Gupta et al. (2008) recognizes that the empirical literature linking country risk to fiscal policy is limited, but they try to demonstrate from a panel of thirty countries between 1997 and 2007 that levels of public deficit and debt are indicators of sovereign default. Thus, the authors try to show that these fiscal variables negatively affect the level of country risk. Using a panel data from 1998 to 2002 with 66 countries, Canuto et al. (2012) seeks to identify the variables that can explain the risk assessment by rating agency scores7. As a result, the authors find statistical significance in the gross public debt variable as a percentage of public revenues to explain the country risk scores. On the other side, there are authors who find co-movements for different series of country risk in emerging economies, which can be interpreted as push factors for the flow of capital. McGuire and Schrijvers (2003), using the factorial decomposition methodology, find that a single common factor explains about 80% of the common variance of the country risk premium for a basket of 15 countries8. Moreover, these authors observed a negative correlation of the 7 Our focus is to investigate country-risk determinants derived from market indices, which seek to reflect the risk priced perceived by sovereign bond investors. We discard in this work the analysis of risk ratings classified by rating agencies for two main reasons: (i) these agencies have commercial strategies that often do not translate the truly perceived market risk; (ii) these strategies also tend, in a longer run, to pursue market priced country risk, with no relevant difference between risk ratings and country risk indices. 8 The authors use EMBI Global as an indicator of the country risk premium. We will discuss these indicators later.
- 7. 7 common primary factor with interest rates indicators in the US and positive correlation with global markets volatility indicator. Accordingly, the co-movements of the sovereign risk series are linked to the global financial cycles, as in the pull- push debate. In the same way, Longstaff et al. (2011) conduct a principal component analysis and find that the first three principal components account for more than 50% of the common variance of the Credit Default Swap (CDS) series for a group of 26 countries. After this exercise, the authors run regressions of the monthly variations of the CDS series against local factors and external indicators. The average result is that the local factors chosen (local stock exchange volatility, official reserve variance, and nominal exchange rate variation) explain, on average, one-third of the CDS variation. The remainder would be explained mainly by indicators of return on the US stock market and return of US Treasury bonds. The existing empirical evidence on co-movements of sovereign risk series for developing countries supports the intuition behind our Figure 1 in the introduction. More specifically, we examine a set of developing economies between 1999 and 2019 and try study to what extent common (push) factors explain the variation in country-risk. Therefore, we will analyze the co-movements of the sovereign risk series of the economies that are part of the JP Morgan’s EMBI+. Before our empirical exercise, we briefly explain the country-risk indicators that we use in this paper. 2.2. EMBI + x CDS The Emerging Market Bond Index (EMBI+) is one of the most widespread country risk indicators and began to be calculated in 1993 by JP Morgan Chase. The index reflects the weighted average of the difference between the daily returns of sovereign debt instruments of emerging countries and the difference in yield of US Treasury securities of the same maturity. Originally, the index consisted of three types of debt instruments from emerging countries: Bradies, Eurobonds and external loans from sovereign entities. The weight of each is given by the fractions of its emission on the total issued. On March 31, 2016, the EMBI+ included 155 instruments from 16 emerging countries with a face value of US $ 309.2 billion and a market value of US $ 325.4 billion. JP Morgan Chase still makes the EMBI+ index available separately for each country participating in the index. The EMBI+ for Brazil is called EMBI+br. Its spread is known as Brazil’s country-risk and corresponds to the weighted average of the premiums paid by Brazilian foreign debt in relation to US Treasury of the same maturities.
- 8. 8 Typically, another widely used country risk indicator is the Credit Default Swap (CDS). The CDS is a credit derivative and has, in theory, the function of protecting its buyer in relation to the default risk of securities. In fact, the CDS is the main instrument in the credit derivative market, accounting for 89.3% of the credit derivatives transacted in the North American market9. The spread of the CDS corresponds to the premium paid for the derivative of the buyer and its swap occurs only in a situation of "credit events": bankruptcy, prepayment obligations, missed payments, default and restructuring (Farhi, 2009). This premium is ultimately equivalent to the country risk premium because, by arbitrage, the insured's premium is directly correlated with the implicit risk in the differential of the remuneration between the sovereign debt and Treasury bills. Thus, it is expected by arbitrage that the trends of the EMBI+ and CDS series will converge. Farhi (2009) argues that in the last years of the first decade of 2000, the country risk, measured by the EMBI+, had begun to lose its significance as an indicator of risk, due to two factors: (i) lower liquidity in the secondary markets and (ii) stronger volatility of US Treasury bills. CDS, on the other hand, had a strong growth in its trade rate in the same period, becoming an important indicator of the investors’ risk perception. Farhi (Ibid.) points out that the greater liquidity of the CDS would justify its greater use by market analysts since its spread would better reflect the perception of country risk by investors. However, the perception that the CDS reflects better the perception of risk than the EMBI+ may not be true. Since the CDS correspond to the purchases and sale of default insurance in exchange for the payment of a premium, this market can grow unconnected with the growth of the stock of bonds negotiated. In the Brazilian case, for instance, there was a negative net variation of the securities available abroad in the years 2000 (stock of the federal external public debt fell from US$ 166 billion in January 2016 to US$ 148 billion in December 2018). CDS’s faster reaction dynamic would be due to its greater liquidity despite the stagnation of issued sovereign bonds. However, the greater liquidity makes it possible for the CDS buyer to earn profits even without the occurrence of a "credit event" since the CDS can be resold if there is an increase in its price (which translates into a CDS rise for a specific country). Therefore, investors can earn profits if they choose a short position whenever the CDS of a given country starts to rise. In this example, as it becomes clear the profitability of the short position, investors may buy more CDS and contribute to its increase. This very speculative 9 Data updated for the third quarter of 2018, according to the Quarterly Report on Bank Derivatives Activities (https://www.occ.gov/topics/capital-markets/financial-markets/derivatives/derivatives- quarterly-report.html)
- 9. 9 movement can cause the elevation of the CDS of this given country. It is not difficult to conclude that this dynamic makes the CDS a highly speculative derivative. Despite the greater liquidity of the CDS, in this work we consider the EMBI+ as the main indicator of sovereign risk. First, because both have a very similar trend. It is worth noting that the CDS is consistently below the EMBI+ level during the last decade (Figure 2). This is explained by the fact that this instrument is normally linked to shorter maturities operations than EMBI+ (Central Bank of Brazil 2007). Second, as we have argued, the CDS can respond to strong speculative movements that do not reflect variations in the external fragility position of a country. Third, the EMBI+ has a longer track record than the CDS, as well as being made available to a larger number of countries. In our empirical study, we consider the EMBI+ country risk series for the following countries: Argentina, Brazil, Bulgaria, Colombia, Egypt, Ecuador, Philippines, Malaysia, Mexico, Panama, Peru, Russia, Venezuela, Ukraine, and Turkey10. The older series available begin in January 1998, but some countries have series starting later, as in the case of Malaysia, which has data only from July 2010 on. All series end in January 2019. Figure 02 – EMBI+ x CDS (Brazil) Source: JP Morgan and Bloomberg. 10 South Korea was excluded from the sample because since May 2004, it is no longer part of the EMBI+.
- 10. 10 Figure 03 – Sovereign Risk (EMBI+) Source: JP Morgan. 2.3. Principal component analysis results The Principal Component Analysis (PCA) goal is to summarize the information present in numerous time series in fewer time series that will contain the essential information of this original set of series (Jolliffe, 2002). It models the variance and covariance structure of a set of time series from linear combinations of the original series (their principal components). The principal components are then generated from the variance-covariance matrix derived from the series of original random variables, without requiring any assumption about the original distribution of these variables11 . The smaller number of components able to explain the greater variability of the original set of time series is interpreted as common factors that explain the variation of these series. In this paper, we will follow this interpretation to infer the degree of relevance of common factors in explaining the country risk premium variables of different developing countries. These common factors are usually linked to factors external to these countries in the push literature (Calvo et al., 1993). According to Johnson and Wichern (2002), the scalars associated with each time series in 11 See Johnson and Wichern (2002) to a formal presentation. 0 200 400 600 800 98 00 02 04 06 08 10 12 14 16 18 África do Sul 0 2,000 4,000 6,000 8,000 98 00 02 04 06 08 10 12 14 16 18 Argentina 0 500 1,000 1,500 2,000 2,500 98 00 02 04 06 08 10 12 14 16 18 Brasil 0 400 800 1,200 1,600 98 00 02 04 06 08 10 12 14 16 18 Bulgária 0 200 400 600 800 1,000 1,200 98 00 02 04 06 08 10 12 14 16 18 Colômbia 0 200 400 600 800 98 00 02 04 06 08 10 12 14 16 18 Egito 0 1,000 2,000 3,000 4,000 5,000 98 00 02 04 06 08 10 12 14 16 18 Equador 0 200 400 600 800 98 00 02 04 06 08 10 12 14 16 18 Filipinas 50 100 150 200 250 300 98 00 02 04 06 08 10 12 14 16 18 Malásia 0 200 400 600 800 1,000 98 00 02 04 06 08 10 12 14 16 18 México 0 200 400 600 800 98 00 02 04 06 08 10 12 14 16 18 Panamá 0 200 400 600 800 1,000 98 00 02 04 06 08 10 12 14 16 18 Peru 0 2,000 4,000 6,000 8,000 98 00 02 04 06 08 10 12 14 16 18 Venezuela 0 1,000 2,000 3,000 4,000 98 00 02 04 06 08 10 12 14 16 18 Ucrânia 0 200 400 600 800 1,000 1,200 98 00 02 04 06 08 10 12 14 16 18 Turquia 0 1,000 2,000 3,000 4,000 5,000 6,000 98 00 02 04 06 08 10 12 14 16 18 Rússia
- 11. 11 the eigenvalues obtained in the analysis are very similar in numerical terms to the correlation of the original series with the main component. It is also possible to address the correlation of the main components with exogenous variables. For example, it is possible to evaluate the correlation between one or more main components obtained with an indicator such as the VIX (Volatility Index), which measures the volatility of stock options in the S&P 500. As noted in Figure 03, the trajectories of the country risk premium curves have in common a sharp decline after 2004 and to rise in the years of the subprime financial crisis. The matrix of simple correlations among the country risk series reinforces the suspicion that there are common generating factors in these series. It is worth mentioning that Table 1 does not include Bulgaria, whose series ended in March 2014, and Malaysia, whose series began only in July 2010. Table 01 – Correlation Matrix of the EMBI+ Country Series Source: Authors. Simple correlation is greater than 0.50 in most cases. Negative correlations are observed, especially in the cases of the series of Egypt and Venezuela. In the case of the former, this is due to an abrupt rise of country risk during the Arab Spring, in which the central power was forcibly overthrown, and a new government was reestablished. This increase in country risk in 2010 was not accompanied by other countries. In the case of Venezuela, the country risk has raised since 2017, due to the current political crisis and recurrent coup threatens over these years. Again, this movement was not accompanied by other countries. It is worth mentioning, therefore, that situations of extreme political crisis, which threatens the current authority of central power, is, in fact, an idiosyncratic factor that affects the country risk premium of an economy without necessarily being linked to an external factor. When dealing with common factors there is also a possibility of contagion. Extreme situations associated with insolvency in foreign currency, as was the case of Argentina in 2001, can be transmitted to the premium country risk of other South Africa Argentina Brazil Colombia Egypt Ecuador Filipines Mexico Panama Peru Venezuela Ukraine Turkey Russia South Africa 1,00 0,59 0,81 0,88 0,34 0,73 0,55 0,95 0,80 0,81 0,35 0,50 0,86 0,75 Argentina 0,59 1,00 0,21 0,47 0,20 0,67 0,66 0,57 0,70 0,65 0,18 0,48 0,46 0,71 Brazil 0,81 0,21 1,00 0,87 0,31 0,59 0,26 0,84 0,64 0,68 0,40 0,50 0,67 0,59 Colombia 0,88 0,47 0,87 1,00 0,02 0,84 0,68 0,92 0,91 0,92 0,13 0,54 0,72 0,77 Egypt 0,34 0,20 0,31 0,02 1,00 0,10- 0,36- 0,27 0,08- 0,02- 0,42 0,10 0,26 0,06 Ecuador 0,73 0,67 0,59 0,84 0,10- 1,00 0,76 0,78 0,88 0,86 0,03- 0,53 0,60 0,80 Filipines 0,55 0,66 0,26 0,68 0,36- 0,76 1,00 0,56 0,85 0,84 0,38- 0,31 0,50 0,68 Mexico 0,95 0,57 0,84 0,92 0,27 0,78 0,56 1,00 0,82 0,84 0,33 0,59 0,84 0,80 Panama 0,80 0,70 0,64 0,91 0,08- 0,88 0,85 0,82 1,00 0,97 0,16- 0,58 0,64 0,85 Peru 0,81 0,65 0,68 0,92 0,02- 0,86 0,84 0,84 0,97 1,00 0,13- 0,55 0,64 0,85 Venezuela 0,35 0,18- 0,40 0,13 0,42 0,03- 0,38- 0,33 0,16- 0,13- 1,00 0,13 0,45 0,07 Ukraine 0,50 0,48 0,50 0,54 0,10 0,53 0,31 0,59 0,58 0,55 0,13 1,00 0,34 0,76 Turkey 0,86 0,46 0,67 0,72 0,26 0,60 0,50 0,84 0,64 0,64 0,45 0,34 1,00 0,61 Russia 0,75 0,71 0,59 0,77 0,06 0,80 0,68 0,80 0,85 0,85 0,07 0,76 0,61 1,00
- 12. 12 countries. There was a direct contagion, as can be seen in the curves of Latin American countries that seem to be affected by the Argentine shock, as well as by an indirect contagion mediated by the deterioration in the perception of global risk, which would be damage the risk premiums of countries such as the Philippines and Turkey. In addition to correlation, the principal component analysis indicates that it is possible to explain the EMBI+ series of developing economies with a few common factors. We present four different groupings of countries in order to verify if the results of the principal component analysis were robust. Moreover, although we have chosen to carry out the present analysis from the EMBI+ series, as explained previously, we apply the principal component analysis also to two groupings of countries from their CDS. The results are summarized in Figure 04, which shows the cumulative proportion of the global variance explained by the first and second major components. As can be seen in Figure 04, except for one group, all the others present at least 70% of the global variance explained by the first component. Jolliffe (2002) points out that this percentage would be enough to choose only one principal component to summarize the original set of series. When aggregating the second major component, the explained percentage jumps to 91% in one of the clusters. This indicates, as we shall see, that consideration of the two main components will suffice for economic interpretation. It is worth noting that results are maintained when the CDS is considered as a country risk indicator. The results found here confirm others works with the same methodology (Longstaff et al., 2011) and are in line with the push literature on capital flows. Annex I to this Article contains the individual and cumulative proportions of all the major components for each grouping.
- 13. 13 Figure 04 – Principal Components Source: Authors. In Group 1, the emerging economies that currently make up the EMBI + index were included, excluding Bulgaria, Malaysia, Morocco, Nigeria and Poland due to the unavailability of data in the period considered. In addition, we excluded Egypt and Venezuela due to an extreme political crisis, as already mentioned. In Group 1.1 we removed Ukraine from the sample, allowing the analysis to begin in July 1999 and capture, for example, the Argentine crisis of 2001. Group 1 comprises 10 countries with very different realities such as Russia and Philippines, and the principal component analysis indicates that 86% of the original variance of the risk premium can be explained by two main components (71% is explained by only the first principal component). In Group 2, only Latin American economies were selected, while Group 2.1 excluded Venezuela to control how this country could change the outcome. The intent of applying the main component analysis only in Latin American economies was to check whether the common factors become more relevant to a subset of economies that may be more subject to the contagion effect. The result indicates that there is slightly greater relevance of the first two main components in explaining the original variances of the series. So far, we showed the relevance of the first and second principal components in explaining the total variance of the original series, which is a strong evidence of common factors determining the country-risk premium. In the next section, we will evaluate in more detail the economic interpretation of these results. 72% 71% 66% 75% 70% 71% 83% 86% 81% 91% 83% 86% 0% 10% 20% 30% 40% 50% 60% 70% 80% 90% 100% Group 1 Group 1.1 Group 2 Group 2.1 Group 1 Group 2 1º CP 2º CP CDSEMBI
- 14. 14 3. An economic interpretation of the main component analysis results: international liquidity in the years 2000 and its developments for analyzed developing economies 3.1. The international liquidity expansion the 2000s Medeiros (2008) claims that the reintegration of Latin America countries to the financial markets in the late 1980s and early 1990s preceded an era of financial instabilities associated with commodity prices cycles. Crises arising from disruptions to the financial flow were frequent in the 1990s and particularly affected those countries that did not have any effective capital controls. In our principal component analysis, we showed that the country-risk premium, which is an important constraint to domestic interest rate in terms of external financing, is largely determined by common factors among developing economies. Now we explore the link among the common factors and the international liquidity cycles. According to Freitas et al. (2016) and Akyüz (2017), in the 1990s, the greater integration of the developing world led to a synchronization of cycles and, from the 2000s, this integration, together with changes in economic policies of a large number of developing countries, also contributed to a decoupling of the growth trend of the developing economies relative to the advanced countries. This movement would be strongly linked to the change in the external financing pattern of developing economies, expressed both by the large inflow of foreign capital to these countries and by the new trend of a substantial accumulation of international reserves. Figure 05 – Balance of Payment– Latin America (US$ billions) Source: Elaborated by authors based on World Economic Outlook e International Financial Statistics (FMI). -1.000 -500 0 500 1.000 1.500 2.000 2.500 3.000 3.500 -250 -200 -150 -100 -50 0 50 100 150 200 1980 1981 1982 1983 1984 1985 1986 1987 1988 1989 1990 1991 1992 1993 1994 1995 1996 1997 1998 1999 2000 2001 2002 2003 2004 2005 2006 2007 2008 2009 2010 2011 2012 2013 2014 2015 2016 2017 2018 Net FDI Net Portfolio Investment Current Account Official Reserves - excluding gold (right axis)
- 15. 15 Accoding to Serrano (2013) and Freitas et al. (2016), four factors help to explain the changing pattern observed in developing economies since the 2000s: (i) the maintenance of low interest rates in central countries; (ii) the large flow of capital to peripheral countries; (iii) the increase in the relative prices of the main mineral and agricultural commodity; and (iv) the rapid expansion of the domestic market and imports of the Chinese and other large developing economies in the period. Factors (i) and (ii) are strongly associated to the expansion of international liquidity in the search for higher yields. Thus, in addition to the low-interest rates, there is a general movement of improved risk perception of developing economies (Frenkel and Rapetti, 2011). This new pattern of external financing to developing economies is reflected in Figure 05. As Frenkel and Rappetti (2011) point out, the Latin American economies taken together presented a surplus in the current account between 2003 and 2007. After that, deficits have returned to the negative field, but the inflow of capital by the financial account more than compensated the deficit in current transactions. Serrano (2013) adds that many developing countries took advantage of this window of opportunity and improved the management of their balance of payments (and particular their financial accounts), something that contributed to this new and more positive external financing scenario. Many of these economies achieved to pay its official foreign debt stock, accumulated international reserves (Figure 05) and some established (or increased the assets in) Sovereign Funds. Central Banks also adopted a "dirty" managed floating exchange rate regime, in other to mitigate speculative attacks. These measures made developing countries more resilient to international shocks and allowed growth not be interrupted by the Balance of Payments constrain. This also led to a tendency to appreciate the exchange rate, with the exception of some Asian countries, in the period from 2004 until the 2008 international crisis, with a resumption of this movement in 2010. The general exchange appreciation movement of commodity exports, in its turn, contributed to the upward trend of commodity prices, exported by developing countries. Eichengreen (2016) identifies a sharp fall in the number of episodes of exchange rate crisis from 2003 onwards (Figure 06).
- 16. 16 Figure 06 – Foreign Exchange Crisis (number of episodes) Source: Eichengreen (2016) 3.2. Structural breaks for the country-risk premium This changing pattern in global liquidity translated into a fall of the country-risk premium (EMBI+) from an average of 864 from 1998 to 2002 to a level of around 350 in 2003 onwards. In the case of Brazil, which motivated our present work, the same movement occurred simultaneously at the EMBI Brazil and the CDS Brazil, from 2004 on (figure 07). Figures 07 – Structural breaks at EMBI+, EMBI Brazil and CDS Brazil. Source: Authors 0 200 400 600 800 1,000 1,200 1,400 1,600 Jan-98 Apr-99 Jul-00 Oct-01 Jan-03 Apr-04 Jul-05 Oct-06 Jan-08 Apr-09 Jul-10 Oct-11 Jan-13 Apr-14 Jul-15 Oct-16 Jan-18 EMBI+ 0.00 500.00 1,000.00 1,500.00 2,000.00 2,500.00 3,000.00 3,500.00 4,000.00 Oct-01 Nov-02 Dec-03 Jan-05 Feb-06 Mar-07 Apr-08 May-09 Jun-10 Jul-11 Aug-12 Sep-13 Oct-14 Nov-15 Dec-16 Jan-18 CDS Brazil 0 500 1000 1500 2000 2500 Jan-98 Apr-99 Jul-00 Oct-01 Jan-03 Apr-04 Jul-05 Oct-06 Jan-08 Apr-09 Jul-10 Oct-11 Jan-13 Apr-14 Jul-15 Oct-16 Jan-18 EMBI Brazil
- 17. 17 This structural change was captured by Bai and Perron (2003) structural break tests, in its different versions, as shown in Table 2. Additionally, it was performed two unit roots with structural breakpoints tests12. These tests are not consensual about the existence of the unit root in this series, but this was not the purpose of this exercise. The interest is only to corroborate the results of the test Bai Perron, showing that possible break dates match those found by Bai-Perron test. Tests indicate then an important change in the behavior from the second half of 2002, both for the specific series to Brazil and for the EMBI+, the year from which the risk had a significant drop and 2004/2005 as the year from which the settles down to a lower level. In the case of the CDS, whose series started in 2002, tests indicated a break in 2004, a year from which the series was significantly lower (Figure 07). Our empirical results reinforce both our central argument about external factors determining country-risk premium and the impact of international liquidity expansion in the 2000s on the external financing of developing countries. In other words, the liquidity expansion in advanced economies increased the capital flows to the periphery, and the combined effect of faster growth in South- South trade, better terms of trade and the massive accumulation of foreign reserves in a large number of developing countries contributed to a fall in the country-risk premium spreads. Table 02 – Structural Breaks Source: Authors 12 Minimum Dickey-Fuller as discussed by Vogelsang and Perron (1998) and the test of Lee and Strazicich (2003). Structural Breaks Tests EMBI Brazil EMBI+ CDS Brazil** Lee Strazicich* One Break 2002 Nov 2002 Nov 2004 Aug Two Breaks 1o break 2002 Sep 2002 Nov na 2o break 2004 Aug 2005 May na Dickey Fuller minimum t test 2002 Out 2002 Nov 2003 Mar Bai Perron (Break type: ) Bai tests of breaks in all recursively determined partitions 2002 Aug 2002 Nov 2004 Aug Fixed number of globally determined breaks 2002 Aug 2002 Nov 2004 Aug Compare information criteria for 0 to M globally determined breaks selected by Schwarz criterion 2002 Aug 2002 Nov 2004 Aug Bai-Perron tests of L+1 vs. L sequentially determined breaks 2002 Aug 2002 Nov 2004 Aug Bai-Perron tests of L+1 vs. L globally determined breaks 2002 Aug 2002 Nov 2004 Aug Fixed number of sequentially determined breaks One Break 2002 Aug 2002 Nov 2004 Aug Two Breaks 1o break 2002 Jul 2002 Nov na 2o break 2005 Sep 2007 Nov na *Maximum lag chosen by Schwert's (1989) principle ** Sample from Out 2001 to Jan 2019
- 18. 18 3.3. Country risk-premium and the international liquidity variables Following Calvo et al.(1993), we show the correlation among the first principal component – which we interpret as “common factors” to developing economies – and three key variables for determining the global financial cycle (in particular for developing economies): the interest rate corresponding to the Federal Fund Rate (FFR) and the interest rate corresponding to the 5-year Treasury Notes as an indicator of international reference interest rates, the Brent oil barrel price as a commodity price indicator and the VIX index as an indicator of risk perception. Table 02 – Correlation among the first principal component and selected variables Source: Authors. Table 03 presents the simple correlation analysis for the first principal component generated by Group 1.1 with each one of the above economic indicator of the global financial cycle. Due to the lack of consensus of unit root tests, and the possibility of structural breaks, we also tested the hypothesis of cointegration by using Lütkepohl et al. (2003) procedure. The test indicates that these four variables cointegrate as a group. Additionally, the test for the first component and each of one of three variables indicates the rejection of the null hypothesis of no cointegration (annex). We then estimate a cointegrated regression, supposing exogeneity for Brent Oil price, the VIX and the 5 years T note in explaining the first component, using Dynamics OLS. The estimation confirms the statistical significance of the explanatory variables (as shown p-value bellows each coefficient estimated) suggested by individual correlations in equation (1). 1st Principal Component = -0.02*BRENT + 0.15*VIX + 0.13*T_NOTE_5 (1) (0.0) (0.03) (0.03) The empirical exercise suggests then that an increase in the international interest rate coincides with a greater common perception of risk, as well as the increase in the VIX volatility index. It is worth mentioning that the correlation is higher with the 5 years rate and the volatility indicator. A possible explanation for this relationship is the fact that these variables carry implicitly the perception of market agents about the possible future trajectory of the US basic rate. The main FFR T Note 5 anos BRENT VIX 1º Componente Principal (Grupo 1.1) 0,359 0,535 -0,727 0,571
- 19. 19 principal factor is also negatively correlated with the oil price, which is expected, given the large weight of primary goods in exports. The series representing the two main components of Group 1.1. of our study (composed of 10 emerging economies) are represented in Figure 0813. The numerical calculation for obtaining the principal components alone is devoid of economic significance since they represent only the common factors to different time series. However, as the first principal component curve suggests, this major component of the country-risk series coincides with the change in the pattern of external financing observed from 2004 onwards. This may explain, even, its correlations with interest variables, market volatility, and commodity prices expressed in Table 02 and Equation (1). Put in another way, the first principal component replicates the changes in the global liquidity scenario. Figure 08 – Principal Components of Group 1.1 and EMBI+ Brazil Source: Authors. The curve of the first major component also highlights two particular moments that reflect a deterioration in the perception of risk in the emerging economies. The first one refers to the 2008 international financial crisis and, in this case, the curve quickly returns to the previous level. The second one was also a large rise 13 The main components are generated from the normalized eigenvalues. For a more detailed discussion, see Johnson and Wichern (2002). -6,0 -4,0 -2,0 0,0 2,0 4,0 6,0 8,0 10,0 jul/99 fev/00 set/00 abr/01 nov/01 jun/02 jan/03 ago/03 mar/04 out/04 mai/05 dez/05 jul/06 fev/07 set/07 abr/08 nov/08 jun/09 jan/10 ago/10 mar/11 out/11 mai/12 dez/12 jul/13 fev/14 set/14 abr/15 nov/15 jun/16 jan/17 ago/17 mar/18 out/18 1º PC 2º PC EMBI+ Brazil - normalized
- 20. 20 in the risk level in 10 emerging economies in 201414. Akyüz (2017) shows that this period was characterized by a strong exchange devaluation in some emerging countries, such as South Africa, Brazil, Mexico, and Turkey. The flow of capital to Latin American countries and their reserves also ceased to grow, although there is no loss of reserves. The author addresses this inflection in the path of the risk to the perception of a crisis in the Euro Zone and, back in 2013, with the signaling by the Fed that the cycle of liquidity expansion could be coming to an end. These two factors are highlighted by Figure 09, which points to the increase in the VIX volatility index at the end of 2014 and the US future interest rate (T-Note of 5 years) in May 201315. Therefore, the rise in country-risk premium during the years of 2013-2015 was largely due to a reversal in the international liquidity despite domestic economic or political facts. In this regard, Naqvi (2018) conducted 41 interviews with participants of the sovereign bond markets in Hong Kong and Singapore between January and April 2013, in parallel with a detailed analysis of the specialized media in the period. His conclusion is that the perception of risk of market players on the domestic fundamentals of the emerging economies is strongly influenced by international liquidity conditions. According to the author: “Relying on extensive interviews with market participants and examination of the financial press, this paper argues that not only was the post-global financial crisis (GFC) investment boom into EM sovereign bonds driven by push factors, including some not emphasized in existing literature such as crisis in unrelated markets that offered a similar risk/return profile, but also that investors’ perceptions of domestic fundamentals (the pull factors) were themselves influenced by these push factors, and so became divorced from reality. In addition to the macro-level push factors themselves, the micro-foundations of investors’ 14 It is worth noting that the second principal component presented in Figure 08 is also relevant, accounting alone for explaining about 15% of the total variance of 10 original series of country risk. This component seems to reproduce the effect of Argentina's external debt default on the perception of country risk of the emerging countries in 2001 and 2002. This effect would last until 2005, suggesting a memory of default episodes on the trajectory of country risk. The second principal component also seems to counterbalance the more general rise observed in the risk premium at the time of the international financial crisis in 2008. This is because some countries, notably Argentina and Brazil, experienced a relatively small increase in their country-risk premium in this period. 15 It is worth noting that despite the threat of a tightening of monetary policy by the FED, which automatically triggered an escalation of future interest rates, it only actually occurred in 2016. Since the emerging risk perception seems more correlated to future interest than to basic interest, this effect had already been felt in 2013/14 by emerging economies.
- 21. 21 decision making, including investors’ reliance on heuristics and shortcuts, the ways in which investors used market data to predict market reactions to changes in the push and pull factors, and the investment mandates and business models of institutional investors, made investors even more susceptible to the influence of push over pull factors.” (Naqvi, 2018, p. 2). The rapid reversal of country risk growth, observed in the first half of 2016 in several developing countries, is correlated with the fall in external volatility and 5 years T-Note interest rates (Figure 09). The rise of 14% in the commodity prices in 2017, after a falling from 2012 to 2016 (40% drop in metal and agricultural commodities measured by the IMF), also help to explain the improvement in external conditions. Figure 09 – Reversal of International Liquidity Source: Authors based on FED and Bloomberg data. 4. Final Remarks The present paper sought to investigate the role of financial integration of developing economies to international markets in the variability of the country risk variable. We recalled the pull-push debate on determinants of capital inflows in order to contextualize our empirical analysis. Our Principal Component Analysis of the country-risk spread series of ten emerging economies from 1999 to 2019 0,0 5,0 10,0 15,0 20,0 25,0 30,0 35,0 40,0 0,00 0,50 1,00 1,50 2,00 2,50 3,00 3,50 jan/10 abr/10 jul/10 out/10 jan/11 abr/11 jul/11 out/11 jan/12 abr/12 jul/12 out/12 jan/13 abr/13 jul/13 out/13 jan/14 abr/14 jul/14 out/14 jan/15 abr/15 jul/15 out/15 jan/16 abr/16 jul/16 out/16 jan/17 abr/17 jul/17 out/17 jan/18 abr/18 jul/18 out/18 jan/19 T-Note 5 years FFR VIX - right axis
- 22. 22 revealed that 86% of the total volatility of the original series can be represented by only two components, suggesting the prevalence of common factors in determining country risk. This evidence, reinforced by the correlation of the first major component with global liquidity indicators, corroborates our hypothesis that the sovereign risk trend is driven by external factors, in line with the push literature. Our contribution is to strengthen the thesis, expressed in Medeiros (2008), about the subordination of cycles in developing economies to global financial cycles. This in effect imposes an (asymmetric) constraint for the management of domestic monetary policy. To avoid capital outflows and/or successive exchange rate devaluations, the domestic interest rate should not remain lower than the international reference interest rate added to its risk premium (Serrano and Summa, 2015). This constraint, as we have seen, has changed significantly in the 2000s. In the recent expansionary cycle of global liquidity, many developing economies seems to have taken advantage of this window of opportunity to simultaneously grow more and reduce their external vulnerability. These two movements ended up having the combined effect of lowering the collective external fragility of the developing economies (Freitas et al., 2016; Serrano, 2013). As a result of this change, developing economies experienced a virtually unprecedented period of reduction of Balance of payments crises. As we have shown above, these favorable developments led to a once for all structural break at the level of sovereign risk spreads, that have fallen significantly after 2002. This seems to be the reason why the risk has not risen again to the levels prevailing in the 1990s. Although the risk spreads continued to respond to international financial indicators and has risen both during the 2008/2009 world financial crisis, and in 2014/15, when the FED threatened to raise the interest rate and cut the nonconventional monetary policies mechanisms, developing economies are in a better position to deal with those changes. This is what we read in current patter of risk premium spreads that, although still vary in response to changes of the relevant international financial indicators, do it around a significantly lower average.
- 23. 23 5. References Akyüz, Y. 2017. Playing with fire: Deepened financial integration and changing vulnerabilities of the Global South, United Kingdon, Oxford University Press Bai, J. and Perron, P. 2003. Computation and analysis of multiple structural change models, Journal of Applied Econometrics, vol. 18, no. 1, 1–22 Banco Central do Brasil. 2007. Análise Comparativa de Duas Medidas de Risco-Brasil: Credit Default Swaps e Embi+Br: Banco Central do Brasil Focus Blanchard, O. 2004. Fiscal dominance and inflation targeting: lessons from Brazil Bruno, V. and Shin, H. S. 2013. Capital Flows, Cross-Border Banking and Global Liquidity Calvo, G. A., Leiderman, L., and Reinhart, C. M. 1993. Capital inflows and real exchange rate appreciation in Latin America: the role of external factors, IMF Staff Papers, vol. 40, no. 1, 108–151 Calvo, G. A., Leiderman, L., and Reinhart, C. M. 1996. Inflows of Capital to Developing Countries in the 1990s, Journal of Economic Perspectives, vol. 10, no. 2, 123–39 Canuto, O., Dos Santos, P. F. P., and de Sá Porto, P. C. 2012. Macroeconomics and sovereign risk ratings, Journal of International Commerce, Economics and Policy, vol. 3, no. 02, 1250011-1-1250011– 25 Eichengreen, B. 2016. Global monetary order 29, The future of the international monetary and financial architecture, 21 Farhi, M. 2009. Subpprojeto de Derivativos de Crédito: BNDES-FECAMP Projeto de Pesquisa BNDES-FECAMP Fernandez-Arias, E. 1996. The new wave of private capital inflows: Push or pull?, Journal of Development Economics, vol. 48, no. 2, 389–418 Freitas, F., de Medeiros, C. A., and Serrano, F. 2016. Regimes de política econômica e o descolamento da tendência de crescimento dos países em desenvolvimento nos anos 2000, Dimensões estratégicas do desenvolvimento brasileiro. Continuidade e mudança no cenário global: desafios à inserção do Brasil, 17–46 Frenkel, R. and Rapetti, M. 2011. Fragilidad externa o desindustrialización: ¿Cuál es la principal amenaza para América Latina en la próxima década? CEPAL Macroeconomía del Desarrollo Gupta, M. S., Mati, A., and Baldacci, M. E. 2008. Is it (still) mostly fiscal? Determinants of sovereign spreads in emerging markets, IMF Working Paper, International Monetary Fund
- 24. 24 Hannan, S. A. 2018. Revisiting the Determinants of Capital Flows to Emerging Markets–A Survey of the Evolving Literature: International Monetary Fund Johnson, R. A. and Wichern, D. W. 2002. Applied Multivariate Statistical Analysis, Upper Saddle River, NJ, Pearson Prentice hall Jolliffe, I. 2002. Principal component analysis, New York, Springer Koepke, R. 2018. What Drives Capital Flows to Emerging Markets? A Survey of the Empirical Literature, Journal of Economic Surveys, vol. 0, no. 0 Lee, J. and Strazicich, M. C. 2003. Minimum Lagrange Multiplier Unit Root Test with Two Structural Breaks, The Review of Economics and Statistics, vol. 85, no. 4, 1082–89 Longstaff, F. A., Pan, J., Pedersen, L. H., and Singleton, K. J. 2011. How Sovereign Is Sovereign Credit Risk?, American Economic Journal: Macroeconomics, vol. 3, no. 2, 75–103 Lütkepohl, H., Saikkonen, P., and Trenkler, C. 2003. Comparison of tests for the cointegrating rank of a VAR process with a structural shift, Journal of Econometrics, vol. 113, no. 2, 201–29 Medeiros, C. A. de. 2008. Financial dependency and growth cycles in Latin American countries, Journal of Post Keynesian Economics, vol. 31, no. 1, 79–99 Naqvi, N. 2018. Manias, Panics and Crashes in Emerging Markets: An Empirical Investigation of the Post-2008 Crisis Period, New Political Economy, vol. 0, no. 0, 1–21 Rey, H. 2015. Dilemma not Trilemma: The Global Financial Cycle and Monetary Policy Independence: National Bureau of Economic Research 21162 Serrano, F. 2013. Continuity and Change in the International Economic Order: Towards a Sraffian Interpretation of the Changing Trend of Commodity Prices in the 2000s, pp. 195–222, in Sraffa and the Reconstruction of Economic Theory: Volume Two, UK, Springer Serrano, F. and Summa, R. 2015. Mundell–Fleming without the LM curve: the exogenous interest rate in an open economy, Review of Keynesian Economics, vol. 3, no. 2, 248–68 Taylor, L. 1997. Editorial: The revival of the liberal creed — the IMF and the World Bank in a globalized economy, World Development, vol. 25, no. 2, 145–52 Taylor, M. P. and Sarno, L. 1997. Capital Flows to Developing Countries: Long- and Short-Term Determinants, The World Bank Economic Review, vol. 11, no. 3, 451–70
- 25. 25 Vogelsang, T. J. and Perron, P. 1998. Additional Tests for a Unit Root Allowing for a Break in the Trend Function at an Unknown Time, International Economic Review, vol. 39, no. 4, 1073–1100
- 26. 26 ANNEX 1. Principal Component Analysis 1.1. EMBI 1.2. CDS 2. Cointegration test Grupo 1 CP Proportion Accumulated Proportion Grupo 1.1 CP Proportion Accumulated Proportion South Africa 1 0,724 0,724 oct/2006 to jan/2019 Argentina 1 0,713 0,713 july/1999 to jan/2019 Argentina 2 0,104 0,828 148 obs Brazil 2 0,152 0,864 235 obs Brazil 3 0,069 0,897 Colombia 3 0,047 0,911 Colombia 4 0,046 0,942 Ecuador 4 0,035 0,947 Ecuador 5 0,021 0,963 Filipines 5 0,025 0,971 Filipines 6 0,014 0,977 Mexico 6 0,013 0,984 Mexico 7 0,009 0,987 Panama 7 0,008 0,992 Panama 8 0,005 0,992 Peru 8 0,003 0,996 Peru 9 0,004 0,996 Russia 9 0,003 0,998 Russia 10 0,002 0,998 Turkey 10 0,002 1,000 Ukraine 11 0,002 0,999 Turkey 12 0,001 1,000 Grupo 2 CP Proportion Accumulated Proportion Grupo 2.1 CP Proportion Accumulated Proportion Argentina 1 0,658 0,658 may/1999 to jan/2019 Argentina 1 0,746 0,746 may/1999 to jan/2019 Brazil 2 0,155 0,813 237 obs Brazil 2 0,161 0,907 237 obs Colombia 3 0,112 0,925 Colombia 3 0,050 0,956 Ecuador 4 0,042 0,967 Ecuador 4 0,019 0,976 Panama 5 0,015 0,983 Panama 5 0,016 0,992 Mexico 6 0,011 0,994 Mexico 6 0,005 0,997 Peru 7 0,004 0,997 Peru 7 0,003 1,000 Venezuela 8 0,003 1,000 Grupo 1 CP Proporção Proporção Acumulada Grupo 2 CP Proporção Proporção Acumulada South Africa 1 0,700 0,700 june/2005 to jan/2019 Argentina 1 0,7061 0,706 june/2005 to jan/2019 Argentina 2 0,128 0,828 143 obs Brazil 2 0,1581 0,864 143 obs Brasil 3 0,081 0,909 Colombia 3 0,0794 0,944 Colombia 4 0,043 0,952 Peru 4 0,0443 0,988 Mexico 5 0,027 0,978 Mexico 5 0,012 1,000 Peru 6 0,010 0,989 Russia 7 0,007 0,996 Turkey 8 0,004 1,000 Component, Brent, VIX and Tnote5 Trace statistic, with shift correction test 10pct 5pct 1pct r <= 3 | 5.38 5.42 6.79 10.04 r <= 2 | 14.61 13.78 15.83 19.85 r <= 1 | 31.33 25.93 28.45 33.76 r = 0 | 57.09 42.08 45.20 51.60 Component and Brent test 10pct 5pct 1pct r <= 1 | 5.97 3.00 4.12 6.89 r = 0 | 31.32 10.45 12.28 16.42 Component and VIX test 10pct 5pct 1pct r <= 1 | 17.64 3.00 4.12 6.89 r = 0 | 41.14 10.45 12.28 16.42 Component and Tnote5 test 10pct 5pct 1pct r <= 1 | 4.38 3.00 4.12 6.89 r = 0 | 29.75 10.45 12.28 16.42